

Killing of targets by CD8 T cells in the mouse spleen follows the law of mass action
- PMID: 21283669
- PMCID: PMC3025913
- DOI: 10.1371/journal.pone.0015959
Killing of targets by CD8 T cells in the mouse spleen follows the law of mass action
Abstract
It has been difficult to correlate the quality of CD8 T cell responses with protection against viral infections. To investigate the relationship between efficacy and magnitude of T cell responses, we quantify the rate at which individual CD8 effector and memory T cells kill target cells in the mouse spleen. Using mathematical modeling, we analyze recent data on the loss of target cells pulsed with three different peptides from the mouse lymphocytic choriomeningitis virus (LCMV) in mouse spleens with varying numbers of epitope-specific CD8 T cells. We find that the killing of targets follows the law of mass-action, i.e., the death rate of individual target cells remains proportional to the frequency (or the total number) of specific CD8 T cells in the spleen despite the fact that effector cell densities and effector to target ratios vary about a 1000-fold. The killing rate of LCMV-specific CD8 T cells is largely independent of T cell specificity and differentiation stage. Our results thus allow one to calculate the critical T cell concentration at which growth of a virus with a given replication rate can be prevented from the start of infection by memory CD8 T cell response.
Conflict of interest statement
Figures
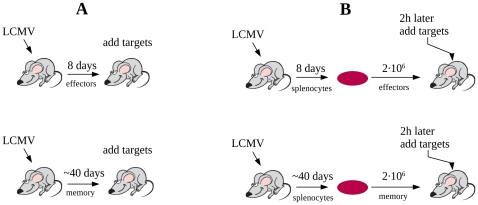
 target cells (pulsed with either NP296 or GP276 peptides of LCMV and unpulsed) were transferred into these mice. In the second set of experiments (“adoptive transfer”, panel B), P14 TCR Tg CD8
 T cells, specific to the GP33 epitope of LCMV, were transferred into B6 mice and then infected with LCMV-Arm. Eight or 40 days later, different number of effector (day 8) or memory (day 40) P14 CD8
 T cells from these mice were transferred into new naive B6 mice (in panel B, we shown an example where
  effectors or memory CD8
 T cells are transferred). Two hours later, two populations of
  targets (pulsed with the GP33 peptide of LCMV and unpulsed) were transferred into these mice now harboring GP33-specific CD8
 T cells. In both sets of experiments, killing of peptide-pulsed targets was measured in spleens of mice at different times after cell transfer .
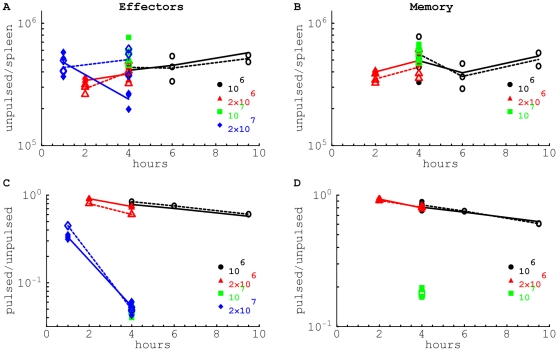
 ,
,  ,
,  , or
, or  P14 cells transferred. Filled symbols denote individual mouse measurements with the averages per time point being connected by solid lines. Open symbols are the model predictions with averages being connected by dashed lines. Parameters providing the best fits of the model are shown in Table 1. Note that in panel A, the model can not predict the decline in the number of unpulsed targets with time in experiments with transfer of
  GP33-specific effectors. Such decline in the number of unpulsed targets in the spleen is unexpected and is most likely due to a measurement error.
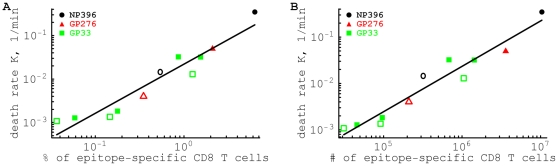
 T cells is calculated among all cells in the spleen. Estimates are given for targets pulsed with NP396 (
 ), GP276 (▴), or GP33 (▪) peptides from LCMV. Filled symbols are for killing by effector CD8
 T cells, and open symbols are for killing by memory CD8
 T cells. Lines show the linear regression for the
  transformed estimates of the death rate and density of CD8
 T cells. Slopes for the regressions are not statistically different from one (panel A: slope = 1.13,
  ; panel B: slope = 0.98,
  ).
).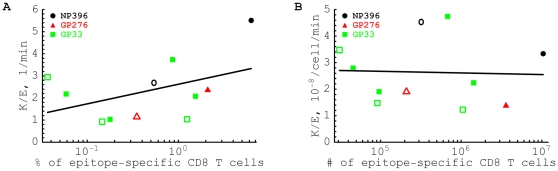
 by dividing the death rate of targets
  by the frequency (panel A) or the number (panel B) of epitope-specific CD8 T cells in the spleen
  . Notations are the same as in Fig. 3. Lines show linear regression for the estimates of the killing efficacy and
  transformed frequency (panel A) or number (panel B) of epitope-specific CD8
 T cells. Slopes for the regressions are not statistically different from zero (panel A: slope = 0.89,
  ; panel B: slope = −0.06,
  ). A large positive slope for the correlation between per capita killing
  and the frequency of epitope-specific CD8
 T cells in panel A is due to an outlier for killing by NP396-specific effector CD8
 T cells. Removing this outlier led to the estimated slope = 0.06,
  . The average killing efficacy of CD8
 T cells is
  (panel A) or
  (panel B).
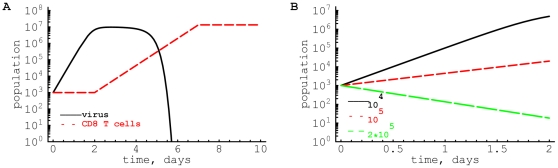
 ) over the course of infection when the initial number of virus-specific memory CD8
 T cells (
 ) is low (
 , panel A) or high (
 , panel B). Viral density declines following infection as memory CD8
 T cells reach the threshold level of
  cells per spleen. Other parameters are
  ,
,  ,
,  ,
,  ,
,  ,
,  .
.Similar articles
-
Estimating in vivo death rates of targets due to CD8 T-cell-mediated killing.J Virol. 2008 Dec;82(23):11749-57. doi: 10.1128/JVI.01128-08. Epub 2008 Sep 24. J Virol. 2008. PMID: 18815293 Free PMC article.
-
Bone marrow contains virus-specific cytotoxic T lymphocytes.Blood. 1997 Sep 1;90(5):2103-8. Blood. 1997. PMID: 9292550
-
Qualitatively different memory CD8+ T cells are generated after lymphocytic choriomeningitis virus and influenza virus infections.J Immunol. 2010 Aug 15;185(4):2182-90. doi: 10.4049/jimmunol.1001142. Epub 2010 Jul 16. J Immunol. 2010. PMID: 20639484
-
CD8 T cell memory in B cell-deficient mice.J Exp Med. 1996 May 1;183(5):2165-74. doi: 10.1084/jem.183.5.2165. J Exp Med. 1996. PMID: 8642326 Free PMC article.
-
Reduction of otherwise remarkably stable virus-specific cytotoxic T lymphocyte memory by heterologous viral infections.J Exp Med. 1996 Jun 1;183(6):2489-99. doi: 10.1084/jem.183.6.2489. J Exp Med. 1996. PMID: 8676069 Free PMC article.
Cited by
-
Mathematical modeling provides kinetic details of the human immune response to vaccination.Front Cell Infect Microbiol. 2015 Jan 9;4:177. doi: 10.3389/fcimb.2014.00177. eCollection 2014. Front Cell Infect Microbiol. 2015. PMID: 25621280 Free PMC article.
-
Quantifying T lymphocyte turnover.J Theor Biol. 2013 Jun 21;327:45-87. doi: 10.1016/j.jtbi.2012.12.025. Epub 2013 Jan 9. J Theor Biol. 2013. PMID: 23313150 Free PMC article.
-
A biased competition theory of cytotoxic T lymphocyte interaction with tumor nodules.PLoS One. 2015 Mar 27;10(3):e0120053. doi: 10.1371/journal.pone.0120053. eCollection 2015. PLoS One. 2015. PMID: 25815811 Free PMC article.
-
Mathematical modeling suggests cytotoxic T lymphocytes control growth of B16 tumor cells in collagin-fibrin gels by cytolytic and non-lytic mechanisms.bioRxiv [Preprint]. 2023 Mar 29:2023.03.28.534600. doi: 10.1101/2023.03.28.534600. bioRxiv. 2023. Update in: Viruses. 2023 Jun 27;15(7):1454. doi: 10.3390/v15071454. PMID: 37034693 Free PMC article. Updated. Preprint.
-
Investigating the Consequences of Interference between Multiple CD8+ T Cell Escape Mutations in Early HIV Infection.PLoS Comput Biol. 2016 Feb 1;12(2):e1004721. doi: 10.1371/journal.pcbi.1004721. eCollection 2016 Feb. PLoS Comput Biol. 2016. PMID: 26829720 Free PMC article.
References
-
- Pantaleo G, Koup R. Correlates of immune protection in HIV-1 infection: what we know, what we don't know, what we should know. Nat Med. 2004;10:806–10. - PubMed
-
- Plotkin SA. Vaccines: correlates of vaccine-induced immunity. Clin Infect Dis. 2008;47:401–9. - PubMed
-
- Darrah PA, Patel DT, De Luca PM, Lindsay RW, Davey DF, et al. Multifunctional TH1 cells define a correlate of vaccine-mediated protection against Leishmania major. Nat Med. 2007;13:843–50. - PubMed
Publication types
MeSH terms
Grants and funding
LinkOut - more resources
Full Text Sources
Research Materials
