. 2011 Jan 21;6(1):e16270.
doi: 10.1371/journal.pone.0016270.

Effects of non-thermal plasma on mammalian cells

Affiliations

Effects of non-thermal plasma on mammalian cells

Sameer Kalghatgi et al. PLoS One. .

Abstract

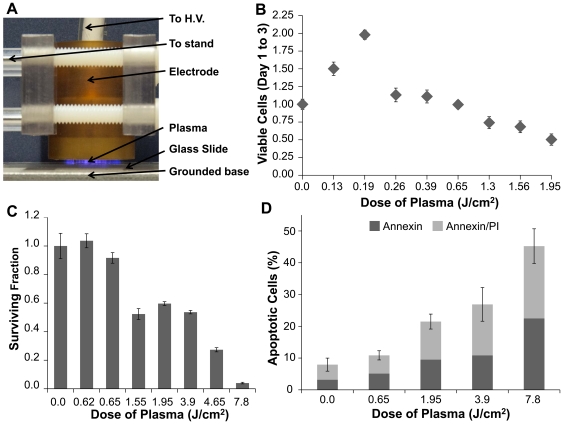
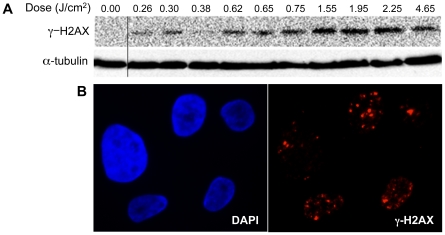
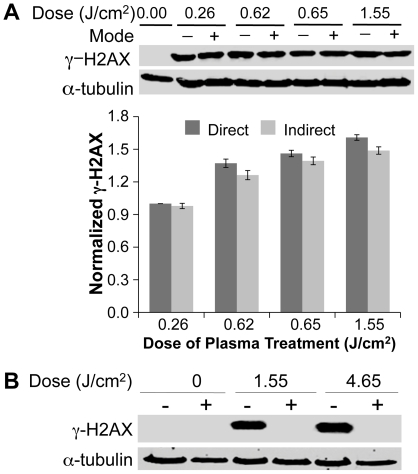
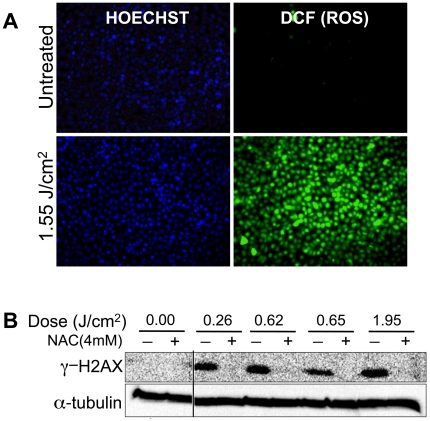
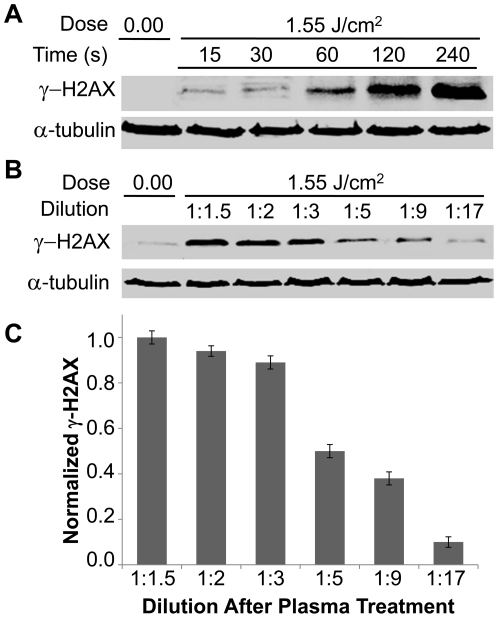
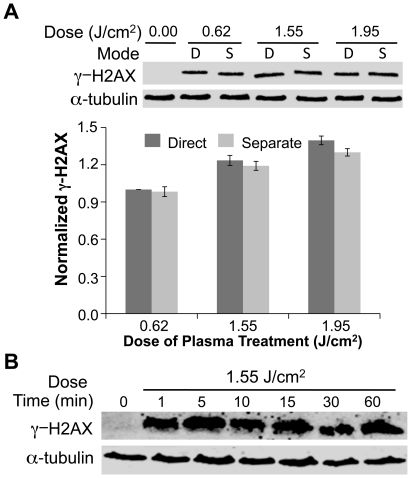
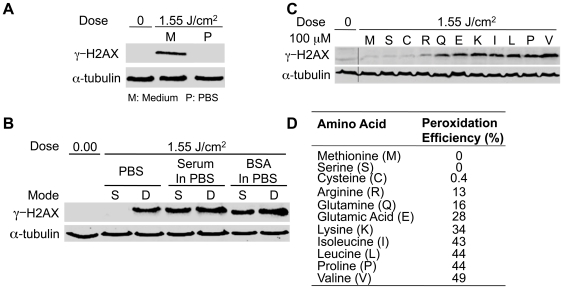
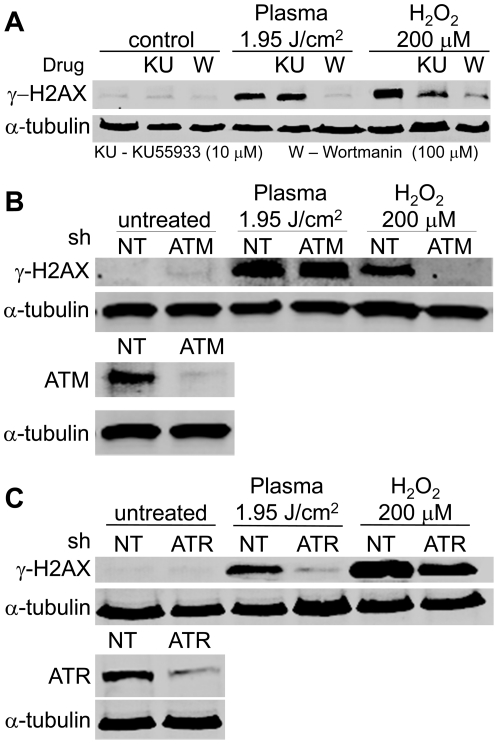
Thermal plasmas and lasers have been widely used in medicine to cut, ablate and cauterize tissues through heating; in contrast, non-thermal plasma produces no heat, so its effects can be selective. In order to exploit the potential for clinical applications, including wound healing, sterilization, blood coagulation, and cancer treatment, a mechanistic understanding of the interaction of non-thermal plasma with living tissues is required. Using mammalian cells in culture, it is shown here that non-thermal plasma created by dielectric barrier discharge (DBD) has dose-dependent effects that range from increasing cell proliferation to inducing apoptosis. It is also shown that these effects are primarily due to formation of intracellular reactive oxygen species (ROS). We have utilized γ-H2AX to detect DNA damage induced by non-thermal plasma and found that it is initiated by production of active neutral species that most likely induce formation of organic peroxides in cell medium. Phosphorylation of H2AX following non-thermal plasma treatment is ATR dependent and ATM independent, suggesting that plasma treatment may lead to replication arrest or formation of single-stranded DNA breaks; however, plasma does not lead to formation of bulky adducts/thymine dimers.


Conflict of interest statement

Competing Interests: The authors have declared that no competing interests exist.

Figures

Figure 1
Figure 1. Dose-dependent effects of non-thermal atmospheric pressure dielectric barrier discharge (DBD) plasma on MCF10A cells.
(A) Photograph of DBD plasma treatment of cells. (B) 104 MCF10A cells plated on glass cover slips were treated with the indicated dose of DBD plasma as described. Cells were counted 24 and 72 hours after treatment. Data are plotted relative to the # of cells in the untreated plate at 24 hours relative to the # at 72 hours, which was set at 1.0. (C) Cells were treated with the indicated dose of DBD plasma; and colony survival assays were performed as described. Data are expressed relative to the # of colonies in the untreated control. (D) Three days after treatment with the indicated dose of DBD plasma, cells were harvested and stained with Annexin V/propidium iodide (PI) and analyzed by Guava.
Figure 2
Figure 2. Induction of DNA damage by DBD plasma.
(A) MCF10A cells were treated with the indicated dose of plasma. After one-hour incubation, lysates were prepared and resolved by SDS-PAGE and representative immunoblots with antibody to γ-H2AX (top) or α-tubulin (bottom) are shown. (B) Indirect immunofluorescence was performed utilizing an antibody to γ-H2AX one hour after treatment of MCF10A cells with 1.55 J/cm2 DBD plasma.
Figure 3
Figure 3. Effects of DBD plasma are mediated by neutral species and not UV generated by plasma in gas phase.
(A) Cells were subjected to plasma as described earlier (direct, D) or a grounded mesh that filters charged particles was placed between the electrode and the medium (indirect, I). Representative immunoblots with γ-H2AX (upper panel) or α-tubulin (lower panel) are shown. The graphs below the immunoblots show quantification from three independent experiments using the Odyssey Infrared Imaging System (LI-COR Biosciences, Lincoln, NE, USA). The γ-H2AX signal was normalized to the amount of α-tubulin and data are expressed relative to lowest dose that was set at 1.0. (B) UV produced in DBD plasma does not induce the observed DNA damage. Cells overlaid with 100 µl of medium were treated with plasma at 1.55 J/cm2 and 4.65 J/cm2 with (+) and without (−) placing magnesium fluoride (MgF2) glass over the cells during treatment. MgF2 glass blocks all plasma species except UV from reaching the surface of the medium covering the cells during treatment. Representative immunoblot with γ-H2AX (upper panel) or α-tubulin (lower panel) is shown.
Figure 4
Figure 4. ROS mediate induction of DNA damage by DBD plasma.
(A) CM-H2DCFDA was preloaded into MCF10A cells for 30 min and then the cells were allowed to recover for another 30 min at 37°C. After recovery, MCF10A cells were treated with the indicated dose of DBD plasma. One hour after plasma treatment, intracellular ROS were detected using a fluorescence enabled inverted microscope. (B) MCF10A cells were incubated for 2 hours with 4 mM N-acetyl cysteine (NAC) (+), followed by treatment with the indicated dose of DBD plasma. γ-H2AX (top) or α-tubulin (bottom) was detected by immunoblot of cell lysates prepared one hour after plasma treatment.
Figure 5
Figure 5. The effects of plasma on cells are dependent on ROS concentration.
(A) Cells on cover slips overlaid with 100 µl cell culture media were treated with plasma (1.55 J/cm2), followed by dilution in 2 ml of media at the indicated holding time after treatment. Cell lysates were collected 1 hour after dilution in 2 ml of media. Immunoblots with γ-H2AX or α-tubulin are shown. (B) Medium was separately treated with plasma and then diluted immediately after treatment as indicated. Cells were then exposed to the treated and diluted medium for 1 min, followed by 1-hour incubation in 2 ml of fresh medium. Immunoblots with γ-H2AX or α-tubulin are shown.
Figure 6
Figure 6. Effects of DBD Plasma are mediated by neutral species generated in the medium.
(A) Cells were subjected to direct treatment with plasma (D) or to medium (100 µl) that was exposed to plasma and then transferred to the cells (separate, S). (A, B) Representative immunoblots with γ-H2AX (top) or α-tubulin (bottom) are shown. The graphs below the immunoblots show quantification using Odyssey. The γ-H2AX signal was normalized to the amount of α-tubulin. Data are expressed relative to lowest dose, which was set at 1.0. (B) Medium (100 µl separated treatment) was subjected to plasma and transferred to cells after holding for 1 to 60 min. After 1-minute incubation with cells, cover slips with treated medium and cells were transferred to a dish with 2 ml of medium.
Figure 7
Figure 7. Amino acid hydroperoxides produced by plasma treatment of organic medium induce DNA damage.
(A) Cells were treated with 100 µl of medium or PBS that was separately exposed to 1.55 J/cm2 plasma. (B) 100 µl of PBS, medium without serum, or PBS with 100 µg/ml BSA were treated with plasma (1.55 J/cm2) and immediately added to cells on a coverslip (separated, S). Cells overlaid with 100 µl of the indicated solution were treated with plasma (1.55 J/cm2) (direct, D). (C) Solutions containing the indicated amino acid (100 µM) were separately treated with plasma and then added to MCF10A cells. (A, B, C) After 1-minute incubation, cells on cover slips were diluted in 2 ml medium, followed by lysis and Western blot for γ-H2AX and α-tubulin. (D) Peroxidation efficiency of various amino acid components of cell culture medium when treated with IR . For each amino acid, the amount of DNA damage induced is proportional to the peroxidation efficiency.
Figure 8
Figure 8. ATR dependence of non-thermal plasma induced phosphorylation of H2AX.
(A) Immunoblot of γ-H2AX (top), and α-tubulin (bottom) from MCF10As exposed to non-thermal plasma at a dose of 1.95 J/cm2 or 200 µM H2O2 in the presence (+) or absence (−) of 100 µmol/L Wortmannin (Wort.) or 10 µmol/L KU55933 (KU). (B) MCF10As were depleted of endogenous ATM by shRNA for 72 hours (bottom, immunoblot of ATM after ATM or non-targeting (NT) shRNA). Cells were then plated on glass cover slips and exposed to DBD plasma at a dose of 1.95 J/cm2 or 200 µM H2O2. (C) MCF10As depleted of endogenous ATR by shRNA for 72 hours (bottom, immunoblot of ATR after ATR or non-targeting (NT) shRNA). (B,C) After knockdown, cells were plated on glass cover slips for 24 h followed by exposure to non-thermal plasma at a dose of 1.95 J/cm2 or 200 µM H2O2. After one-hour incubation, lysates were prepared and resolved by SDS-PAGE and representative immunoblots with antibody to γ-H2AX (top) or α-tubulin (bottom) are shown.
Figure 9
Figure 9. Plasma treatment does not induce the formation of thymine dimers.
MCF10A cells grown on glass coverslips were incubated with (A) or without (B) 4 mM NAC for 2 h, followed by treatment with direct plasma (2.3 J/cm2), UV (10 J/m2), H2O2 (200 µM), or a no treatment (NT) control. Cells were allowed to recover for 1 h, then fixed and immunostained with TDM-2 primary antibody (kindly provided by Dr. Toshio Mori at the Nara Medical University, Kashihara, Nara, Japan) and Alexa Fluor 594 anti-mouse secondary antibody to detect cyclobutane pyrimidine dimers.

References

    1. Vargo JJ. Clinical applications of the argon plasma coagulator. Gastrointest Endosc. 2004;59:81–88. - PubMed
    1. Sladek REJ, Stoffels E. Deactivation of Escherichia coli by the plasma needle. Journal of Physics D: Applied Physics. 2005;38:1716–1721.
    1. Goree J, Bin l, Drake D, Stoffels E. Killing of S. mutans Bacteria Using a Plasma Needle at Atmospheric Pressure. IEEE Transactions on Plasma Science. 2006;34:1317–1324.
    1. Stoffels E, Kieft AIE, Sladek AREJ, Zandvoort V, Slaaf DW. Cold gas plasma in biology and medicine. In: d'Agostino R, Favia P, Kawai Y, Ikegami H, Sato N, et al., editors. Advanced Plasma Technology. Weinheim: Wiley-VCH; 2008. pp. 301–318.
    1. Stoffels E. Gas plasmas in biology and medicine. Journal of Physics D: Applied Physics. 2006;39

Publication types

Substances