

Is my network module preserved and reproducible?
- PMID: 21283776
- PMCID: PMC3024255
- DOI: 10.1371/journal.pcbi.1001057
Is my network module preserved and reproducible?
Abstract
In many applications, one is interested in determining which of the properties of a network module change across conditions. For example, to validate the existence of a module, it is desirable to show that it is reproducible (or preserved) in an independent test network. Here we study several types of network preservation statistics that do not require a module assignment in the test network. We distinguish network preservation statistics by the type of the underlying network. Some preservation statistics are defined for a general network (defined by an adjacency matrix) while others are only defined for a correlation network (constructed on the basis of pairwise correlations between numeric variables). Our applications show that the correlation structure facilitates the definition of particularly powerful module preservation statistics. We illustrate that evaluating module preservation is in general different from evaluating cluster preservation. We find that it is advantageous to aggregate multiple preservation statistics into summary preservation statistics. We illustrate the use of these methods in six gene co-expression network applications including 1) preservation of cholesterol biosynthesis pathway in mouse tissues, 2) comparison of human and chimpanzee brain networks, 3) preservation of selected KEGG pathways between human and chimpanzee brain networks, 4) sex differences in human cortical networks, 5) sex differences in mouse liver networks. While we find no evidence for sex specific modules in human cortical networks, we find that several human cortical modules are less preserved in chimpanzees. In particular, apoptosis genes are differentially co-expressed between humans and chimpanzees. Our simulation studies and applications show that module preservation statistics are useful for studying differences between the modular structure of networks. Data, R software and accompanying tutorials can be downloaded from the following webpage: http://www.genetics.ucla.edu/labs/horvath/CoexpressionNetwork/ModulePreservation.
Conflict of interest statement
The authors have declared that no competing interests exist.
Figures
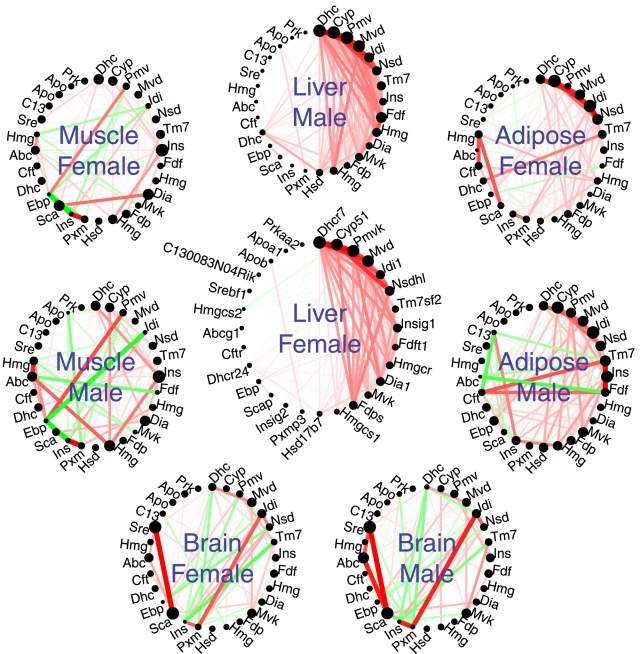
 . The CBP module in the female liver network is highly preserved in the male liver network (
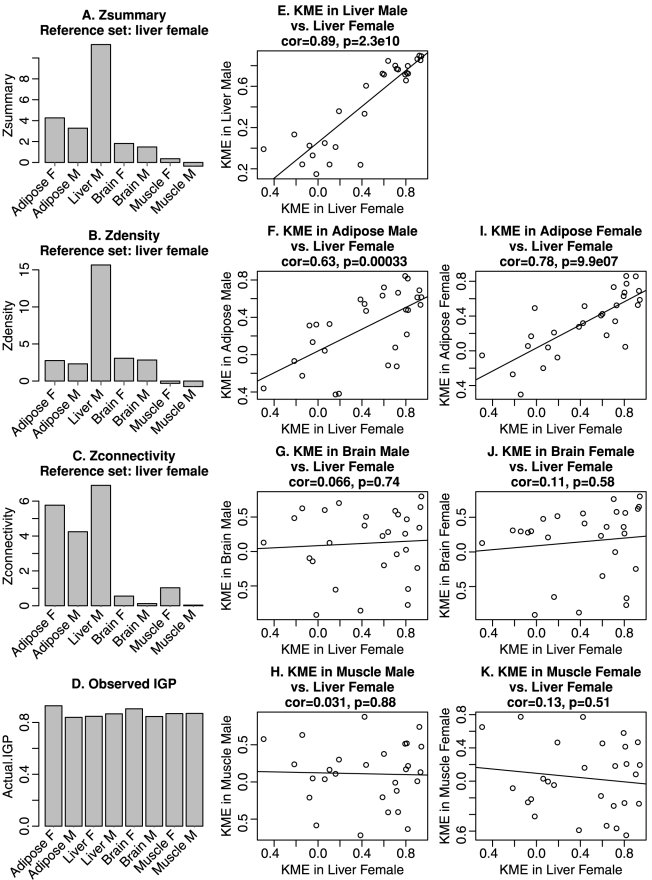
 ) and moderately preserved in adipose networks. There is no evidence of preservation in brain or muscle tissue networks. Panels B and C show the density and connectivity statistics, respectively. Panel D shows the results of the in group proportion analysis . According to the IGP analysis, the CBP module is equally preserved in all networks. E–K show the scatter plots of
  in one test data set (indicated in the title) vs. the liver female reference set. Each point corresponds to a gene; Pearson correlations and the corresponding p-values are displayed in the title of each scatter plot. The eigengene-based connectivity
  is strongly preserved between adipose and liver tissues; it is not preserved between female liver and the muscle and brain tissues.
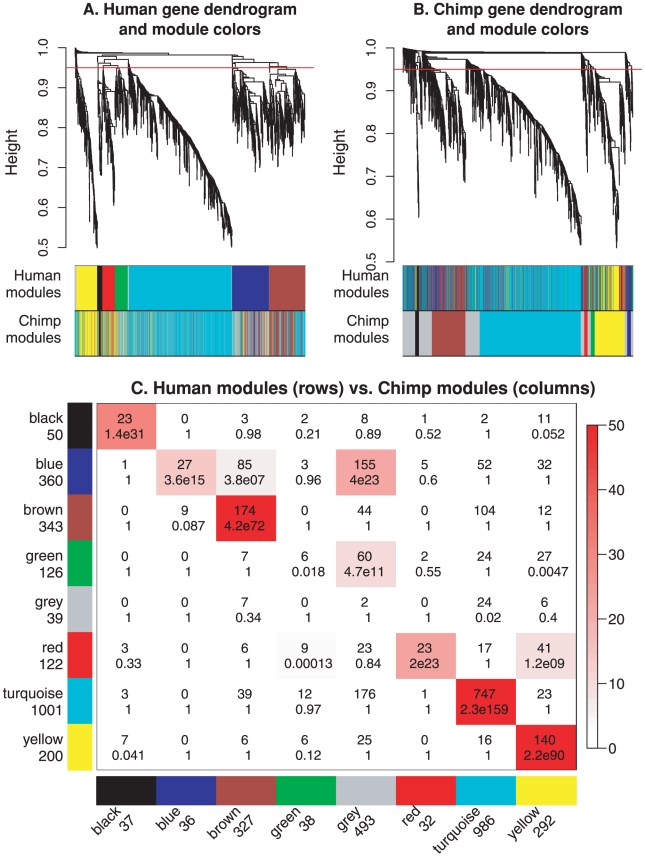
 , the Fisher exact test p value, according to the color legend on the right. Note that the human yellow network is highly preserved while the human blue network is only weakly preserved in the chimpanzee network.
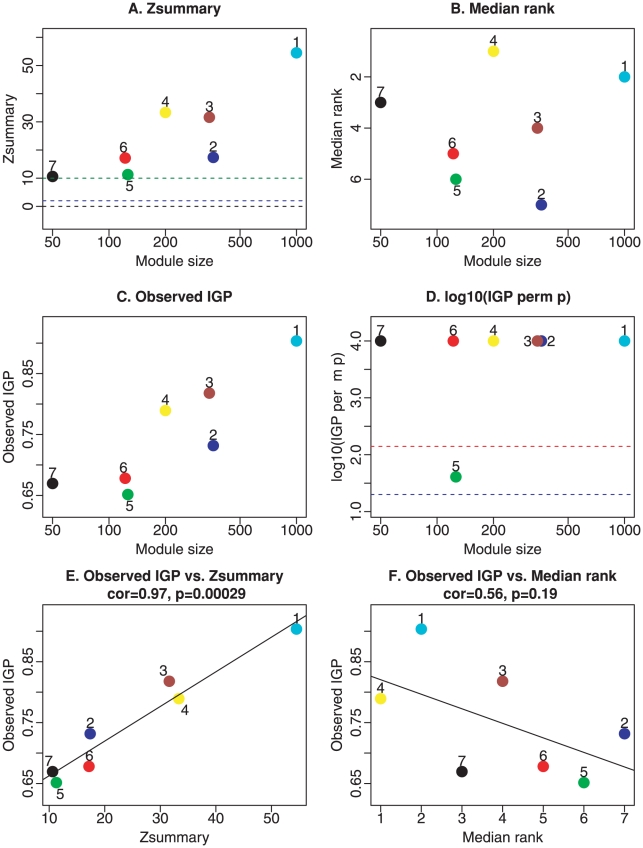
 (
( -axis), Equation 1, as a function of the module size. Each point represents a module, labeled by color and a secondary numeric label (1 = turquoise, 2 = blue, 3 = brown, 4 = yellow, 5 = green, 6 = red, 7 = black). The dashed blue and green lines indicate the thresholds
  and
and  , respectively. B. The composite statistic
  (y-axis), Equation 34, as a function of the module size. Each point represents a module, labeled by color and a secondary numeric label as in panel A. Low numbers on the
  axis indicate a high preservation. C. Observed IGP statistic (Kapp and Tibshirani, 2007) versus module size. D. P-value of the IGP statistic versus module size. E. and F. show scatter plots between the observed IGP statistic and
  and
and  , respectively. In this example, where modules are defined as clusters, the IGP statistic has a high positive correlation (
 ) with
  and a moderately large negative correlation (
 ) with
  . The negative correlation is expected since low median ranks indicate high preservation.
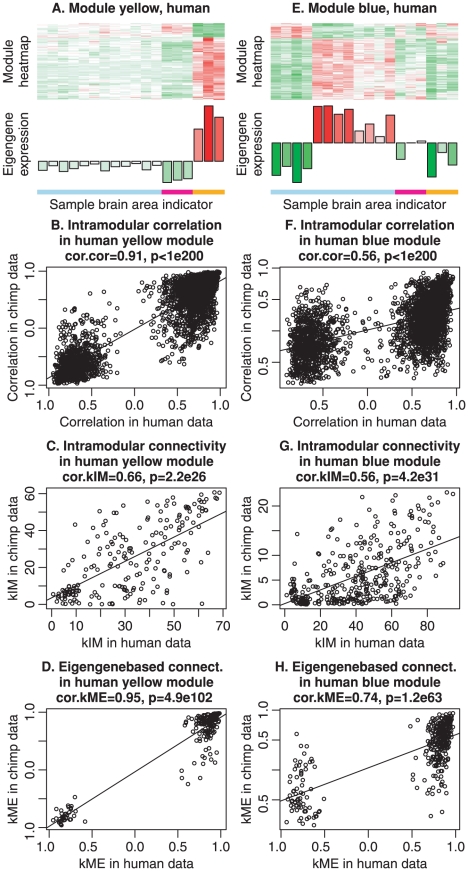
 -axis) vs. human samples (
 -axis) within the human yellow module. Each point corresponds to a gene-gene pair. The scatter plot exhibits a significant correlation (cor.cor and p-value displayed in the title), indicating that the correlation pattern among the genes is preserved between the human and chimpanzee data. C. Scatter plot of intramodular connectivities, Equation 7, of genes in the human yellow module in chimpanzee samples (
 -axis) vs. human samples (
 -axis). Each point corresponds to one gene. The scatter plot exhibits a significant correlation (cor.kIM and p-value displayed in the title), indicating that the hub gene status in the human yellow module is preserved in the chimpanzee samples. D. Scatter plot of eigengene-based connectivities, Equation 17, of genes in chimpanzee samples (
 -axis) vs. human samples (
 -axis). Each point corresponds to one gene. The scatter plot exhibits a significant correlation (cor.kME and p-value displayed in the title), indicating that fuzzy module membership in the human yellow module is preserved in the chimpanzee samples. Scatter plots E.–H. show that the human blue module is less preserved in the chimpanzee network. Note that the correlations in scatter plots F.–H. are lower than the corresponding correlations in the yellow module plots B.–D., indicating weaker preservation of the human blue module in the chimpanzee samples. Overall, these results agree with those from the cross-tabulation based analysis reported in Figure 3.
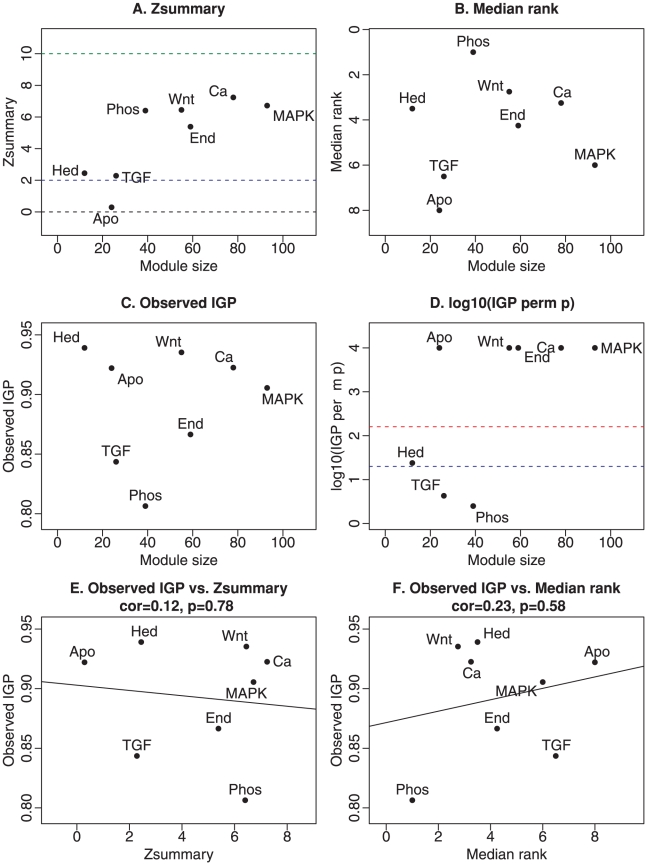
 (panel A) and
  (panel B), and the IGP statistic (panels C and D). Panels E. and F. show scatter plots between the observed IGP statistic and
  and
and  , respectively. Here we find no significant relationship between the IGP statistic and the composite module preservation statistic. Since KEGG modules do not correspond to clusters, it is not clear whether cluster preservation statistics are useful in this example.
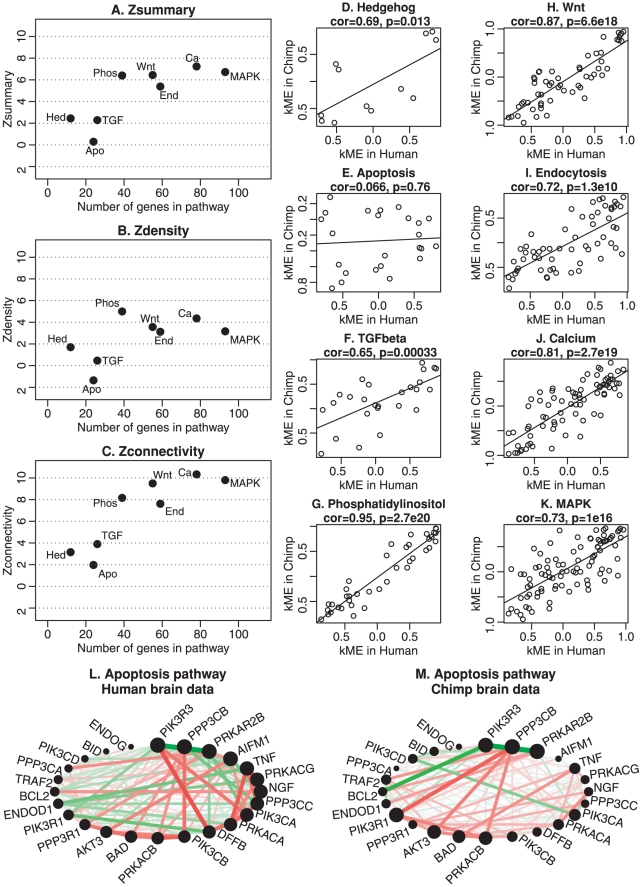
 statistics (y-axis) for selected KEGG pathways (interpreted as modules) versus the number of genes in the pathway (x-axis). Panel A shows
  (Equation 1), panel B shows the density summary statistic
  (Equation 30), and panel C shows the connectivity summary statistic
  (Equation 31). Pathway names are shortened for readability. Panel A shows that MAPK, Calcium, Endocytosis, Wnt, and Phosphatidylinositol show strong evidence of preservation (
 ) while the apoptosis module is not preserved. Panel C shows that this preservation signal mainly reflects connectivity preservation
  (Equation 31) while panel B reveals that most modules have weak to moderate density preservation (
 ) (Equation 30). Note that the apoptosis pathway shows no evidence of preservations. Panels D–H display scatter plots of eigengene-based connectivities in the chimpanzee data (
 -axis) vs. in the human data (
 -axis). Each point represents a gene in the pathway. Higher correlation means that the internal co-expression structure of the pathway is more strongly preserved. The apoptosis pathway has the lowest
  statistic, while the Phosphatidylinositol pathway has the highest. The circle plots in panels L and M show connection strengths among apoptosis genes in humans and chimpanzees, respectively.
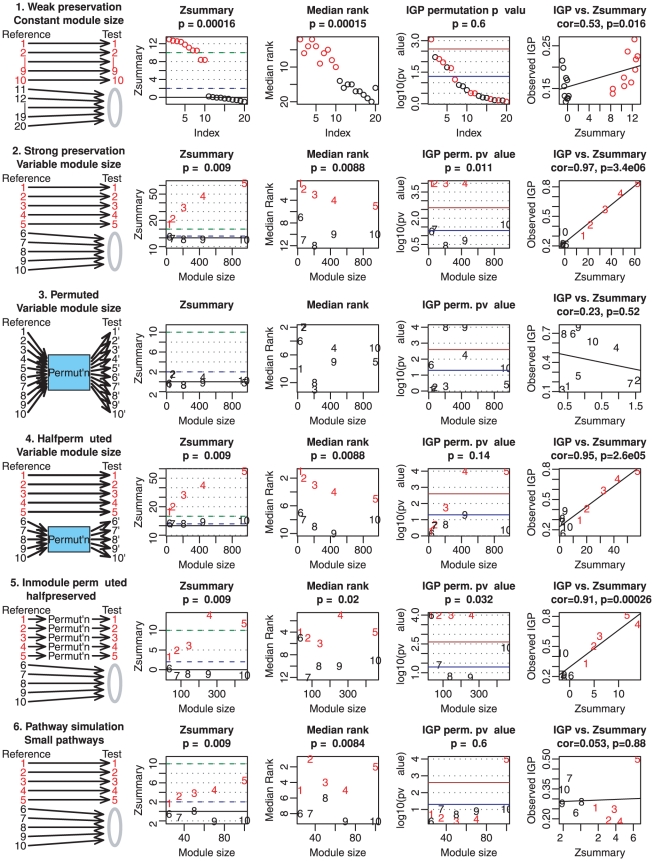
 and
and  , respectively, as a function of module size. The blue and green horizontal lines show the thresholds of
  and
and  , respectively. Each figure title reports the Kruskal-Wallis test p-value for testing whether the preservation statistics differ between preserved and non-preserved modules. Note that the proposed thresholds (
 for preserved and
  for non-preserved modules) work quite well. The fourth column shows the permutation p-values of IGP obtained by the R package clusterRepro. The blue and brown lines show p-value thresholds of 0.05 and its Bonferroni correction, respectively. The IGP permutation p-value is less successful than
  at distinguishing preserved from non-preserved modules. The fifth and last column shows scatter plots of observed IGP vs.
  . We observe that IGP and
  tend to be highly correlated when modules correspond to clusters with varying extents of preservation.
References
-
- Almaas E. Biological impacts and context of network theory. J Exp Biol. 2007;210:1548–1558. - PubMed
-
- Stuart JM, Segal E, Koller D, Kim SK. A Gene-Coexpression Network for Global Discovery of Conserved Genetic Modules. Science. 2003;302:249–255. - PubMed
-
- Zhang B, Horvath S. General framework for weighted gene coexpression analysis. Stat Appl Genet Mol Biol. 2005;4:17. - PubMed
Publication types
MeSH terms
Grants and funding
LinkOut - more resources
Full Text Sources
Other Literature Sources
