

Practical measures of integrated information for time-series data
- PMID: 21283779
- PMCID: PMC3024259
- DOI: 10.1371/journal.pcbi.1001052
Practical measures of integrated information for time-series data
Abstract
A recent measure of 'integrated information', Φ(DM), quantifies the extent to which a system generates more information than the sum of its parts as it transitions between states, possibly reflecting levels of consciousness generated by neural systems. However, Φ(DM) is defined only for discrete Markov systems, which are unusual in biology; as a result, Φ(DM) can rarely be measured in practice. Here, we describe two new measures, Φ(E) and Φ(AR), that overcome these limitations and are easy to apply to time-series data. We use simulations to demonstrate the in-practice applicability of our measures, and to explore their properties. Our results provide new opportunities for examining information integration in real and model systems and carry implications for relations between integrated information, consciousness, and other neurocognitive processes. However, our findings pose challenges for theories that ascribe physical meaning to the measured quantities.
Conflict of interest statement
The authors have declared that no competing interests exist.
Figures
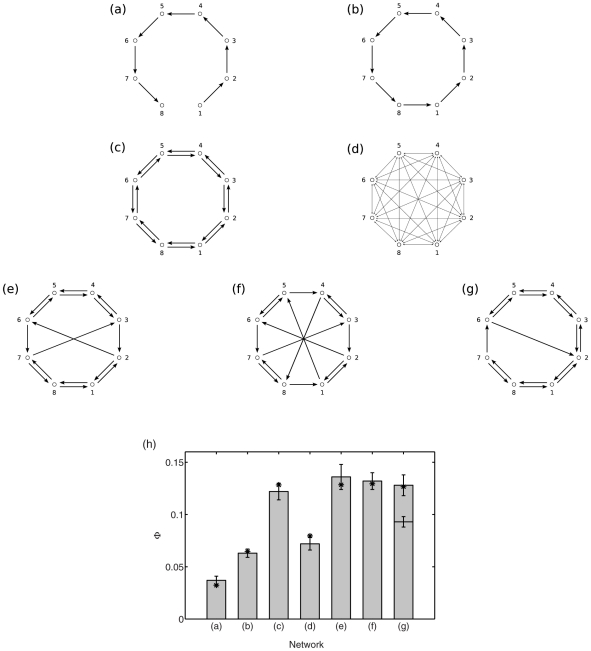
 . Arrow widths reflect connection strengths: for (a)–(c) and (e)–(g), all connection strengths are 0.25; for system (d) each connection strength is 1/14, thus the total afferent connection to each element is 0.5. (h) Integrated information, as measured by
  (
( ) for each of the systems (a)–(g), via simulated data (bars) and analytically via the generative model (asterisks). For simulated data, 10 trials were performed, with each trial generating 3000 data points. Bars show mean values; error bars show plus/minus one standard deviation. For system 1(g), sizes of sub-systems in the MIB varied across trials, falling into two distinct groups which are shown separately (the top bar reflects a group of 6 trials; the bottom bar, 4 trials).
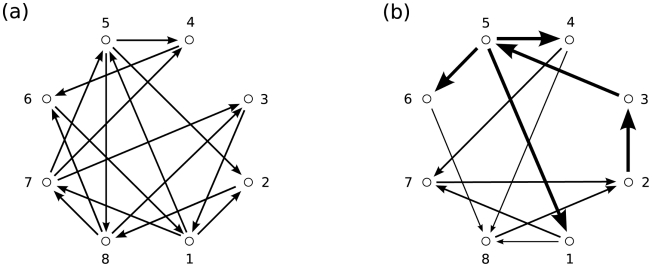
 . (b) Optimal network for total afferent of 0.5 to each node, and all connections to a given node equal. This has
  .
.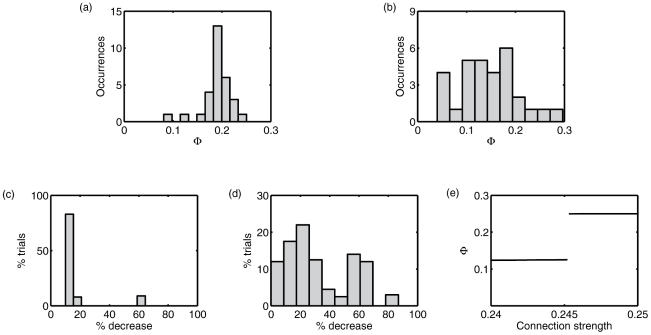
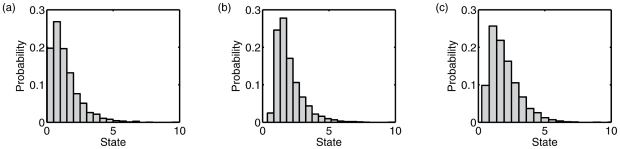
 for the 30 networks in the final population of a GA that yielded optimal network 2(a). (b) Histogram of
  for the 30 networks in the final population of a GA that yielded optimal network 2(b). (c) Histogram of percentage decrease in
  following single mutations of network 2(a) (200 evaluations). (d) Histogram of percentage decrease in
  following single mutations of network 2(b) (200 evaluations). (e) Discontinuity in
  as connection strength from element 6 to element 1 continuously changes (network 2(a); (all other connections fixed at 0.25)).
References
Publication types
MeSH terms
LinkOut - more resources
Full Text Sources
Research Materials
