. 2011;12(2):R12.
doi: 10.1186/gb-2011-12-2-r12. Epub 2011 Feb 1.

The role of codon selection in regulation of translation efficiency deduced from synthetic libraries

Affiliations

The role of codon selection in regulation of translation efficiency deduced from synthetic libraries

Sivan Navon et al. Genome Biol. 2011.

Abstract

Background: Translation efficiency is affected by a diversity of parameters, including secondary structure of the transcript and its codon usage. Here we examine the effects of codon usage on translation efficiency by re-analysis of previously constructed synthetic expression libraries in Escherichia coli.

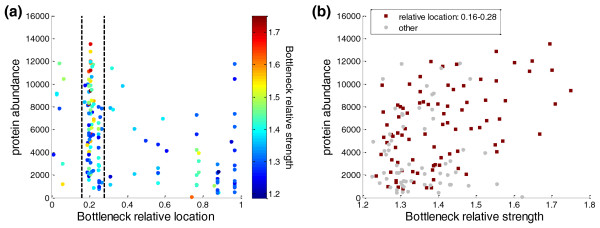
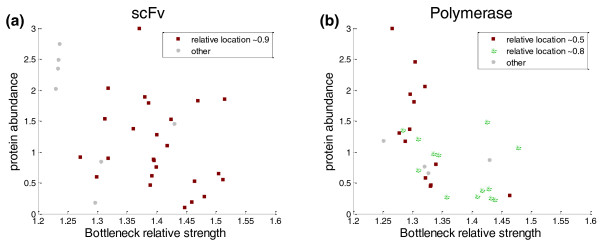
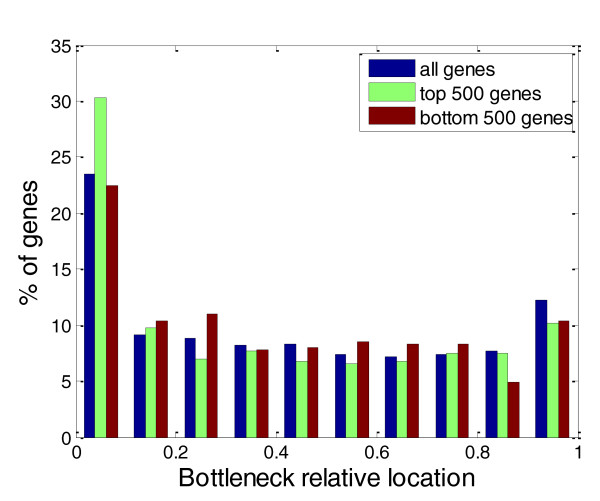
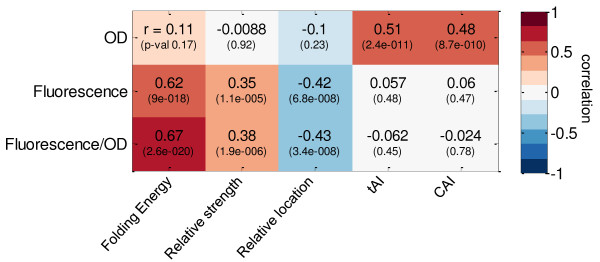
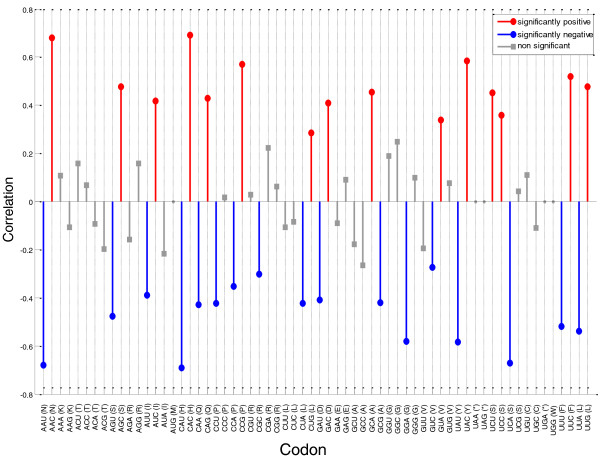
Results: We define the region in a gene that takes the longest time to translate as the bottleneck. We found that localization of the bottleneck at the beginning of a transcript promoted a high level of expression, especially if the computed dwell time of the ribosome within this region was sufficiently long. The location and translation time of the bottleneck were not correlated with the cost of expression, approximated by the fitness of the host cell, yet utilization of specific codons was. Particularly, enhanced usage of the codons UCA and CAU was correlated with increased cost of production, potentially due to sequestration of their corresponding rare tRNAs.

Conclusions: The distribution of codons along the genes appears to affect translation efficiency, consistent with analysis of natural genes. This study demonstrates how synthetic biology complements bioinformatics by providing a set-up for well controlled experiments in biology.


Figures

Figure 1
Figure 1
Protein abundance versus relative location and strength of the bottleneck in the GFP library. (a) All the genes in the GFP library. The x-axis is the relative location of the bottleneck in every gene; the y-axis is the per-cell protein abundance. The color of each dot is the relative strength of the bottleneck in every gene. Eighty-six of the genes are located between the two black lines that correspond to relatively early bottlenecks - that is, relative location between 0.16 and 0.28. (b) The correlation between the bottleneck relative strength and per-cell protein abundance for all the genes in the GFP library. The 86 genes that have a relative location between 0.16 and 0.28 are plotted as red squares, and the rest of the genes are plotted as grey circles.
Figure 2
Figure 2
Protein abundance versus relative strength of the bottleneck for data from the scFv and polymerase libraries. (a) All the scFv genes; (b) all the polymerase genes. In both panels the x-axis is the relative strength of the bottleneck, the y-axis the per-cell protein abundance. Genes with bottlenecks at different relative locations are marked by different colors (see legend) to show the correlation between relative strength and protein abundance for genes with the same bottleneck location.
Figure 3
Figure 3
Distribution of bottleneck relative locations for E. coli genes. The distribution is shown for three groups of E. coli genes: all genes (blue); highly expressed genes (green); and lowly expressed genes (red). For all groups only genes longer than 100 codons are shown (this cutoff retains 90% of the E. coli genes). This resulted in 442 highly expressed genes (out of the top 500) and 473 lowly expressed genes (out of the bottom 500).
Figure 4
Figure 4
Correlation between the GFP experimental measurement and transcript calculated parameters. On the x-axis are different parameters that can be calculated from the transcript: folding energy of the initiation site calculated in Kudla et al. [13], bottleneck parameters, CAI and tAI. On the y-axis are the optical density (OD) measurement, protein abundance and per-cell protein abundance. The correlation value is indicated by both the color of the box and the number. The correlation P-value is given in parentheses.
Figure 5
Figure 5
Correlation between codon usage in a transcript and fitness. The bar indicates the Pearson correlation value between codon frequency and OD. On the x-axis are listed all the codons in the format 'codon (amino acid)'. A correlation was determined to be significant if its P-value is below 0.05/61 (that is, alpha = 0.05 was corrected for the number of codons tested). Red bars represent codons for which there is a significantly positive correlation between their appearance and the OD. Blue bars represent codons that have a significant negative correlation. For codons with no significant correlation, grey squared bars are used. When no bar appears for a codon (for example AUG, UAA and so on) it means that the usage of that specific codon was constant for all genes, thus resulting in no correlation value. For usage of each amino acid in the GFP variant, see Table S3 in Additional file 1.

References

    1. Sharp PM, Li WH. The codon Adaptation Index - a measure of directional synonymous codon usage bias, and its potential applications. Nucleic Acids Res. 1987;15:1281–1295. doi: 10.1093/nar/15.3.1281. - DOI - PMC - PubMed
    1. dos Reis M, Savva R, Wernisch L. Solving the riddle of codon usage preferences: a test for translational selection. Nucleic Acids Res. 2004;32:5036–5044. doi: 10.1093/nar/gkh834. - DOI - PMC - PubMed
    1. Man O, Pilpel Y. Differential translation efficiency of orthologous genes is involved in phenotypic divergence of yeast species. Nat Genet. 2007;39:415–421. doi: 10.1038/ng1967. - DOI - PubMed
    1. Sharp PM, Li WH. An evolutionary perspective on synonymous codon usage in unicellular organisms. J Mol Evol. 1986;24:28–38. doi: 10.1007/BF02099948. - DOI - PubMed
    1. Tuller T, Carmi A, Vestsigian K, Navon S, Dorfan Y, Zaborske J, Pan T, Dahan O, Furman I, Pilpel Y. An evolutionarily conserved mechanism for controlling the efficiency of protein translation. Cell. 2010;141:344–354. doi: 10.1016/j.cell.2010.03.031. - DOI - PubMed

Publication types

Associated data