

Accurate inference of shoot biomass from high-throughput images of cereal plants
- PMID: 21284859
- PMCID: PMC3042986
- DOI: 10.1186/1746-4811-7-2
Accurate inference of shoot biomass from high-throughput images of cereal plants
Abstract
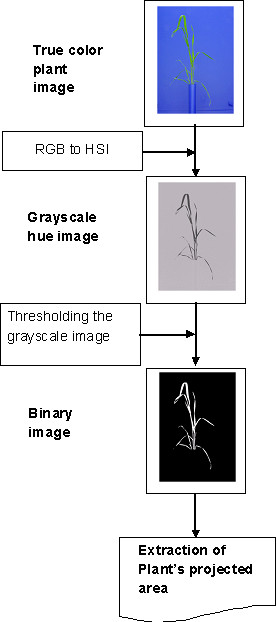
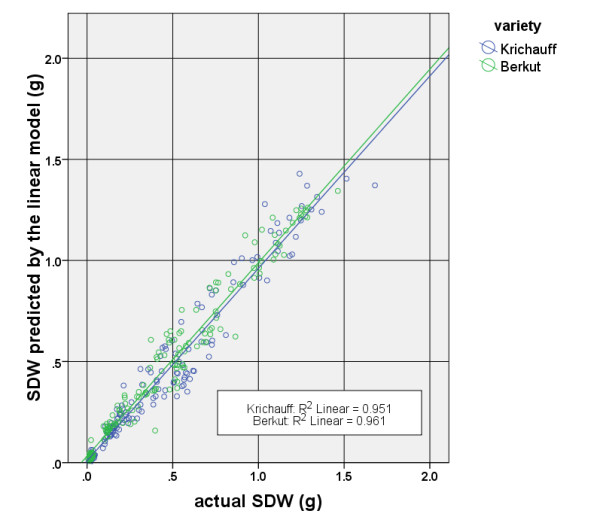
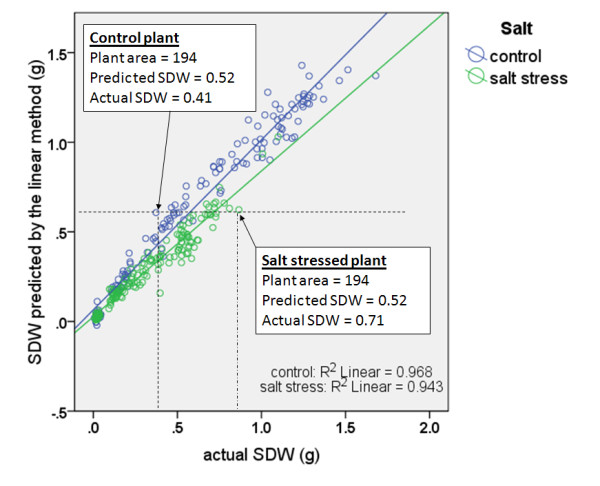
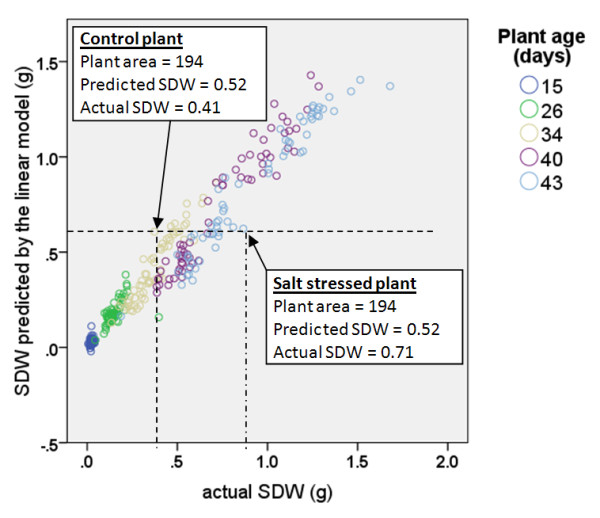
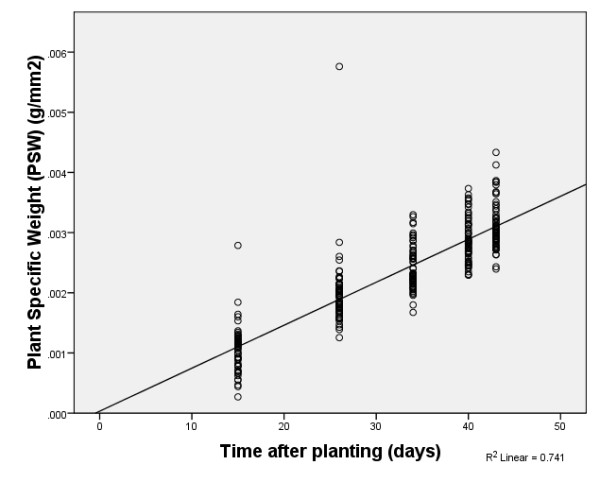
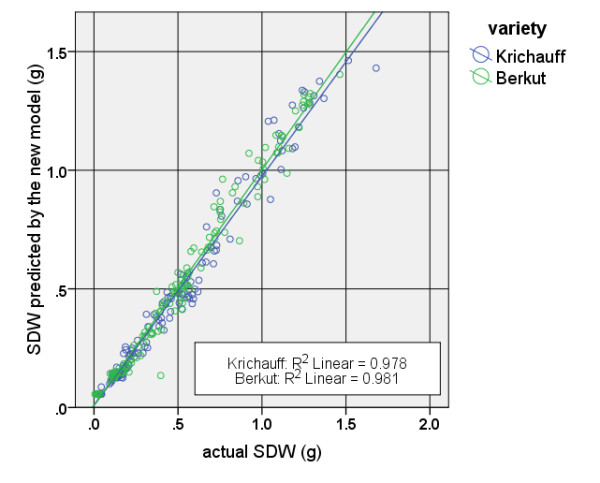
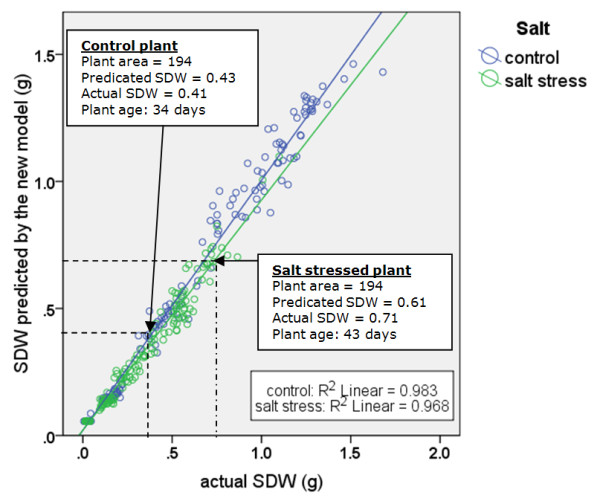
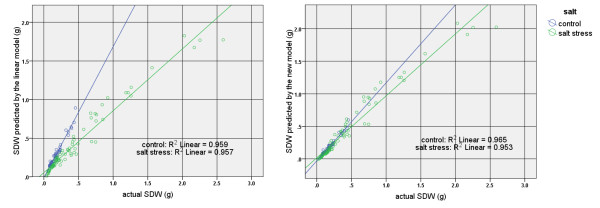
With the establishment of advanced technology facilities for high throughput plant phenotyping, the problem of estimating plant biomass of individual plants from their two dimensional images is becoming increasingly important. The approach predominantly cited in literature is to estimate the biomass of a plant as a linear function of the projected shoot area of plants in the images. However, the estimation error from this model, which is solely a function of projected shoot area, is large, prohibiting accurate estimation of the biomass of plants, particularly for the salt-stressed plants. In this paper, we propose a method based on plant specific weight for improving the accuracy of the linear model and reducing the estimation bias (the difference between actual shoot dry weight and the value of the shoot dry weight estimated with a predictive model). For the proposed method in this study, we modeled the plant shoot dry weight as a function of plant area and plant age. The data used for developing our model and comparing the results with the linear model were collected from a completely randomized block design experiment. A total of 320 plants from two bread wheat varieties were grown in a supported hydroponics system in a greenhouse. The plants were exposed to two levels of hydroponic salt treatments (NaCl at 0 and 100 mM) for 6 weeks. Five harvests were carried out. Each time 64 randomly selected plants were imaged and then harvested to measure the shoot fresh weight and shoot dry weight. The results of statistical analysis showed that with our proposed method, most of the observed variance can be explained, and moreover only a small difference between actual and estimated shoot dry weight was obtained. The low estimation bias indicates that our proposed method can be used to estimate biomass of individual plants regardless of what variety the plant is and what salt treatment has been applied. We validated this model on an independent set of barley data. The technique presented in this paper may extend to other plants and types of stresses.
Figures
References
-
- Poorter H, Nagel O. The role of biomass allocation in the growth response of plants to different levels of light, CO2, nutrients and water: a quantitative review. Functional Plant Biology. 2000;27:595–607. doi: 10.1071/PP99173. - DOI
-
- Wilson PJ, Thompson K, Hodgson JG. Specific Leaf Area and Leaf Dry Matter Content as Alternative Predictors of Plant Strategies. New Phytologist. 1999;143:155–162. doi: 10.1046/j.1469-8137.1999.00427.x. - DOI
-
- Wheeler WRCCJ. Estimating plant biomass: A review of techniques. Austral Ecology. 1992;17:121–131. doi: 10.1111/j.1442-9993.1992.tb00790.x. - DOI
LinkOut - more resources
Full Text Sources
