. 2011 Feb 1:11:9.
doi: 10.1186/1472-6807-11-9.

Deciphering the shape and deformation of secondary structures through local conformation analysis

Affiliations

Deciphering the shape and deformation of secondary structures through local conformation analysis

Julie Baussand et al. BMC Struct Biol. .

Abstract

Background: Protein deformation has been extensively analysed through global methods based on RMSD, torsion angles and Principal Components Analysis calculations. Here we use a local approach, able to distinguish among the different backbone conformations within loops, α-helices and β-strands, to address the question of secondary structures' shape variation within proteins and deformation at interface upon complexation.

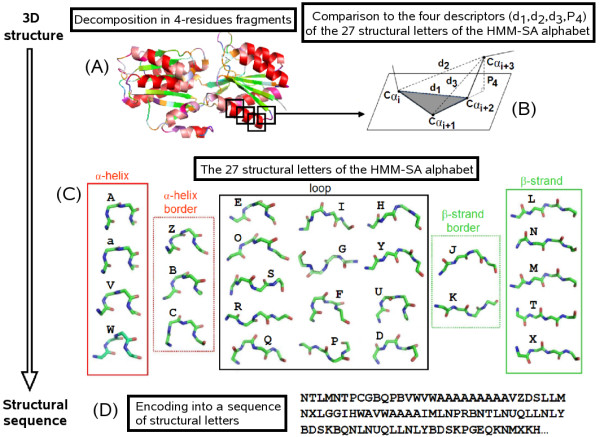
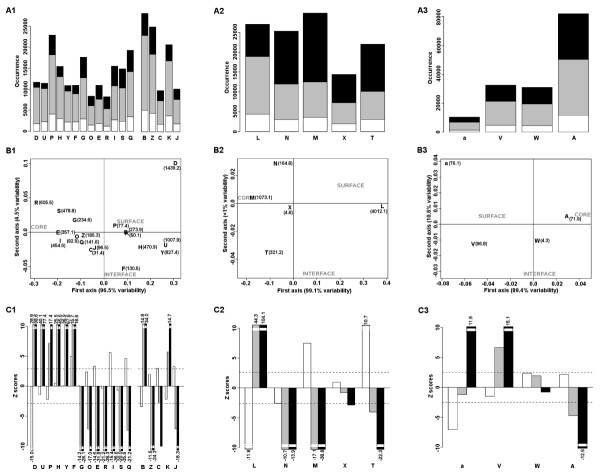
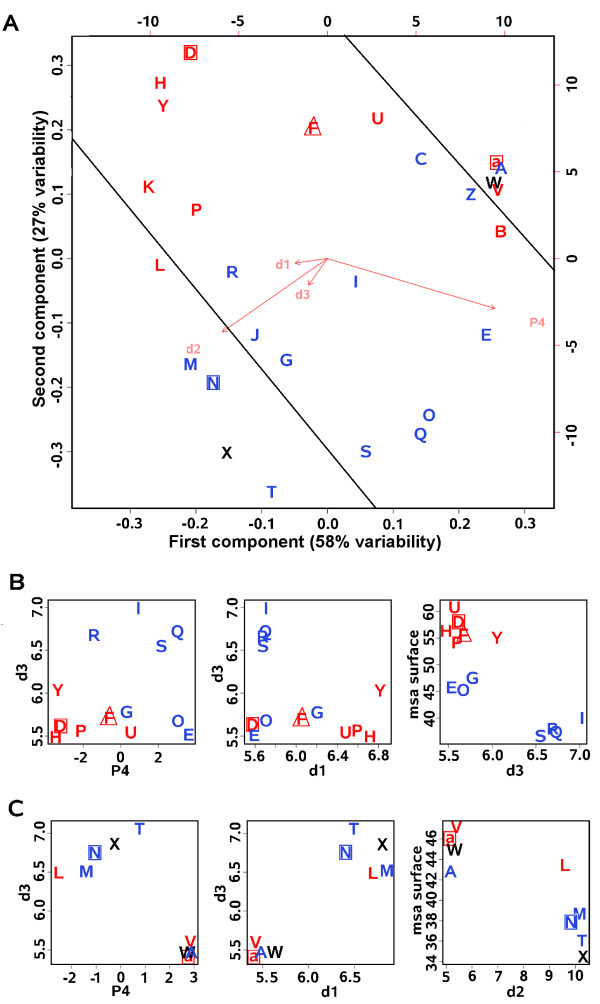
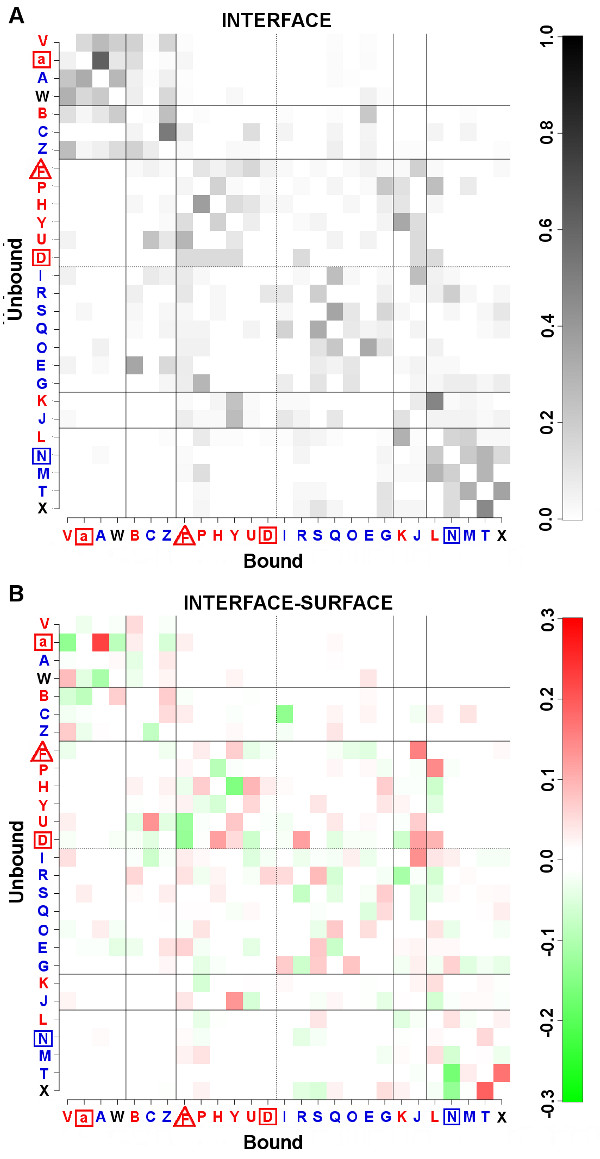
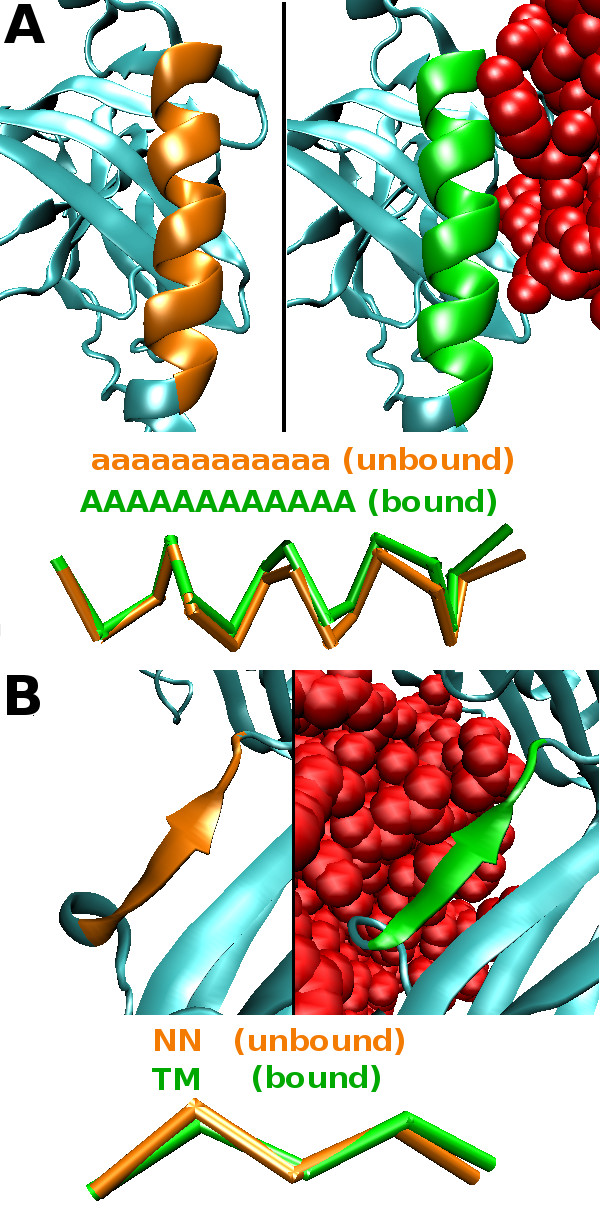
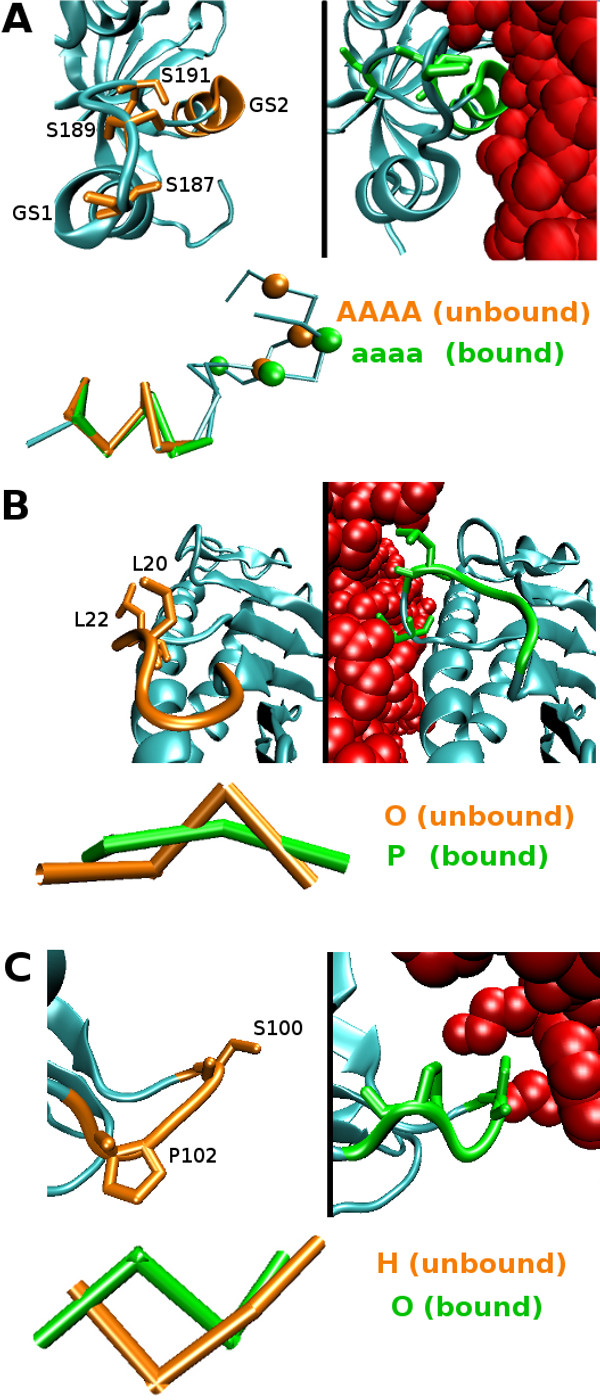
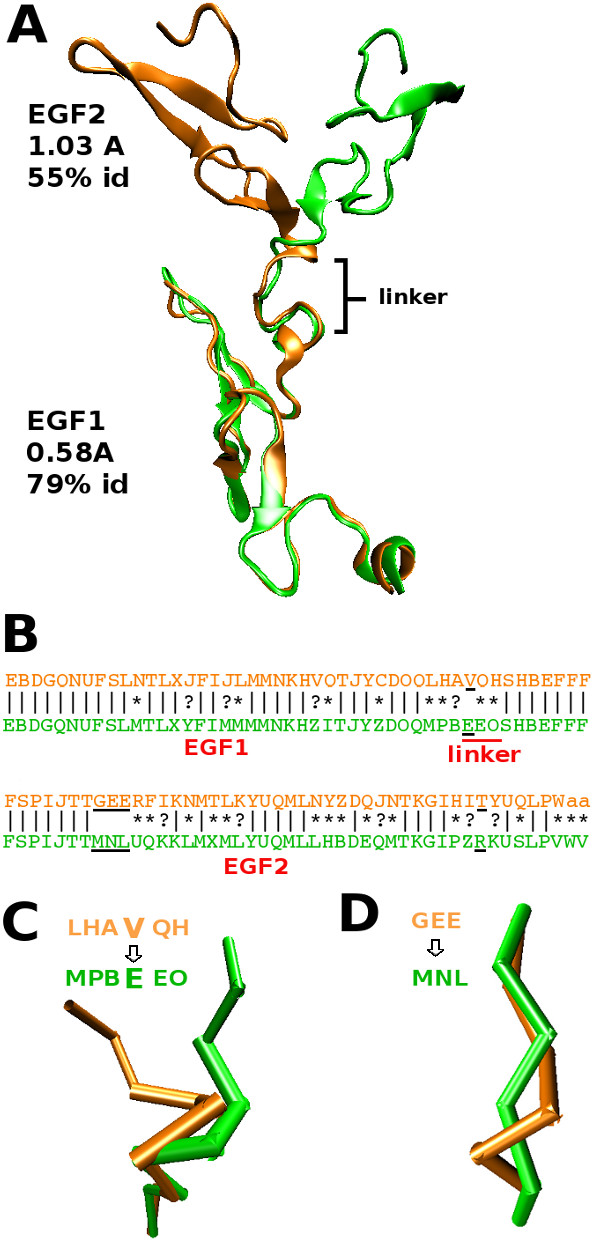
Results: Using a structural alphabet, we translated the 3 D structures of large sets of protein-protein complexes into sequences of structural letters. The shape of the secondary structures can be assessed by the structural letters that modeled them in the structural sequences. The distribution analysis of the structural letters in the three protein compartments (surface, core and interface) reveals that secondary structures tend to adopt preferential conformations that differ among the compartments. The local description of secondary structures highlights that curved conformations are preferred on the surface while straight ones are preferred in the core. Interfaces display a mixture of local conformations either preferred in core or surface. The analysis of the structural letters transition occurring between protein-bound and unbound conformations shows that the deformation of secondary structure is tightly linked to the compartment preference of the local conformations.

Conclusion: The conformation of secondary structures can be further analysed and detailed thanks to a structural alphabet which allows a better description of protein surface, core and interface in terms of secondary structures' shape and deformation. Induced-fit modification tendencies described here should be valuable information to identify and characterize regions under strong structural constraints for functional reasons.


Figures

Figure 1
Figure 1
From the 3 D structure to the 1 D structural sequence. A protein structure is decomposed into overlapping four-residue fragments (A). Each fragment is described by a vector of four descriptors d1, d2, d3 and P4 (B) allowing their comparison to the 27 structural letters of the HMM-SA alphabet presented in (C) where α-letters (red frame), β-letters (green frame), borders-letters associated with helix-borders (red dotted frame) and to strand-borders (green dotted frame) and loop-letters (black frame) are indicated. The encoding of a 3 D structure into the structural sequence (D) takes into account both the similarity of the protein fragments with the 27 structural letters and the preferred succession of the structural letters.
Figure 2
Figure 2
Statistical analysis of structural letters distribution in the complete dataset. Analysis of border- and loop-letters (column 1), β-letters (column 2) and α-letters (column 3) is given. A) Occurrence of structural letters in the three protein compartments: interface (white), surface (grey) and core (black). B) Multiple Correspondence Analysis performed on the occurrence of the structural letters in the three protein compartments. KLd quantities are indicated in parenthesis, statistical significance is reached for a value > 5.99. The first axis is associated with variabilities from 89.4% up to 99% separating surface and core, the second axis are associated with variabilities from 1% up to 10.6% separating interface and non-interface regions. C) Z-score values assessing the preference of structural letters for the interface compared to the surface (Zinter face/sur face: white), for the interface compared to the core (Zinter face/core: grey) and for the surface compared to the core (Zsur face/core: black). Statistical significance thresholds after Bonferoni correction are indicated by dashed lines. It corresponds to |2.5| for α-letters, |2.6| for β-letters and |2.9| for loop-letters. Z-score values> 2.5 correspond to p-values < 6.10-3, Z-score values > 6 correspond to p-values< 10-11.
Figure 3
Figure 3
Structural characteristics of the structural letters. Structural descriptors analysis of surface-letters (red), core-letters (blue), non-interface-letters (square), interface-letter (triangle) and non characterized ones (black). A) Principal Component Analysis performed on the structural descriptors d1, d2, d3 and P4 of the 27 structural letters. The first component is associated with 58% of variability, the second one to 29% of variability and the third and fourth axis to 7% and 6% respectively. Plain lines separate letters according to their secondary structural types. B) Correlation plot d3/P4, d3/d1 and msa/d3 for loop-letters. Msa (Mean solvent accessibility) are computed for the surface compartment but similar observations are made for the interface compartment. C) Correlation plots d3/P4, d3/d1 and msa/d2 for α- and β-letters. Msa stands for the mean relative solvent accessibilities, it is calculated for each letter in the surface compartment of the complete dataset.
Figure 4
Figure 4
Deformation matrices. A) Matrix of deformation proportion P (sl1, sl2) at interface (see method) where sl1 is the letter in the unbound state (y-axis) and sl2 the corresponding letter in the bound state (x-axis). B) Matrix of deformation differences between the interface and the surface ΔP(sl1, sl2) (see method) where sl1 is the letter in the unbound state (y-axis) and sl2 the corresponding letter in the bound state (x-axis). For the two matrices, the black lines separate structural letters according to their secondary structure type. The structural letters are differentiated according to their compartment preferences (blue for core, red for surface, triangle for interface and square for non-interface). Dotted lines separated surface loop-letters from core ones.
Figure 5
Figure 5
Deformation of regular secondary structures fitting the deformation tendencies. A) Example of a curved α-helix encoded by a run of [a] in the structural sequence (unbound, orange) towards a straight α-helix encoded by a run of [A] upon interaction (bound, green). B) Example of a curved β-strand encoded by a run of [N] in the structural sequence (unbound, orange) towards a straight β-strand encoded by "TM" upon interaction (bound, green).
Figure 6
Figure 6
Deformation of secondary structures not fitting the deformation tendencies. A) The inhibitory conformation of the TGFβ receptor in interaction with FKBP12. The structural deformation associated with the three serines (orange balls in the unbound state, green balls in the bound state) of the phosphorylation site and to the αGS2 from a straight α-helix encoded by a run of [A] in the structural sequence (orange) to a curved α-helix encoded by a run of [a] upon interaction (green) are represented. B) Deformation of the α1 domain loop of HFE upon complexation with TfR from an unbound curved (orange) to a bound extended (green) conformation enabling a higher exposure of L20 and L22 (licorice representation) to the protein exterior and the interaction of L22 with TfR (red). C) Deformation of a surface loop on the transthyretin surface upon interaction with a retinol-binding protein (red) from an unbound straight conformation (orange) to a bound curved one (green), where S100 (licorice representation) is pushed towards the protein interior upon complexation.
Figure 7
Figure 7
Deformation between regular and non-regular secondary structures. A) The structural superimposition of the EGF1 and EGF2 domains of the light chain of the coagulation factor VIIa in unbound (orange) and bound (green) states. B) The alignment of the structural sequences associated with the bound and unbound states of the protein is presented, | stands for identities, * for transitions between structural letters of the same secondary structure type, ? for transitions involving border-letters. The three deformed regions that do not fit the deformation tendencies are underlined in black. B and D) Zoom on the linker region (B) and region close to linker region (D) that undergo deformations that violate the deformation tendencies, the corresponding structural sequences are shown.

Similar articles

Cited by

References

    1. Ofran Y, Rost B. Analysing six types of protein-protein interfaces. J Mol Biol. 2003;325:377–387. doi: 10.1016/S0022-2836(02)01223-8. - DOI - PubMed
    1. Lo Conte L, Chothia C, Janin J. The atomic structure of protein-protein recognition sites. J Mol Biol. 1999;285:2177–2198. doi: 10.1006/jmbi.1998.2439. - DOI - PubMed
    1. Glaser F, Steinberg D, Vakser I, Ben-Tal N. Residue frequencies and pairing preference at protein-protein interfaces. Proteins. 2001;43:89–102. doi: 10.1002/1097-0134(20010501)43:2<89::AID-PROT1021>3.0.CO;2-H. - DOI - PubMed
    1. Res I, Lichtarge O. Character and evolution of protein-protein interfaces. Phys Biol. 2005;2:S36–S43. doi: 10.1088/1478-3975/2/2/S04. - DOI - PubMed
    1. Guharoy M, Chakrabarti P. Conserved residue clusters at protein-protein interfaces and their use in binding site identification. BMC Bioinformatics. 2010;11:286. doi: 10.1186/1471-2105-11-286. - DOI - PMC - PubMed

LinkOut - more resources