

Lipidomic analyses of Mycobacterium tuberculosis based on accurate mass measurements and the novel "Mtb LipidDB"
- PMID: 21285232
- PMCID: PMC3073466
- DOI: 10.1194/jlr.M010363
Lipidomic analyses of Mycobacterium tuberculosis based on accurate mass measurements and the novel "Mtb LipidDB"
Abstract
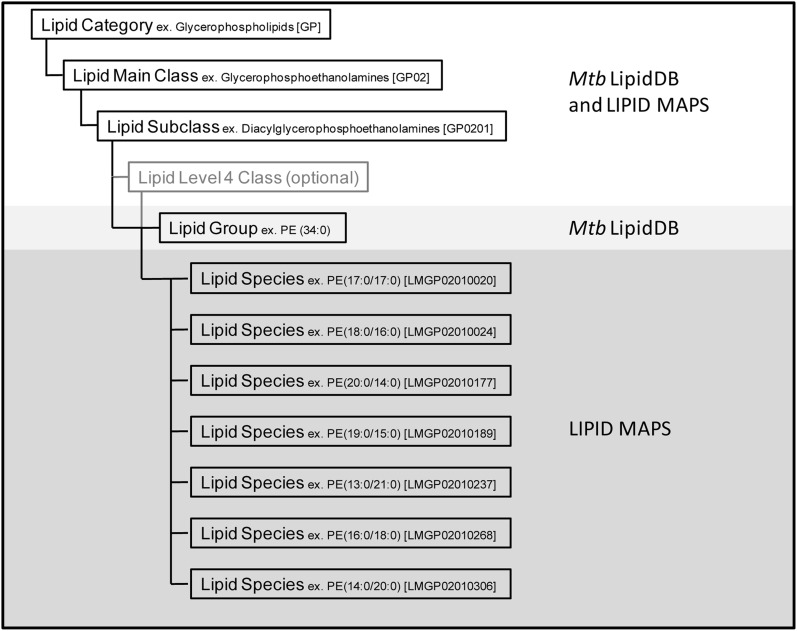
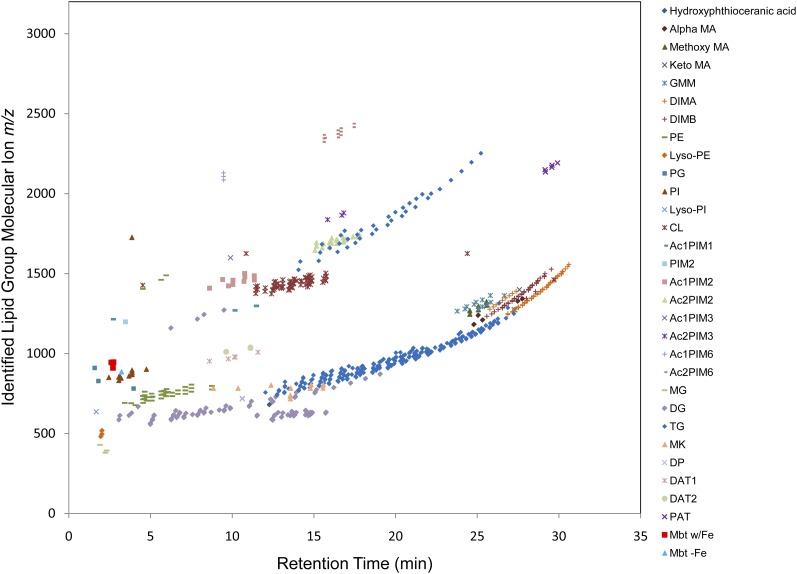
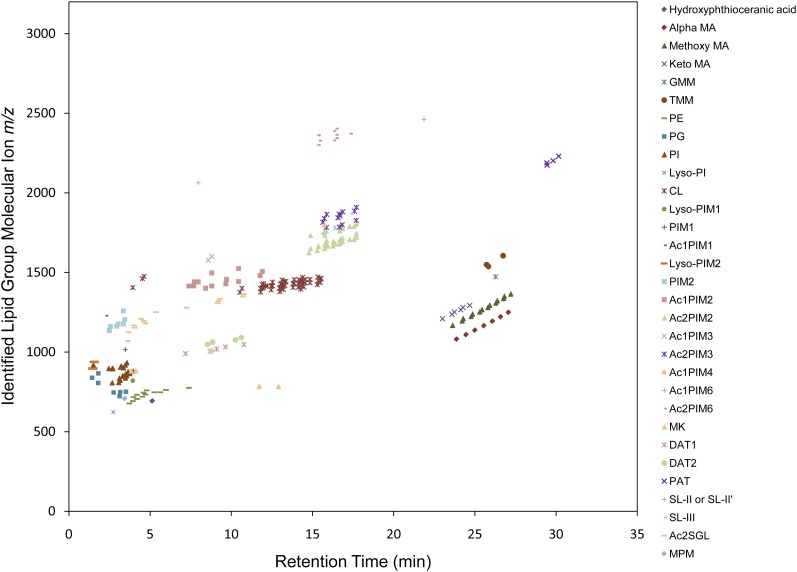
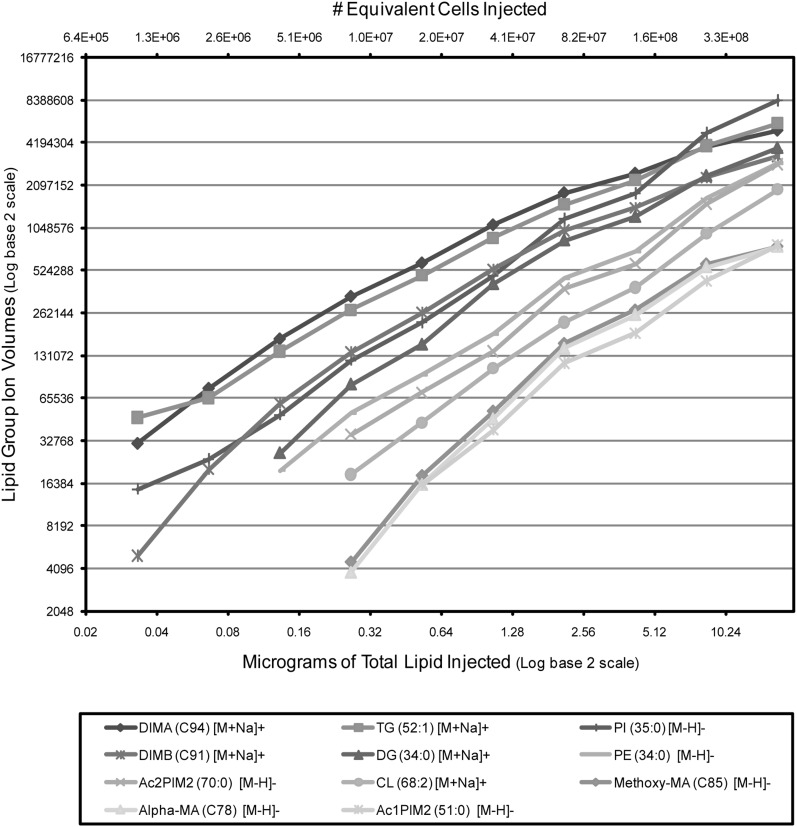
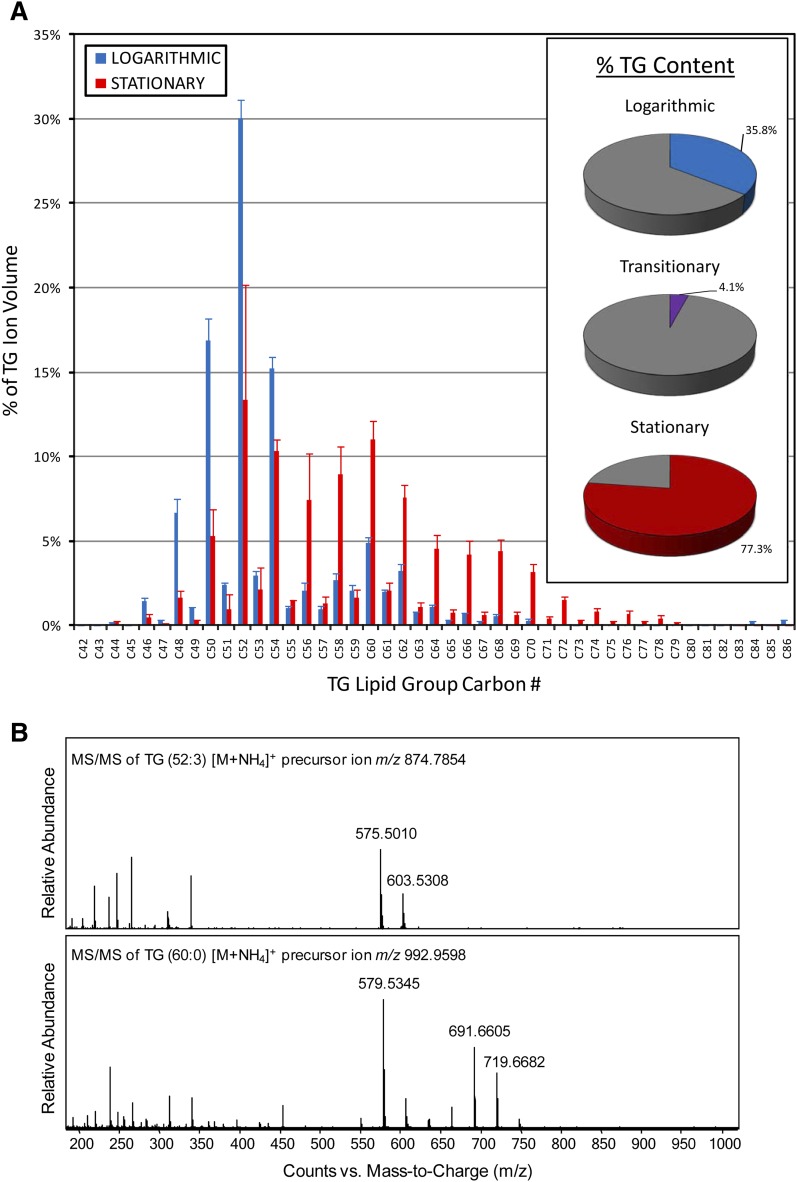
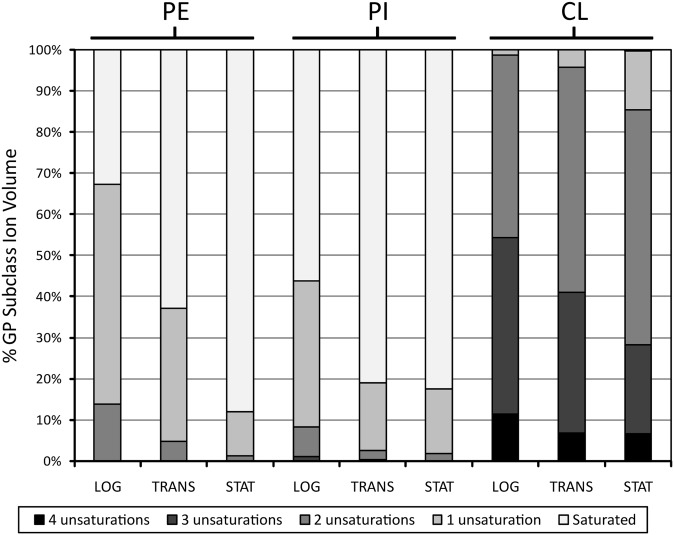
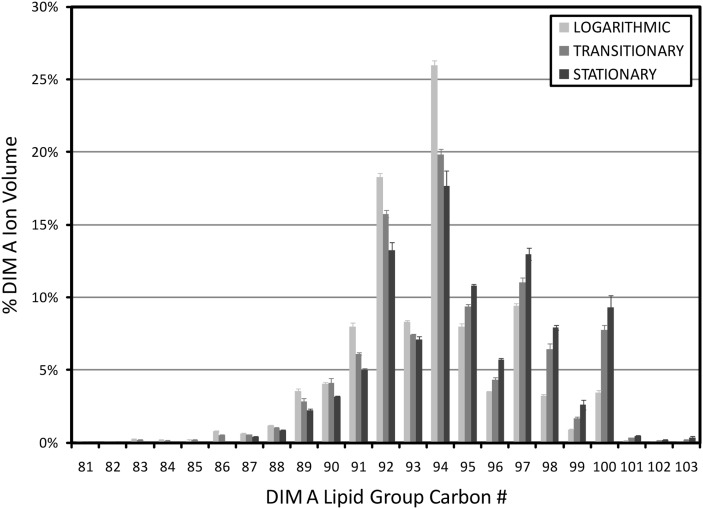
The cellular envelope of Mycobacterium tuberculosis is highly distinctive and harbors a wealth of unique lipids possessing diverse structural and biological properties. However, the ability to conduct global analyses on the full complement of M. tuberculosis lipids has been missing from the repertoire of tools applied to the study of this important pathogen. We have established methods to detect and identify lipids from all major M. tuberculosis lipid classes through LC/MS lipid profiling. This methodology is based on efficient chromatographic separation and automated ion identification through accurate mass determination and searching of a newly created database (Mtb LipidDB) that contains 2,512 lipid entities. We demonstrate the sensitive detection of molecules representing all known classes of M. tuberculosis lipids from a single crude extract. We also demonstrate the ability of this methodology to identify changes in lipid content in response to cellular growth phases. This work provides a customizable framework and resource to facilitate future studies on mycobacterial lipid biosynthesis and metabolism.
Figures
References
-
- Brennan P. J., Nikaido H. 1995. The envelope of mycobacteria. Annu. Rev. Biochem. 64: 29–63. - PubMed
-
- Daffe M., Draper P. 1998. The envelope layers of mycobacteria with reference to their pathogenicity. Adv. Microb. Physiol. 39: 131–203. - PubMed
-
- Crick D. C., Brennan P. J., McNeil M. R. 2004. The cell wall of Mycobacterium Tuberculosis. Tuberculosis. 2nd edition Rom W. N., Garay S. M., Lippincott Williams & Wilkins, Philadelphia: 115–134.
-
- Cox J. S., Chen B., McNeil M., Jacobs W. R., Jr 1999. Complex lipid determines tissue-specific replication of Mycobacterium tuberculosis in mice. Nature. 402: 79–83. - PubMed
-
- Reed M. B., Domenech P., Manca C., Su H., Barczak A. K., Kreiswirth B. N., Kaplan G., Barry C. E., III 2004. A glycolipid of hypervirulent tuberculosis strains that inhibits the innate immune response. Nature. 431: 84–87. - PubMed
Publication types
MeSH terms
Substances
LinkOut - more resources
Full Text Sources
