

doi: 10.1101/pdb.prot5573.
Microproteomics: quantitative proteomic profiling of small numbers of laser-captured cells
Affiliations
- PMID: 21285273
- PMCID: PMC4404020
- DOI: 10.1101/pdb.prot5573
Item in Clipboard
Microproteomics: quantitative proteomic profiling of small numbers of laser-captured cells
Cold Spring Harb Protoc.
.
No abstract available
Figures

Flowchart for microproteomic screening protocol.
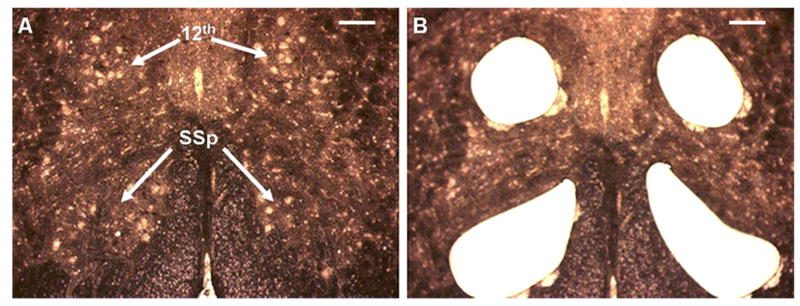
Dehydrated cryosections of adult male zebra finch brainstems mounted on a PEN membrane slide (20x; scale bar, 200 μm). Large motor neurons appear as white cell bodies against a brown neuropil background of axons and dendrites. The 12th and SSp motor nuclei are indicated. (A) Before LCM. (B) After LCM.
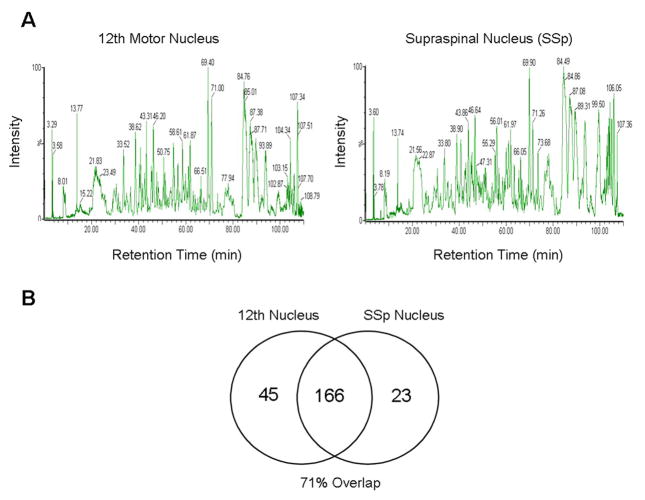
Qualitative proteomic screening results of the 12th and SSp motor nuclei. (A) Representative reversed-phase HPLC chromatograms of tryptic digests of proteins extracted from the 12th and SSp motor nuclei of one animal. The y-axis indicates the intensity of the peptide signal. The retention time (x-axis) represents the time it takes for a particular peptide to elute from the column and be injected onto the mass spectrometer. (B) Venn diagram showing the differences between the proteomic profiles of the 12th and SSp motor nuclei across six animals.
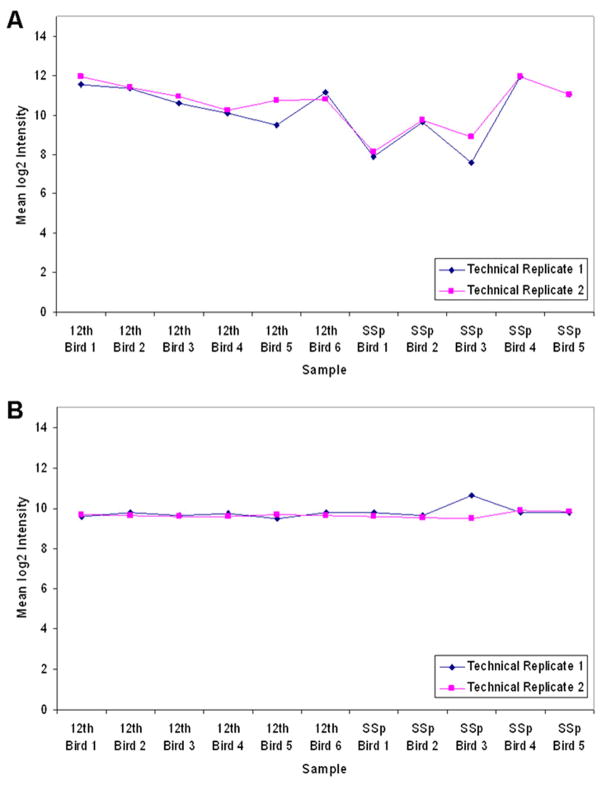
Quantitative technical replicate profiles across all samples from one experiment. (A) Raw intensity of technical replicates 1 and 2 from the average LC-MS signal of all peptides in the paired samples of the motor nuclei of each animal. (The SSp sample from Bird 6 was eliminated because protein extraction difficulties resulted in limited protein identifications.) Data points are expressed as mean log2 intensity. (B) Intensity of each data point normalized to the cross-sample median distribution.

Peptide (LQEYTQTILR) expression profiles of calretinin in the 12th and SSp motor nuclei of male zebra finches. Each value for each nucleus represents the average normalized intensity, identified independently in two separate experiments. Errors bars are the standard error of the mean. (*) Unpaired t-test without (unadj) and with (adj) adjusted FDR P-values.
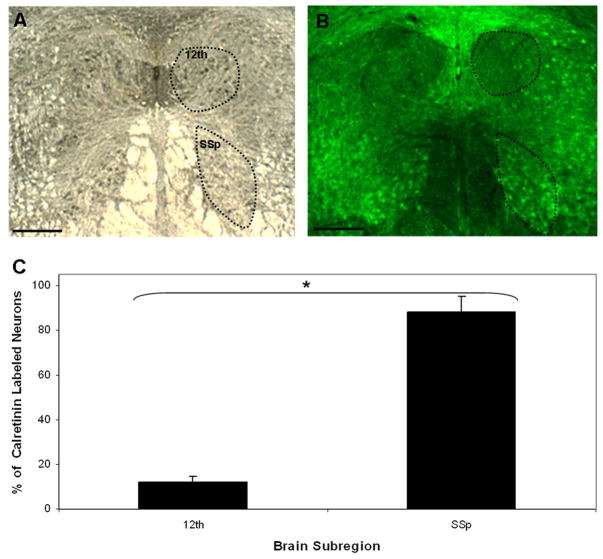
Immunohistochemical validation of calretinin expression in the 12th and SSp motor nuclei. (A) Darkfield coronal section of male zebra finch brainstem. (B) The same section as in A under fluorescence imaging shows calretinin expression (green) detected by a fluorescein isothiocyanate (FITC)-labeled calretinin-specific antibody. (C) Quantitative analysis of calretinin- expressing cells. The total number of motor neurons was determined from darkfield images; the number of calretinin-labeled neurons was determined from FITC fluorescence images. There are nine times as many calretinin-positive neurons in the SSp motor nucleus as there are in the 12th motor nucleus (n = 3; [*] p < 0.003). Scale bars, 500 μm.
References
-
- Bagnato C, Thumar J, Mayya V, Hwang S-I, Zebroski H, Claffey KP, Haudenschild C, Eng JK, Lundgren DH, Han DK. Proteomics analysis of human coronary atherosclerotic plaque: A feasibility study of direct tissue proteomics by liquid chromatography and tandem mass spectrometry. Mol Cell Proteomics. 2007;6:1088–1102. [Abstract/Free Full Text] - PubMed
-
- Carducci C, Birarelli M, Santagata P, Leuzzi V, Carducci C, Antonozzi I. Automated high-performance liquid chromatographic method for the determination of guanidinoacetic acid in dried blood spots: A tool for early diagnosis of guanidinoacetate methyltransferase deficiency. J Chromatogr B Biomed Sci Appl. 2001;755:343–348. - PubMed
-
- Cox J, Mann M. MaxQuant enables high peptide identification rates, individualized p.p.b.-range mass accuracies and proteome-wide protein quantification. Nat Biotechnol. 2008;26:1367–1372. - PubMed
Publication types
MeSH terms
Substances
Grants and funding
LinkOut - more resources
Full Text Sources