

doi: 10.1101/pdb.top97.
Dynamic, long-term in vivo imaging of tumor-stroma interactions in mouse models of breast cancer using spinning-disk confocal microscopy
- PMID: 21285277
- PMCID: PMC3533368
- DOI: 10.1101/pdb.top97
Item in Clipboard
Dynamic, long-term in vivo imaging of tumor-stroma interactions in mouse models of breast cancer using spinning-disk confocal microscopy
Cold Spring Harb Protoc.
.
No abstract available
Figures
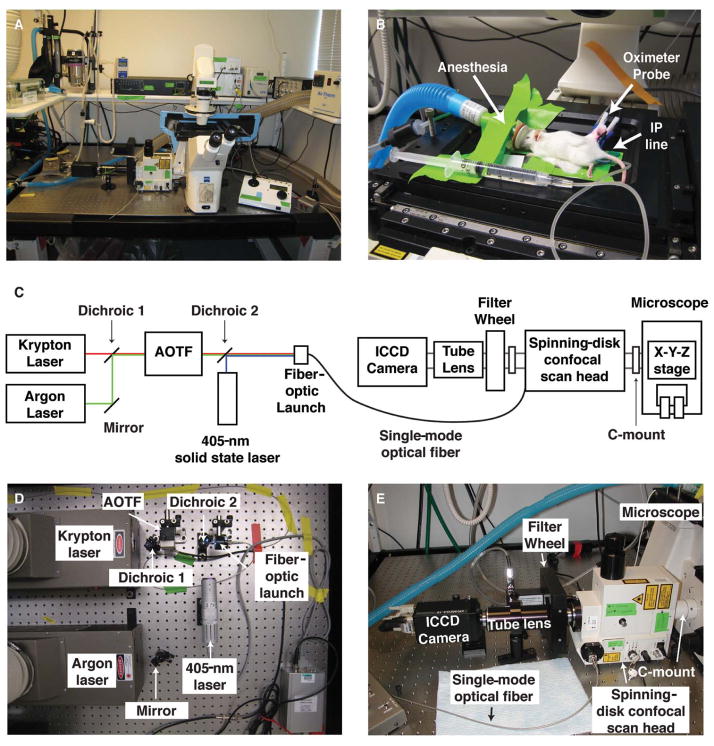
A custom-built microlensed spinning-disk confocal microscope for fast four-color imaging in live mice. (A) The microscope system consists of lasers connected to a spinning-disk confocal scan head (shown: CSU-10b, Yokogawa Corporation; modified by Solamere Technology Group), which is connected directly to a motorized, inverted microscope (shown: Zeiss Axiovert 200M inverted fluorescence microscope; Carl Zeiss Inc.). The microscope’s power supplies and control equipment as well as the isoflurane anesthesia apparatus are stored on a shelf that is vibrationally uncoupled from the surface of the optical table. (B) Mice are kept anesthetized on the microscopic stage with gaseous isoflurane, hydrated with intraperitoneal (IP) saline infusions, and monitored with an oximeter probe. (C) Schematic of the microscope. (AOTF) Acousto-optic tunable filter; (ICCD) intensified charge-coupled device. (D) Detailed view of the excitation-beam path. We use a 405-nm solid state laser (Blue Sky Research) together with additional solid state lasers (491 nm, 561 nm, 641 nm) or argon and krypton lasers (shown: Dynamic Laser). The light from the argon laser (457 nm, 477 nm, 488 nm, 514 nm) is bounced off an adjustable mirror mount and combined with the light from the krypton laser (568 nm, 647 nm) using a dichroic mirror on an adjustable mount. The combined laser light then enters an AOTF (NEOS Technologies), permitting selection of laser lines and intensity modulation. A similar setup is used to combine light from the 491-, 561-, and 641-nm solid state lasers into the AOTF (not shown). The 405-nm solid state laser is controlled electronically. The output of the AOTF and the 405-nm solid state laser is combined with a second dichroic mirror and then launched into a single-mode optical fiber. The power intensity of all laser lines is controlled electronically using a custom laser control circuit (Solamere; not shown). (E) Detailed view of the emission path. The single-mode fiber optic enters the spinning-disk confocal scan head, which is attached to the microscope via a C-mount on its left side port. The confocal scan head is connected to the filter wheel via a custom adaptor (Solamere). Distinct emission spectra are selected using bandpass filters (BP435–485, BP500–550, BP560–620, and LP680; Chroma Technology Corp.). The resulting emission light passes through an automated filter wheel (FW-1000; ASI), and a custom lens tube (Solamere) connects the filter wheel to the ICCD camera (XR/MEGA-10EX S30; Stanford Photonics) and permits external fine focus adjustment of the fluorescent image to the camera. Note that imaging is possible in a well-lit room. (Adapted from Egeblad et al. 2008.) (For color figure, see doi: 10.1101/pdb.top97 online at www.cshprotocols.org .)
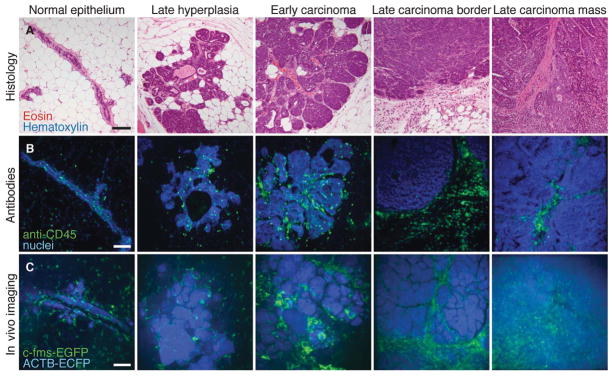
Imaging tumor microenvironments in live mice. (A) Examples of hematoxylin- and eosin-stained sections of MMTV-PyMT tumors at different stages are shown together with a normal duct from a wild-type mouse. (B) Leukocytes identified by immunofluorescence (anti-CD45, green) in mammary tissue and MMTV-PyMT tumors (nuclei stained with propidium iodide and colored blue). (C) Different tumor microenvironments within live MMTV-PyMT;ACTB-ECFP;c-fms-EGFP mice. The normal duct is from a live ACTB-ECFP;c-fms-EGFP mouse. Myeloid cells are green (c-fms-EGFP), and all cells are labeled blue (ACTB-ECFP). Images are maximum intensity projections. Scale bars, 100 μm. (Adapted from Egeblad et al. 2008.) (For color figure, see doi: 10.1101/pdb.top97 online at www.cshprotocols.org .)
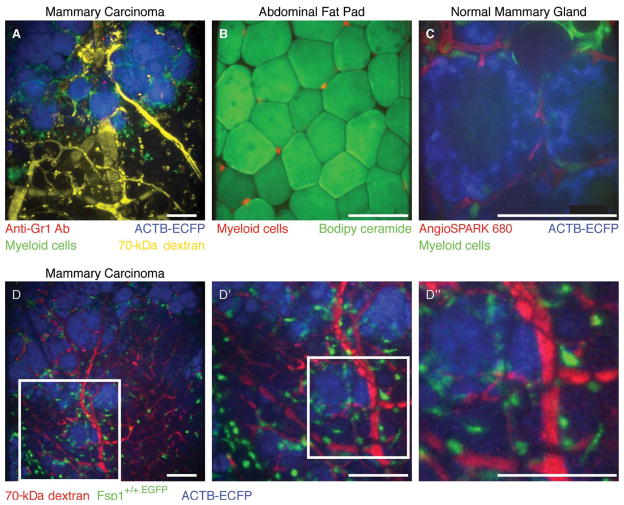
Optical achievements with the microlensed spinning-disk confocal system. (A) Four-color imaging of a carcinoma in an MMTV-PyMT;ACTB-ECFP;c-fms-EGFP mouse coinjected with fluorescent 70-kDa dextran (false-colored yellow) and anti-Gr1 antibody conjugated to Alexa 647 (red) using a Fluar 10×/0.5-NA (numerical aperture) lens. Myeloid cells are labeled green (c-fms-EGFP), and all cells are labeled blue (ACTB-ECFP) with the strongest expression of ECFP in carcinoma cells. Isotype-matched control antibodies did not label cells in the tumors (not shown). Note the Gr1+ cells (red) inside the blood vessels (yellow) and the uptake of dextran (yellow) by cells in the stroma. (Adapted, with permission, from Egeblad et al. 2008.) (B) Image of myeloid cells (red) localized between fat cells (green) within the abdominal fat pad of a mouse with red myeloid cells using an LD Plan-Neofluar 20×/0.4-NA lens. Fat cells were labeled by adding Biodipy directly to the tissue before imaging. (C) Image of a mammary gland during involution in an ACTB-ECFP;c-fms-EGFP mouse injected intravenously with AngioSPARK 680 using an LD C-Apochromat 40×/1.1-NA water-immersion lens. Myeloid cells (green, c-fms-EGFP) are found next to the epithelial lobular-alveolar structures (blue, ACTB-ECFP; note the absence of labeling in cell nuclei and lipid vacuoles) and the capillaries (red, labeled with AngioSPARK 680). Note the intravascular myeloid cell in the upper-left corner. (D) The image size and the pixel resolution at the image demonstrated on an MMTV-PyMT;ACTB-ECFP;Fsp1+/+.EGFP mouse immediately after intravenous injection with 70-kDa rhodamine-conjugated dextran using a Fluar 10×/0.5-NA lens. (D′, D″) The same maximum intensity projection is shown at increasing magnification. Scale bars, 100 μm. (For color figure, see doi: 10.1101/pdb.top97 online at www.cshprotocols.org .)
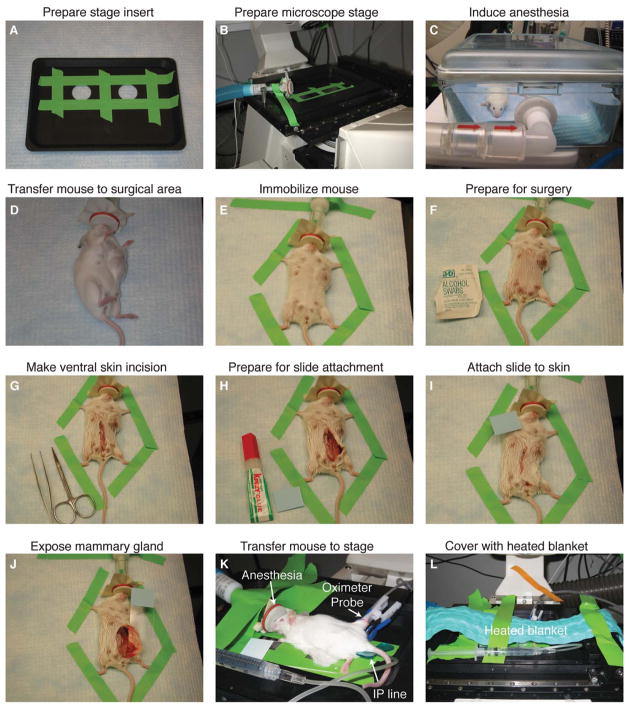
Surgical preparation of mice for long-term intravital imaging of tumor-stroma interactions in the mammary gland. (A) Coverslips are taped over the imaging ports of a custom stage insert (ASI). (B) The stage insert is placed in the x-y-z stage, and the isoflurane anesthesia line is secured to the stage. (C) The mouse is initially anesthetized with 4% isoflurane (21% oxygen, balance nitrogen) until breathing is deep and slow (2–4 min); thereafter (D) it is transferred to the surgical area, and isoflurane is reduced to 2.5%. (E) The mouse is immobilized with laboratory tape; (F) the ventral surface of the mouse is prepared for surgery with an isopropyl alcohol swab; and (G) a ventral midline incision is made with sterilized scissors. (H, I) To position the mammary gland on the microscope stage, a glass slide is attached to the skin and fur (outside surface) of the mouse using Krazy Glue. (J) The glass slide is rotated to expose the inner surface of the mammary gland; and (K) the mouse is transferred to the stage and isoflurane is reduced to 0.9%–1.1%. An indwelling IP line is inserted with a winged infusion set (for administration of saline 50 μL/h), and an oximeter probe is attached to the thigh of the mouse. (L) A recirculating heated water blanket is placed over the mouse during imaging. (For color figure, see doi: 10.1101/pdb.top97 online at www.cshprotocols.org .)
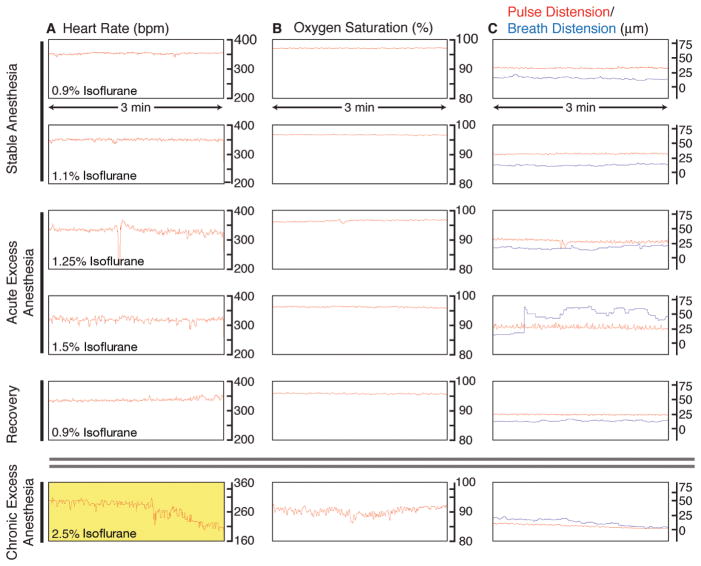
Monitoring of vital signs during long-term anesthesia and imaging. An oximeter probe attached to the thigh of the mouse is used to measure (A) the heart rate (beats per minute, bpm), (B) the arterial oxygen saturation of the blood (percent, %), and (C) the distension of blood vessels caused by the pulse and the breathing (micrometers, μm). Traces are 3-min long, originating from a single 9-h image session. (A) Under stable anesthesia (0.9%–1.1% isoflurane), the heart rate is steady and typically between 300 bpm and 450 bpm. With acute excess anesthesia, 1.25%–1.5% isoflurane, the heart rate lowers and becomes erratic. Recovery is achieved by reducing isoflurane concentration to 0.9%, and the heart rate stabilizes. At chronic excess anesthesia levels (2.5% isoflurane), the heart rate declines to critically low levels (yellow, <210 bpm). (B) Oxygen saturation stays at ~97% at anesthesia levels of 0.9%–1.25% isoflurane. It falls toward 90%–95% at 1.5% isoflurane and is slower to recover than heart rate when isoflurane is restored to 0.9%. At chronically high anesthesia levels, oxygen saturation dips to <90%. (C) Under stable anesthesia, the vascular distension caused by the pulse is relatively constant and is of higher amplitude than the vascular distension caused by breathing. At 1.25% isoflurane, the breath distension increases in amplitude, and, at 1.5% isoflurane, the mouse begins gasping, and the distension caused by breathing becomes irregular and exceeds pulse distension. At 0.9% isoflurane, the mouse recovers. Chronic exposure to excess isoflurane (2.5% isoflurane) results in a decline in the distension caused by pulse and breathing. (For color figure, see doi: 10.1101/pdb.top97 online at www.cshprotocols.org .)
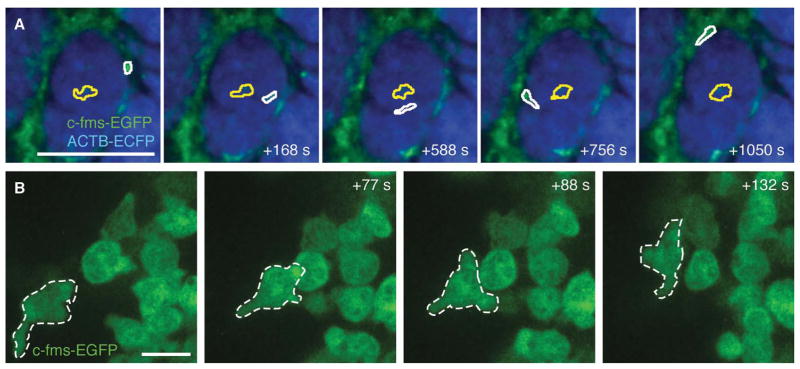
Time-lapse imaging of myeloid cell migration in vivo. (A) Example of migrational behavior of two myeloid cells in a late carcinoma: a low-migratory cell within a mass of cancer cells (yellow outline) and an extravasating and fast migrating cell (white outline) in an MMTV-PyMT;ACTB-ECFP;c-fms-EGFP mouse. See also Movie 1 for time-lapse recordings of the same field. Scale bar, 100 μm. (B) High-resolution imaging of c-fms-EGFP+ myeloid cells in the mammary gland of a live ACTB-ECFP;c-fms EGFP mouse using a Plan-Apochromat 63×/1.4-NA lens with oil immersion. One cell (outlined in white) was tracked over time. See also Movie 2 for time-lapse recordings of the same field. Scale bar, 10 μm. (For color figure, see doi: 10.1101/pdb.top97 online at www.cshprotocols.org .)
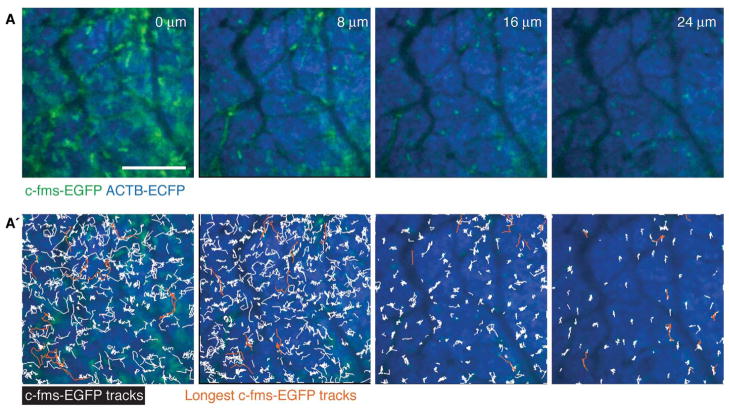
Myeloid cell migration is highest at the tumor border. (A) Different depths of the same tumor with (A′) trajectories of single c-fms-EGFP+ myeloid cells tracked over 1 h in the same tissue in an MMTV-PyMT;ACTB-ECFP;c-fms-EGFP mouse. The 10 trajectories with the most displacement are shown in orange. Scale bars, 100 μm. (For color figure, see doi: 10.1101/pdb.top97 online at www.cshprotocols.org .)
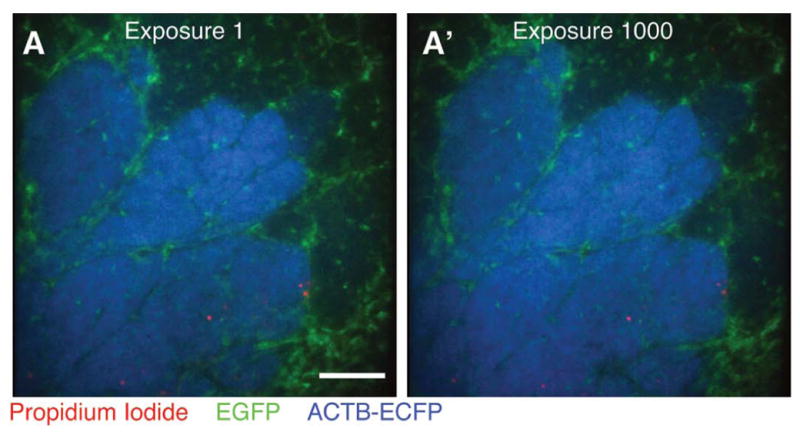
Minimal photobleaching in vivo using microlensed spinning-disk confocal microscopy. A single optical section was imaged 1000 consecutive times in three colors—EGFP (green), ECFP (blue) propidium iodide (PI; red)—in an MMTV-PyMT;ACTB-ECFP;c-fms-EGFP mouse injected intraperitonally with PI to label dead cells. Images are shown at (A) exposure 1 and (A′) exposure 1000 Scale bar, 100 μm. (For color figure, see doi: 10.1101/pdb.top97 online at www.cshprotocols.org .)
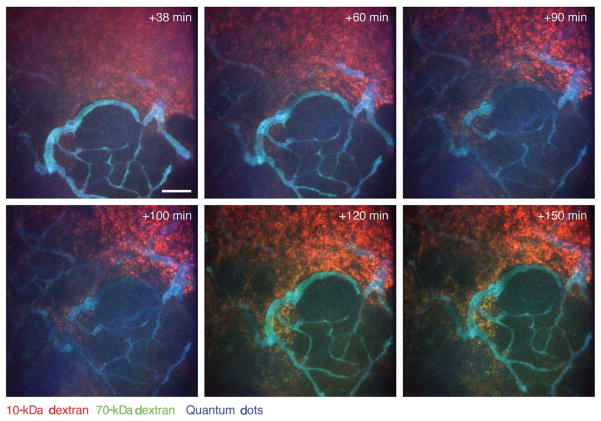
Dynamics of vascular leakage in neoplastic tissue followed by intravital imaging. Leakage of high-molecular-weight (70 kDa; green) and low-molecular-weight (10 kDa; red) dextrans into a late-stage carcinoma in an MMTV-PyMT mouse is shown. The dextrans were injected intravenously together with nontargeted quantum dots (blue) that did not leak during the imaging period (the tumor tissue is not labeled); a minimal amount of high-molecular-weight (green) dextran leaked during early time points, but it is seen colocalized with the low-molecular-weight (red) dextran (resulting in yellow) at later time points. Images are shown at indicated times after intravenous injection. Maximum intensity projections. Scale bar, 100 μm. (For color figure, see doi: 10.1101/pdb.top97 online at www.cshprotocols.org .)
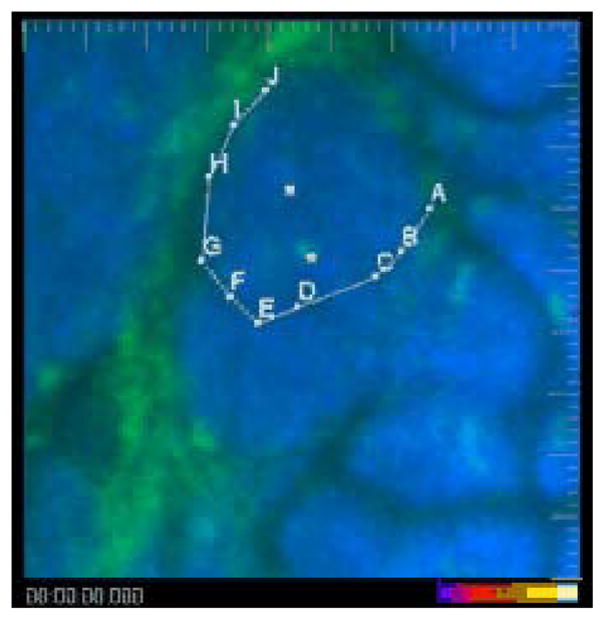
Myeloid cells extravasate and infiltrate late carcinoma lesions. Two myeloid cells (green, marked with white cubes) that already have infiltrated the cancer cell masses (blue) are largely immotile, while a third cell extravasates from a blood vessel in the right side of the field and infiltrates the tumor (following points A–J). Shown are the ECFP (blue) and EGFP (green) channels in an MMTV-PyMT;ACTB-ECFP;c-fms-EGFP mouse. The video is shown first with and then without marking. Large tick marks are 20 μm apart. Exposure time was 33 msec for ECFP and 67 msec for EGFP. Playback time is 600× real time, representing a 50-min-long image sequence with 42 sec between frames. (To view movie, see doi: 10.1101/pdb.top97 online at www.cshprotocols.org .)
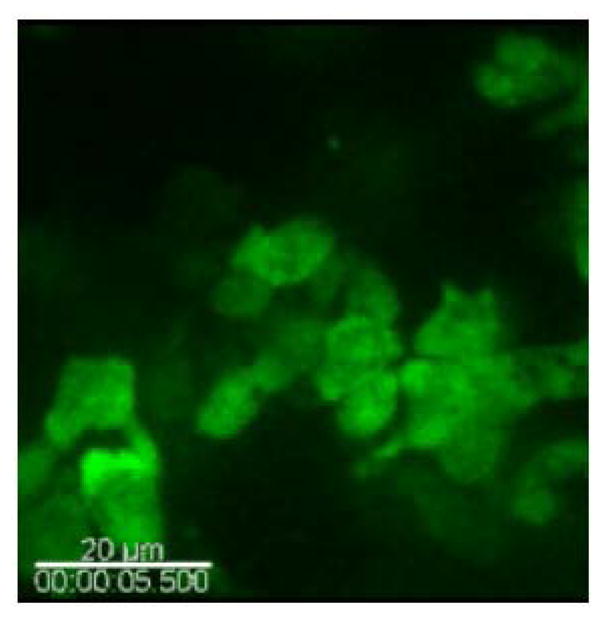
Myeloid cells migrate in response to wounding on the surface of a normal mammary gland. Myeloid cells (green) are seen migrating in the mammary adipogenic stroma in a c-fms-EGFP mouse. Shown is the EGFP (green) channel. Scale bar, 20 μm. Exposure time was 133 msec for EGFP. Playback is 50× real time, representing an 8-min-long image sequence with 5 sec between frames. (To view movie, see doi: 10.1101/pdb.top97 online at www.cshprotocols.org .)
References
-
- Ahmed F, Wyckoff J, Lin EY, Wang W, Wang Y, Hennighausen L, Miyazaki J, Jones J, Pollard JW, Condeelis JS, et al. GFP expression in the mammary gland for imaging of mammary tumor cells in transgenic mice. Cancer Res. 2002;62:7166–7169. - PubMed
-
- Brown EB, Campbell RB, Tsuzuki Y, Xu L, Carmeliet P, Fukumura D, Jain RK. In vivo measurement of gene expression, angiogenesis and physiological function in tumors using multiphoton laser scanning microscopy. Nat Med. 2001;7:864–868. - PubMed
-
- Brown E, McKee T, diTomaso E, Pluen A, Seed B, Boucher Y, Jain RK. Dynamic imaging of collagen and its modulation in tumors in vivo using second-harmonic generation. Nat Med. 2003;9:796–800. - PubMed
Publication types
MeSH terms
Grants and funding
LinkOut - more resources
Full Text Sources
Other Literature Sources
Medical