. 2011 Mar;121(3):941-55.
doi: 10.1172/JCI43584.

Particulate allergens potentiate allergic asthma in mice through sustained IgE-mediated mast cell activation

Affiliations

Particulate allergens potentiate allergic asthma in mice through sustained IgE-mediated mast cell activation

Cong Jin et al. J Clin Invest. 2011 Mar.

Erratum in

Expression of concern in

Abstract

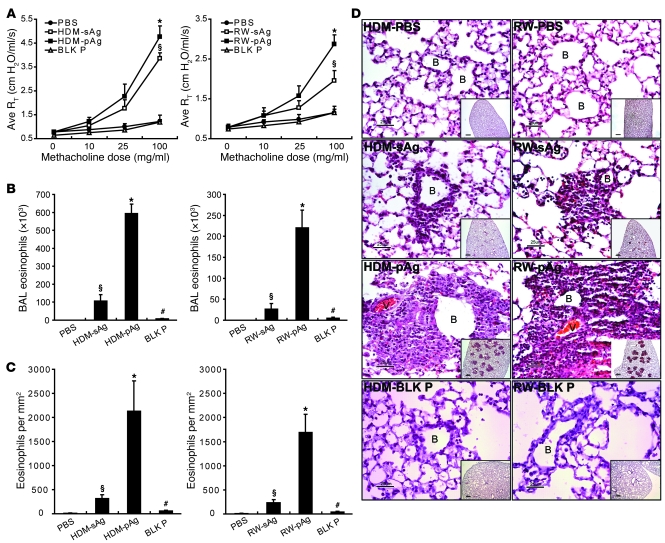
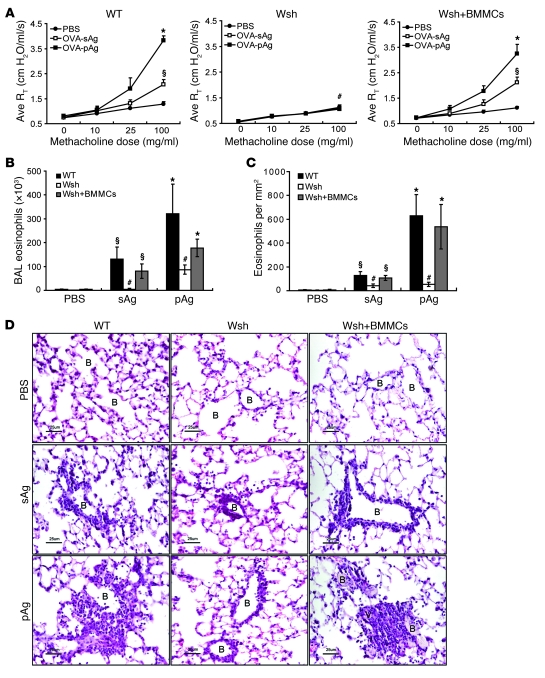
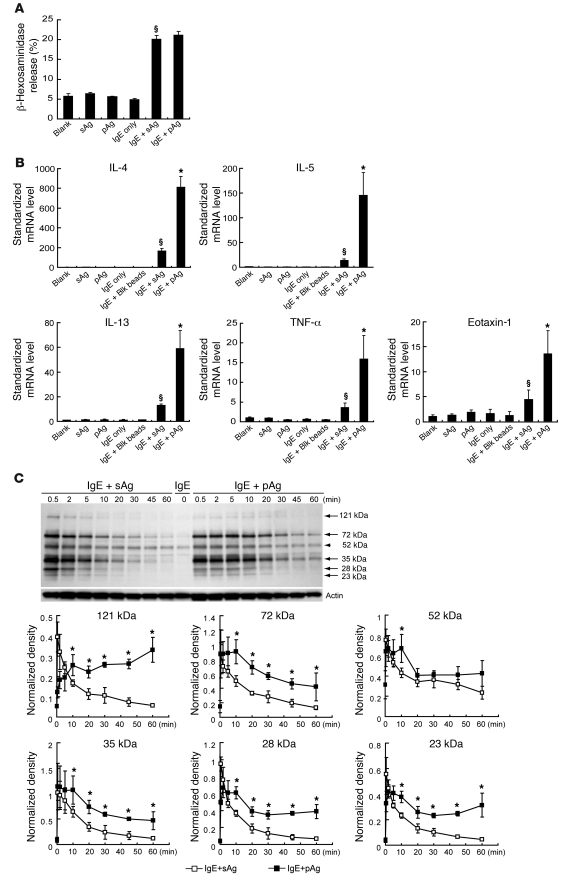
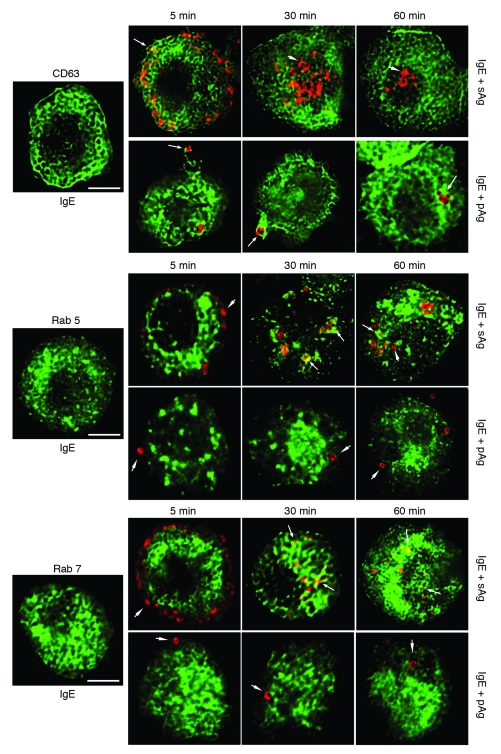
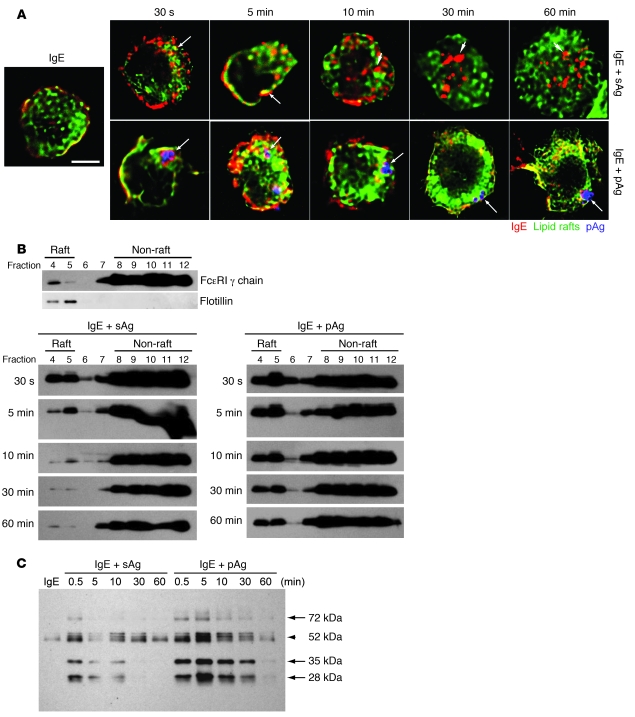
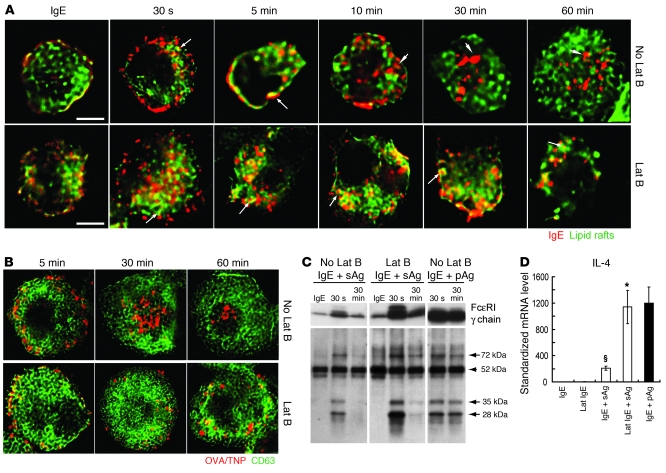
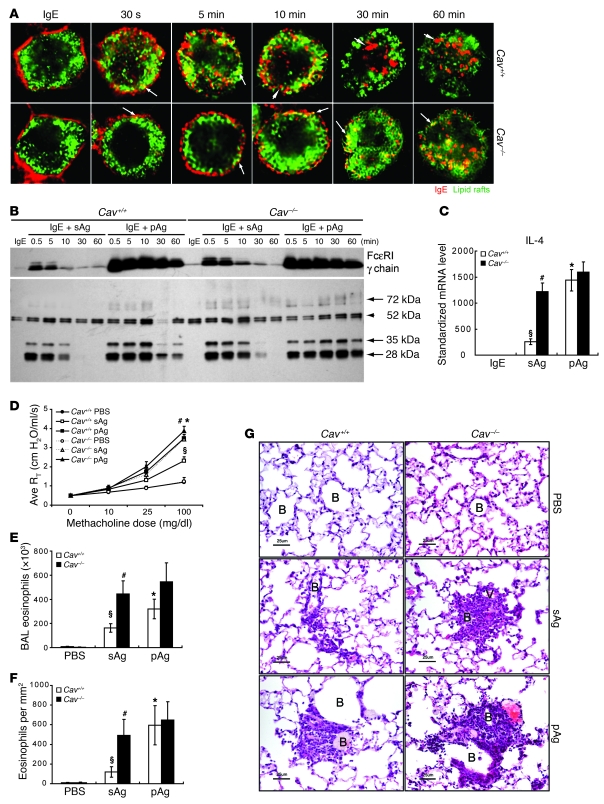
Allergic asthma is characterized by airway hyperresponsiveness, inflammation, and a cellular infiltrate dominated by eosinophils. Numerous epidemiological studies have related the exacerbation of allergic asthma with an increase in ambient inhalable particulate matter from air pollutants. This is because inhalable particles efficiently deliver airborne allergens deep into the airways, where they can aggravate allergic asthma symptoms. However, the cellular mechanisms by which inhalable particulate allergens (pAgs) potentiate asthmatic symptoms remain unknown, in part because most in vivo and in vitro studies exploring the pathogenesis of allergic asthma use soluble allergens (sAgs). Using a mouse model of allergic asthma, we found that, compared with their sAg counterparts, pAgs triggered markedly heightened airway hyperresponsiveness and pulmonary eosinophilia in allergen-sensitized mice. Mast cells (MCs) were implicated in this divergent response, as the differences in airway inflammatory responses provoked by the physical nature of the allergens were attenuated in MC-deficient mice. The pAgs were found to mediate MC-dependent responses by enhancing retention of pAg/IgE/FcεRI complexes within lipid raft–enriched, CD63(+) endocytic compartments, which prolonged IgE/FcεRI-initiated signaling and resulted in heightened cytokine responses. These results reveal how the physical attributes of allergens can co-opt MC endocytic circuitry and signaling responses to aggravate pathological responses of allergic asthma in mice.


Figures

Figure 1
Figure 1. pAgs induce heightened airway allergic responses compared with sAgs.
Allergen-sensitized mice were challenged with HDM or RW in sAg or pAg form, PBS, or unconjugated particles (BLK P; i.e., blank particles). (AC) At 48 hours after challenge, (A) AHR (quantified by average resistance measurements; Ave RT), (B) BAL eosinophil influx, and (C) lung histology were analyzed (n = 5). *P < 0.05, pAg versus sAg; §P < 0.01, sAg versus PBS; #P < 0.01, pAg versus unconjugated particles. (D) H&E-stained lung tissues. B, small bronchioles; V, vasculature. Insets show larger views of inflammation sites. Scale bars: 25 μm; 200 μm (insets). Each photomicrograph is representative of 4 mice.
Figure 2
Figure 2. MCs are required for pulmonary pathological responses to pAgs and sAgs in sensitized mice.
Pulmonary pathological responses in OVA/TNP-sensitized mice after exposure to soluble OVA/TNP (sAg) or particles conjugated with OVA/TNP (pAg). (AC) AHR (A), BAL eosinophil counts (B), and lung histology (C) in WT, Wsh, and BMMC-reconstituted Wsh mice were examined 48 hours after challenge (n = 4 per group). AHR and eosinophil responses to sAgs or pAgs in Wsh mice were largely attenuated. *P < 0.05 versus sAg; §P < 0.01 versus PBS; #P < 0.05 versus WT and BMMC-reconstituted Wsh. (D) H&E-stained lung tissues show eosinophils accumulating around small bronchioles and vasculature. Data are representative of samples from 4 mice. Scale bars: 25 μm.
Figure 3
Figure 3. Differential cytokine and chemokine responses of BMMCs after exposure to sAgs or pAgs.
TNP-specific IgE–sensitized BMMCs were challenged with 1 μg sAg (OVA/TNP) or pAg (particles coated with OVA/TNP). (A) At 1 hour after allergen exposure, MC degranulation was assessed by β-hexosaminidase release (n = 3). §P < 0.01 versus vehicle. (B) De novo synthesis of proinflammatory mediators. At 1 hour after exposure, mRNA expression levels of IL-4, IL-5, IL-13, TNF-α, and eotaxin-1 in BMMCs were determined by real-time PCR (n = 4). Untreated BMMCs, unsensitized BMMCs challenged by sAgs or pAgs, and sensitized BMMCs without challenge or exposed to blank beads served as controls. §P < 0.01 versus controls; *P < 0.01 versus sAg. (C) Anti-phosphotyrosine Western blot of proteins from IgE-sensitized BMMCs following exposure to sAgs or pAgs. In all cases (arrows) except a 52-kDa band (arrowhead), phosphorylation evoked by pAgs appeared appreciably more sustained than that by sAgs. Blot is representative of 4 separate experiments. The intensity of phosphorylation of prominent proteins at various time points was also assessed using densitometry, using actin as the internal quantitative control. *P < 0.01 versus sAg.
Figure 4
Figure 4. Internalized sAgs and pAgs follow different endocytic pathways in BMMCs.
Endocytosis of sAgs or pAgs was investigated in BMMCs stably transfected with GFP-CD63, GFP-Rab5, or GFP-Rab7. Confocal microscopic images of each transfected BMMC type prior to addition of allergen are shown. Images of GFP-transfected MCs containing allergen prelabeled with Alexa Fluor 546 (red) were collected at 5, 30, and 60 minutes. Arrows denote examples of allergens encased in GFP-positive compartments. Arrowheads denote examples in which no colocalization is evident. All pictures are representative of 3 separate experiments. Scale bars: 5 μm.
Figure 5
Figure 5. IgE/FcεRI complexes are retained within lipid raft–enriched domains of BMMCs following exposure to pAgs, but not to sAgs.
(A) Association of IgE/FcεRI complexes (red) with lipid rafts (green) at the indicated time points following exposure to sAgs or pAgs. Shown in blue are pAgs. Arrows denote examples of colocalization between IgE/FcεRI complexes and lipid raft–enriched regions. Arrowheads denote examples in which IgE/FcεRI complexes have separated from lipid raft–enriched compartments and no colocalization is evident. Scale bar: 5 μm. (B) Association of FcεRI-γ chain with lipid raft fractions in sensitized BMMCs before and at various time points after exposure to sAgs or pAgs. Cell fractions were obtained after sucrose gradient centrifugation and probed for FcεRI-γ chain on a Western blot. Distribution of FcεRI-γ chain in cell fractions prior to addition of allergen is also shown. Based on the location of flotillin-1, fractions 4 and 5 are defined as the lipid raft fractions. (C) Sucrose gradient fractions 4 and 5 were pooled and subjected to Western blot to detect tyrosine phosphorylation within lipid fractions of BMMCs at various time points after exposure to sAgs or pAgs. Arrows denote phosphorylated bands that appeared more intense in pAg- relative to sAg-stimulated cells. Arrowhead denotes a band for which differences between sAg- and pAg-stimulated cells was not marked. Images are representative of 3 separate experiments.
Figure 6
Figure 6. The endocytic and signaling responses of BMMCs to sAgs following pretreatment with latrunculin B (Lat B) is comparable to responses evoked by pAgs in untreated BMMCs.
(A) Association of IgE/FcεRI complexes (red) with lipid raft domains (green) in latrunculin B–treated and untreated BMMCs after exposure to sAgs. Arrows denote examples of colocalization of IgE/FcεRI complexes with lipid rafts. Arrowheads denote areas where IgE/FcεRI complexes have separated from lipid rafts. (B) Dynamic localization of sAgs (red) within GFP-CD63+ (green) compartments in latrunculin B–treated and untreated BMMCs. (A and B) Original magnification, ×100. Scale bars: 5 μm. (C) Western blot to detect FcεRI-γ chain and tyrosine-phosphorylated proteins in pooled lipid raft fractions. Arrows denote bands that were enhanced by sAgs following latrunculin B treatment. Arrowhead denotes a band that did not appear to change in strength after latrunculin B treatment. Data in AC are representative of 3 separate experiments. (D) Latrunculin B–treated BMMCs expressed higher levels of IL-4 than did untreated BMMCs 1 hour after sAg exposure (n = 4). *P < 0.01 versus untreated BMMCs; §P < 0.01 versus vehicle. The enhanced level of IL-4 expression was comparable to that induced by pAgs in untreated BMMCs (black bar).
Figure 7
Figure 7. Caveolin 1 deficiency results in enhanced signaling and functional responses of sAgs to levels similar to that induced by pAgs in WT BMMCs.
(A) Association of IgE/FcεRI complexes (red) with lipid rafts (green) in sensitized Cav+/+ and Cav–/– BMMCs at different times after exposure to sAgs. Arrows denote examples of colocalization of IgE/FcεRI complexes with lipid rafts. Arrowheads denote areas in which IgE/FcεRI complexes have separated from lipid rafts. Scale bars: 5 μm. Data are representative of 3 separate experiments. (B) FcεRI-γ chain and tyrosine-phosphorylated proteins in pooled lipid raft fractions from sensitized Cav+/+ and Cav–/– BMMCs challenged with sAgs or pAgs. Arrows denote bands that were enhanced by sAgs in Cav–/– BMMCs. Arrowhead denotes a band that did not appear to change in strength in Cav–/– BMMCs. (C) Levels of IL-4 produced by sensitized Cav–/– and Cav+/+ BMMCs 1 hour after sAg or pAg exposure (n = 4). AHR response (D), BAL eosinophil counts (E), and lung histology (F) evoked by sAgs or pAgs in sensitized Wsh mice reconstituted with Cav–/– BMMCs or Cav+/+ BMMCs (n = 5). (CF) §P < 0.01 versus vehicle controls; *P < 0.01 versus Cav+/+ sAg; #P < 0.01 versus Cav+/+ sAg. (G) Histology of lungs from sensitized Wsh mice reconstituted with Cav–/– BMMCs or Cav+/+ BMMCs after exposure to sAgs or pAgs. Samples were stained with H&E. Eosinophil accumulation around small bronchioles and vasculature is denoted. Each histological photomicrograph is representative of 4 mice. Scale bars: 25 μm.

Comment in

  • Findings of Research Misconduct.
    [No authors listed] [No authors listed] Fed Regist. 2019 Nov 7;84(216):60097-60098. Fed Regist. 2019. PMID: 37547121 Free PMC article. No abstract available.

References

    1. Sugita M, Kuribayashi K, Nakagomi T, Miyata S, Matsuyama T, Kitada O. Allergic bronchial asthma: airway inflammation and hyperresponsiveness. Intern Med. 2003;42(8):636–643. doi: 10.2169/internalmedicine.42.636. - DOI - PubMed
    1. Cohn L, Elias JA, Chupp GL. Asthma: mechanisms of disease persistence and progression. Annu Rev Immunol. 2004;22:789–815. doi: 10.1146/annurev.immunol.22.012703.104716. - DOI - PubMed
    1. Braman SS. The global burden of asthma. Chest. 2006;130(1 suppl):4S–12S. doi: 10.1378/chest.130.1_suppl.4S. - DOI - PubMed
    1. Downs SH, et al. Reduced exposure to PM10 and attenuated age-related decline in lung function. N Engl J Med. 2007;357(23):2338–2347. doi: 10.1056/NEJMoa073625. - DOI - PubMed
    1. McCreanor J, et al. Respiratory effects of exposure to diesel traffic in persons with asthma. N Engl J Med. 2007;357(23):2348–2358. doi: 10.1056/NEJMoa071535. - DOI - PubMed

Publication types

MeSH terms