. 2011 Jan 25:5:3.
doi: 10.3389/fnsys.2011.00003. eCollection 2011.

Executive functions and prefrontal cortex: a matter of persistence?

Affiliations

Executive functions and prefrontal cortex: a matter of persistence?

Gareth Ball et al. Front Syst Neurosci. .

Abstract

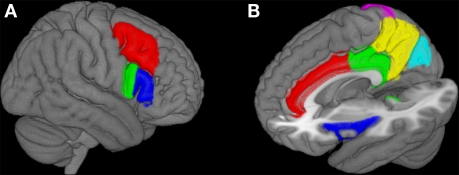
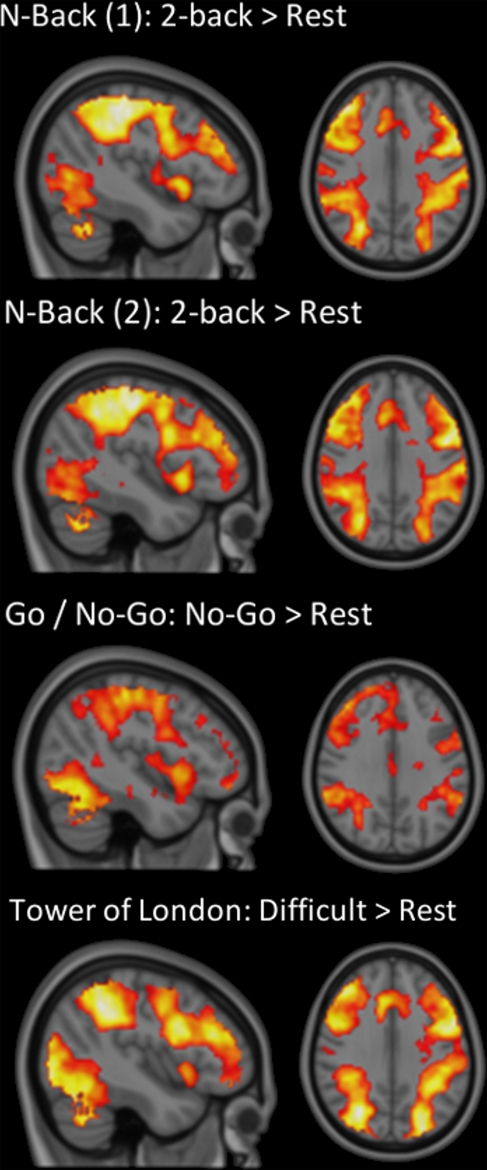
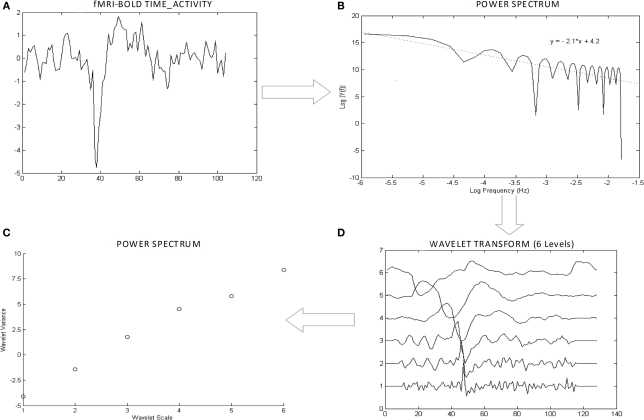
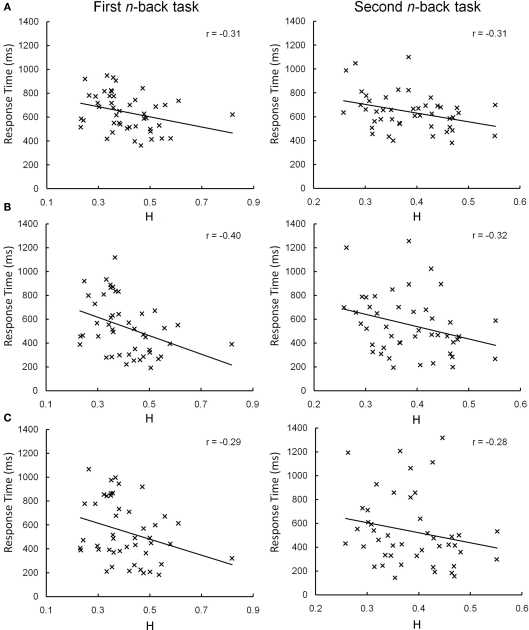
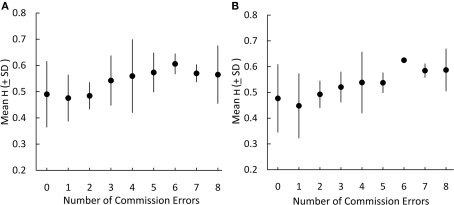
Executive function is thought to originates from the dynamics of frontal cortical networks. We examined the dynamic properties of the blood oxygen level dependent time-series measured with functional MRI (fMRI) within the prefrontal cortex (PFC) to test the hypothesis that temporally persistent neural activity underlies performance in three tasks of executive function. A numerical estimate of signal persistence, the Hurst exponent, postulated to represent the coherent firing of cortical networks, was determined and correlated with task performance. Increasing persistence in the lateral PFC was shown to correlate with improved performance during an n-back task. Conversely, we observed a correlation between persistence and increasing commission error - indicating a failure to inhibit a prepotent response - during a Go/No-Go task. We propose that persistence within the PFC reflects dynamic network formation and these findings underline the importance of frequency analysis of fMRI time-series in the study of executive functions.

Keywords: BOLD; Hurst exponent; executive function; functional MRI; networks; persistence; prefrontal cortex.


Figures

Figure 1
Figure 1
Regions of interest for analysis. Regions were selected to represent the lateral PFC (A: Red, middle frontal gyrus; Green, inferior frontal gyrus pars opercularis; Blue, inferior frontal gyrus pars triangularis) and cortical regions identified as part of an “executive” network (B: Red, anterior cingulate cortex; Green, posterior cingulate cortex; Blue, insula; Yellow, precuneus; Light Blue, cuneus; Pink, superior parietal cortex; Not shown: parahippocampal gyrus, medial frontal cortex). PFC and associated cortical regions of interest are shown on the surface of the MNI152 brain.
Figure 2
Figure 2
Group BOLD activation during each task of executive function. Group average BOLD activations during the difficult condition (Difficult > Rest) of the Tower of London task, the 2-back (2-back > Rest) condition of both n-back sets and the No-Go (No-Go > Rest) condition of the Go/No-Go task are shown in MNI152 standard space in radiological convention (whole-brain cluster corrected, Z = 2.3, p < 0.05).
Figure 3
Figure 3
Demonstrative plots of Hurst calculation. The figure illustrates the process for the calculation of the Hurst exponent (H) for an exemplar of time-series (A). The power spectrum (B) of the series is calculated to assess its class. The rate of decay of energy β is within the [1–3] range and therefore the signal is well within the fractional Brownian class (fBn) The time-series is filtered with the wavelet transform with six levels, highest frequency at level 1, lowest frequency level 6 (C). The semilog-plot of the six wavelet energies is fitted to obtain the Hurst exponent from the slope of the line (D).
Figure 4
Figure 4
Correlations between H and n-back response time in the left middle frontal gyrus. During the first (left column) and second (right column) n-back sets, correlations between H in the left middle frontal gyrus and response time during the 0-back (A) and 1-back (B) and 2-back (C) task condition blocks were similar, despite only reaching significance in the first set. The estimate of H in Subject 27 during the first n-back task was identified as a possible outlier (H = 0.82, Z = 3.6). After removing this data point, the observed correlations remained (0-back: r = –0.35; 1-back: r = –0.40; 2-back: r = –0.28).
Figure 5
Figure 5
H estimated from individual BOLD time-series in the left (A) and right (B) middle frontal gyrus during the Go / No-Go task is associated with increasing number of commission errors during No-Go trials.

References

    1. Anderson C. M., Lowen S. B., Renshaw P. F. (2006). Emotional task-dependent low-frequency fluctuations and methylphenidate: wavelet scaling analysis of 1/f-type fluctuations in fMRI of the cerebellar vermis. J. Neurosci. Methods 151, 52–61 - PubMed
    1. Apud J. A., Mattay V., Chen J., Kolachana B. S., Callicott J. H., Rasetti R., Alce G., Iudicello J. E., Akbar N., Egan M. F., Goldberg T. E., Weinberger D. R. (2007). Tolcapone improves cognition and cortical information processing in normal human subjects. Neuropsychopharmacology 32, 1011–102010.1038/sj.npp.1301227 - DOI - PubMed
    1. Arnsten A. F. (1997). Catecholamine regulation of the prefrontal cortex. J. Psychopharmacol. 11, 151–16210.1177/026988119701100208 - DOI - PubMed
    1. Beauchamp M. H., Dagher A., Aston J. A., Doyon J. (2003). Dynamic functional changes associated with cognitive skill learning of an adapted version of the Tower of London task. Neuroimage 20, 1649–166010.1016/j.neuroimage.2003.07.003 - DOI - PubMed
    1. Beran J. (1994). Statistics for Long-Memory Processes. New York: Chapman & Hall