

Predicting protein flexibility through the prediction of local structures
- PMID: 21287616
- PMCID: PMC3317885
- DOI: 10.1002/prot.22922
Predicting protein flexibility through the prediction of local structures
Abstract
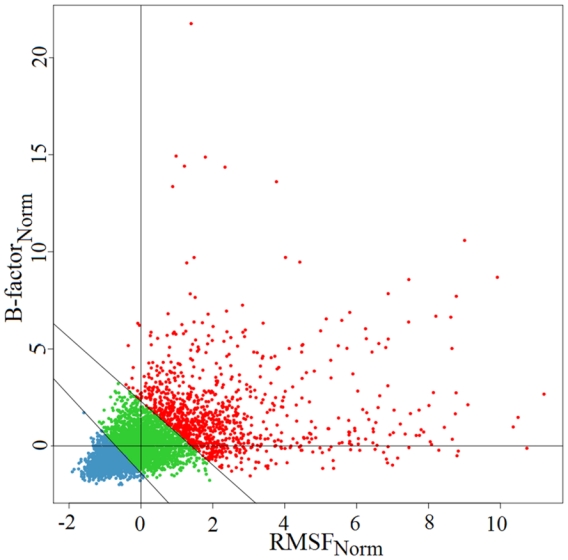
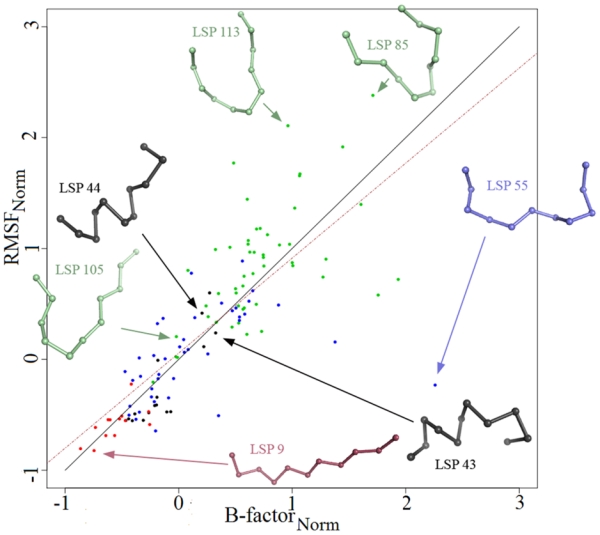
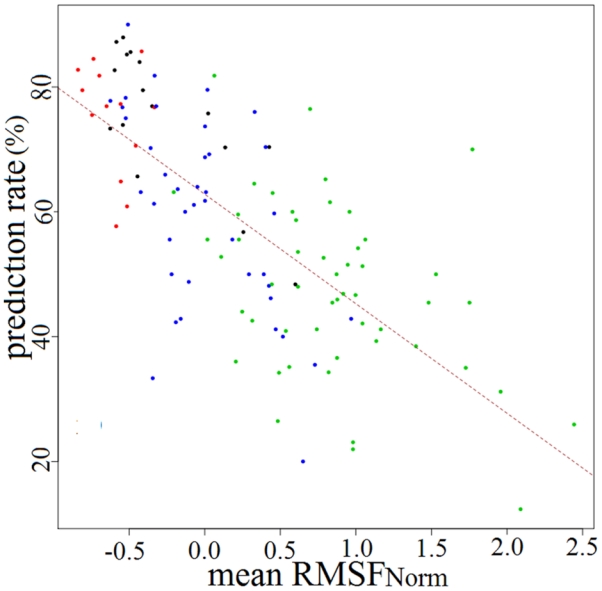
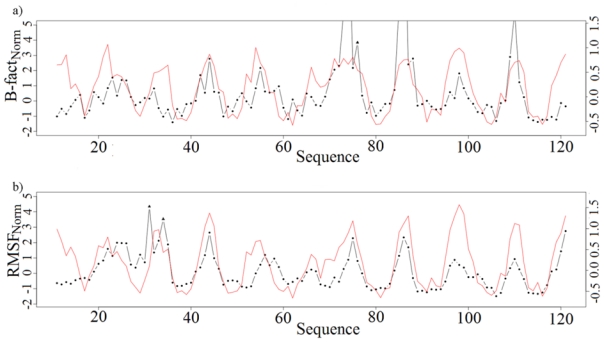
Protein structures are valuable tools for understanding protein function. However, protein dynamics is also considered a key element in protein function. Therefore, in addition to structural analysis, fully understanding protein function at the molecular level now requires accounting for flexibility. However, experimental techniques that produce both types of information simultaneously are still limited. Prediction approaches are useful alternative tools for obtaining otherwise unavailable data. It has been shown that protein structure can be described by a limited set of recurring local structures. In this context, we previously established a library composed of 120 overlapping long structural prototypes (LSPs) representing fragments of 11 residues in length and covering all known local protein structures. On the basis of the close sequence-structure relationship observed in LSPs, we developed a novel prediction method that proposes structural candidates in terms of LSPs along a given sequence. The prediction accuracy rate was high given the number of structural classes. In this study, we use this methodology to predict protein flexibility. We first examine flexibility according to two different descriptors, the B-factor and root mean square fluctuations from molecular dynamics simulations. We then show the relevance of using both descriptors together. We define three flexibility classes and propose a method based on the LSP prediction method for predicting flexibility along the sequence. The prediction rate reaches 49.6%. This method competes rather efficiently with the most recent, cutting-edge methods based on true flexibility data learning with sophisticated algorithms. Accordingly, flexibility information should be taken into account in structural prediction assessments.
Copyright © 2010 Wiley-Liss, Inc.
Figures
References
-
- Noble ME, Endicott JA, Johnson LN. Protein kinase inhibitors: insights into drug design from structure. Science. 2004;303:1800–1805. - PubMed
-
- Blundell TL, Sibanda BL, Montalvao RW, Brewerton S, Chelliah V, Worth CL, Harmer NJ, Davies O, Burke D. Structural biology and bioinformatics in drug design: opportunities and challenges for target identification and lead discovery. Philos Trans R Soc Lond B Biol Sci. 2006;361:413–423. - PMC - PubMed
-
- Eisenmesser EZ, Millet O, Labeikovsky W, Korzhnev DM, Wolf-Watz M, Bosco DA, Skalicky JJ, Kay LE, Kern D. Intrinsic dynamics of an enzyme underlies catalysis. Nature. 2005;438:117–121. - PubMed
-
- Boehr DD, McElheny D, Dyson HJ, Wright PE. The dynamic energy landscape of dihydrofolate reductase catalysis. Science. 2006;313:1638–1642. - PubMed
