

Evidence of hearing loss in a 'normally-hearing' college-student population
- PMID: 21288064
- PMCID: PMC3095511
- DOI: 10.3109/14992027.2010.540722
Evidence of hearing loss in a 'normally-hearing' college-student population
Abstract
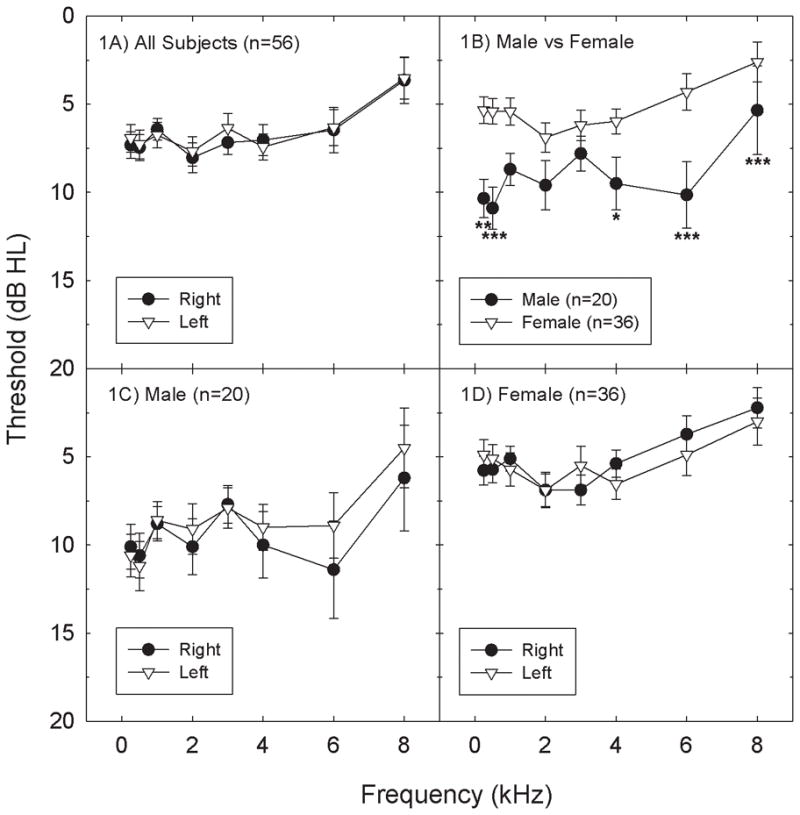
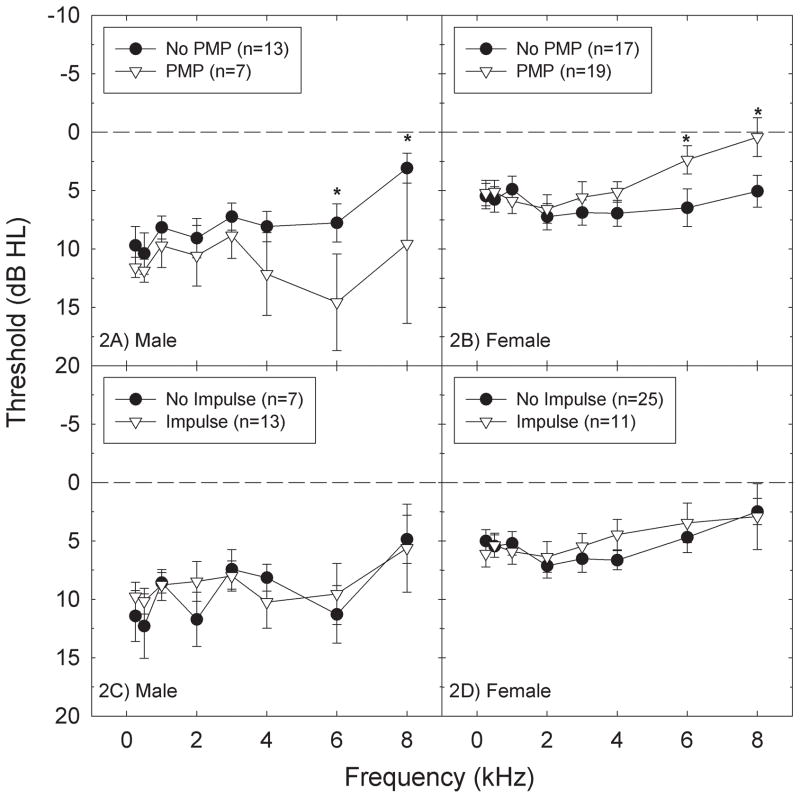
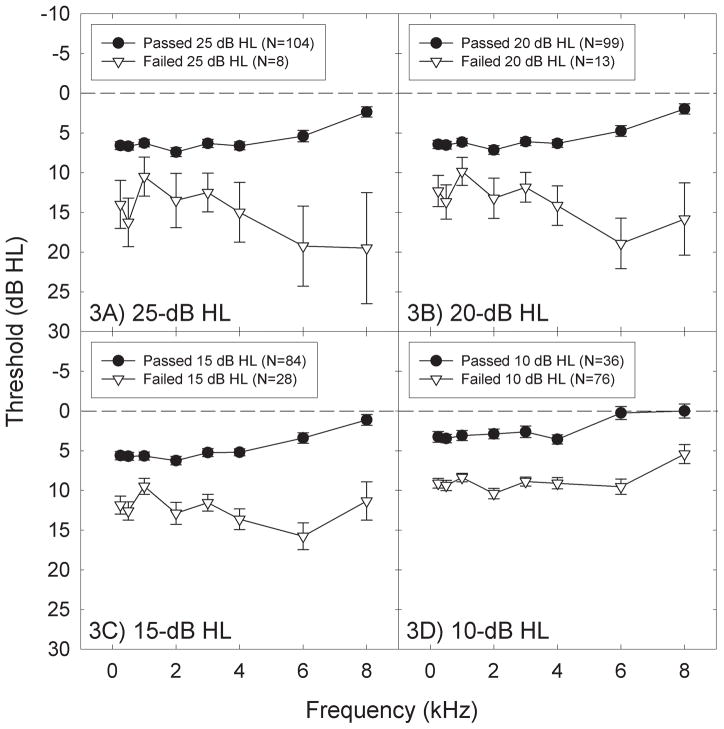
We report pure-tone hearing threshold findings in 56 college students. All subjects reported normal hearing during telephone interviews, yet not all subjects had normal sensitivity as defined by well-accepted criteria. At one or more test frequencies (0.25-8 kHz), 7% of ears had thresholds ≥25 dB HL and 12% had thresholds ≥20 dB HL. The proportion of ears with abnormal findings decreased when three-frequency pure-tone-averages were used. Low-frequency PTA hearing loss was detected in 2.7% of ears and high-frequency PTA hearing loss was detected in 7.1% of ears; however, there was little evidence for 'notched' audiograms. There was a statistically reliable relationship in which personal music player use was correlated with decreased hearing status in male subjects. Routine screening and education regarding hearing loss risk factors are critical as college students do not always self-identify early changes in hearing. Large-scale systematic investigations of college students' hearing status appear to be warranted; the current sample size was not adequate to precisely measure potential contributions of different sound sources to the elevated thresholds measured in some subjects.
Conflict of interest statement
The authors report no conflicts of interest. The authors alone are responsible for the content and writing of the paper. Support for this research was provided by an inter-institutional subcontract to the University of Florida, with funds from the National Institutes of Health via NIH/NIDCD U01 DC 008423 awarded to Josef Miller.
Figures
References
-
- Agrawal Y, Platz EA, Niparko JK. Prevalence of hearing loss and differences by demographic characteristics among US adults: data from the National Health and Nutrition Examination Survey, 1999–2004. Arch Intern Med. 2008;168:1522–1530. - PubMed
-
- Agrawal Y, Platz EA, Niparko JK. Risk factors for hearing loss in US adults: data from the National Health and Nutrition Examination Survey, 1999 to 2002. Otol Neurotol. 2009;30:139–145. - PubMed
-
- American National Standards Institute. Specifications for audiometers, S3.6–1969. American National Standards Institute; New York: 1969.
-
- American Standards Association. American standard specification for audiometers for general diagnostic purposes, Z24.5–1951. New York: ANSI; 1951.
-
- Barrenas ML, Hellstrom PA. The effect of low level acoustic stimulation on susceptibility to noise in blue- and brown-eyed young human subjects. Ear Hear. 1996;17:63–68. - PubMed
Publication types
MeSH terms
Grants and funding
LinkOut - more resources
Full Text Sources
Other Literature Sources
Medical
Miscellaneous