Comparative Study
. 2011 Feb;59(2):345-52.
doi: 10.1111/j.1532-5415.2010.03267.x. Epub 2011 Feb 2.

Cellular telephones measure activity and lifespace in community-dwelling adults: proof of principle

Affiliations
Comparative Study

Cellular telephones measure activity and lifespace in community-dwelling adults: proof of principle

Ana Katrin Schenk et al. J Am Geriatr Soc. 2011 Feb.

Abstract

Objectives: To describe a system that uses off-the-shelf sensor and telecommunication technologies to continuously measure individual lifespace and activity levels in a novel way.

Design: Proof of concept involving three field trials of 30, 30, and 21 days.

Setting: Omaha, Nebraska, metropolitan and surrounding rural region.

Participants: Three participants (48-year-old man, 33-year-old woman, and 27-year-old male), none with any functional limitations.

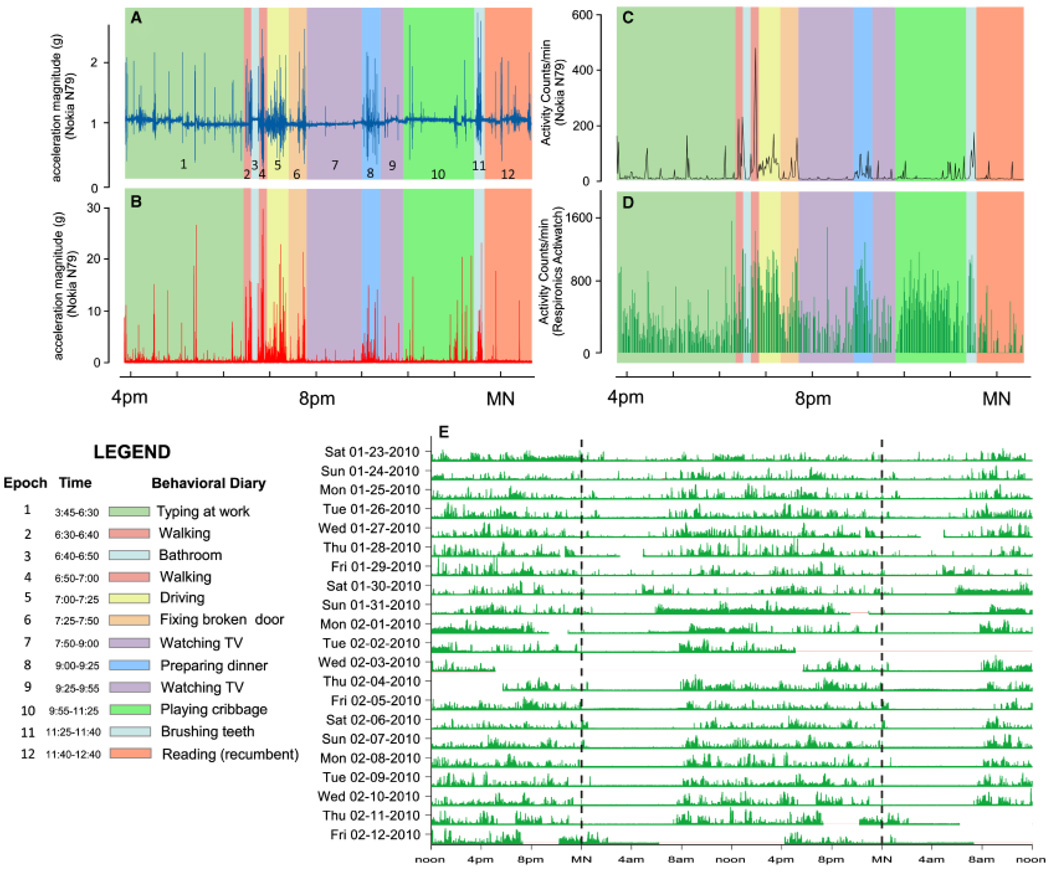
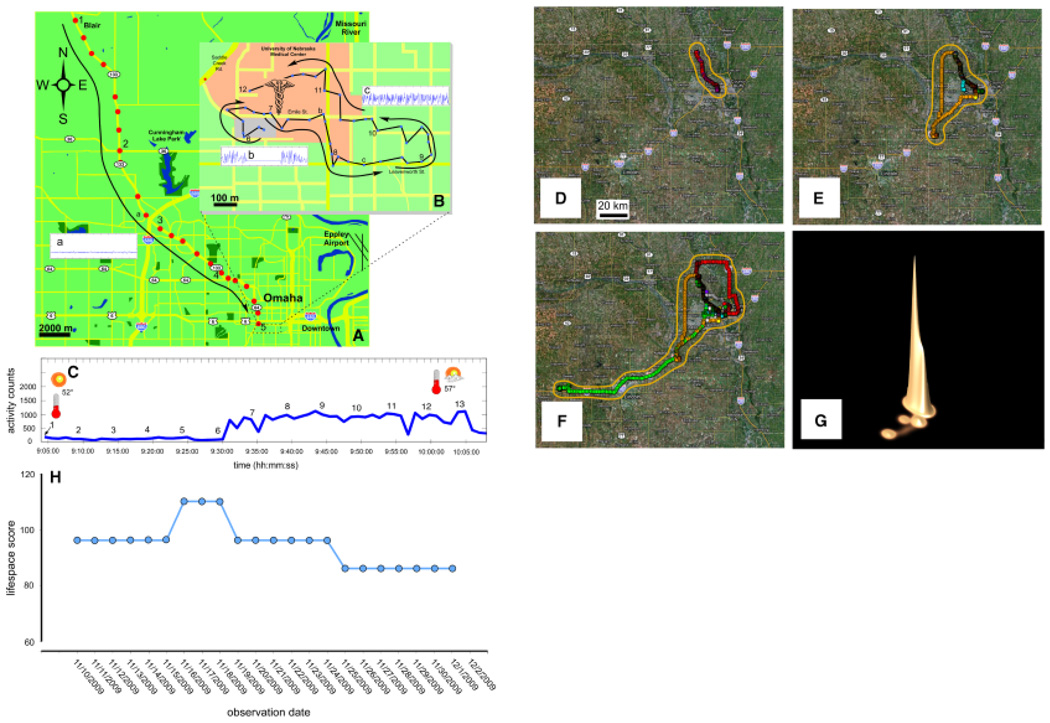
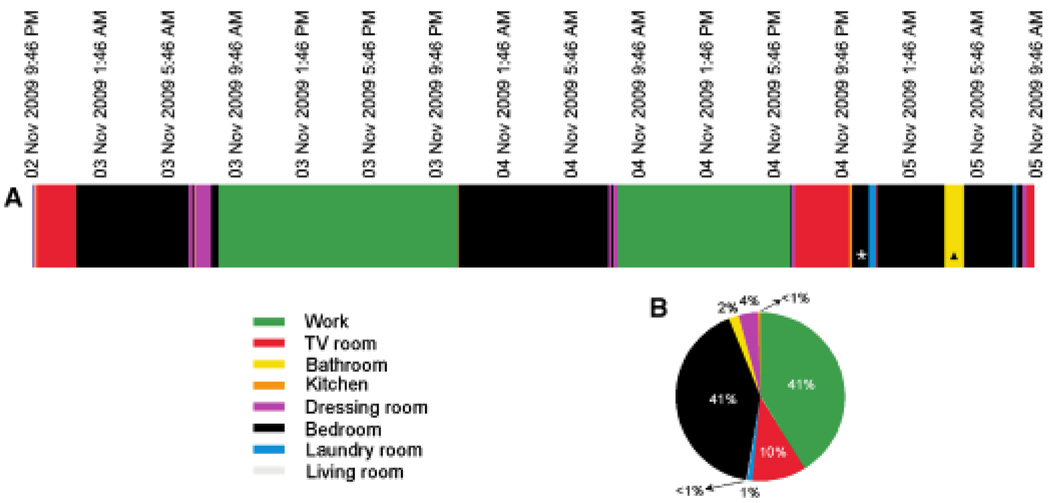
Measurements: Cellular telephones were used to detect in-home position and in-community location and to measure physical activity. Within the home, cellular telephones and Bluetooth transmitters (beacons) were used to locate participants at room-level resolution. Outside the home, the same cellular telephones and global positioning system (GPS) technology were used to locate participants at a community-level resolution. Physical activity was simultaneously measured using the cellular telephone accelerometer.

Results: This approach had face validity to measure activity and lifespace. More importantly, this system could measure the spatial and temporal organization of these metrics. For example, an individual's lifespace was automatically calculated across multiple time intervals. Behavioral time budgets showing how people allocate time to specific regions within the home were also automatically generated.

Conclusion: Mobile monitoring shows much promise as an easily deployed system to quantify activity and lifespace, important indicators of function, in community-dwelling adults.


Conflict of interest statement

Conflict of Interest: The editor in chief has reviewed the conflict of interest checklist provided by the authors and has determined that the authors have no financial or any other kind of personal conflicts with this paper.

Figures

Figure 1
Figure 1
Cellular telephone accelerometer has high face validity for measuring individual activity. (A) Magnitude of unprocessed signal from accelerometer as a function of time, matched to participant activities manually logged on diary; color and numerically coded per legend. Ethogram generated using participant log. (B) Accelerometer signal after passage through a 50-component finite impulse response filter. (C) Accelerometer signal from B integrated over consecutive 1-minute bins to determine activity counts. (D) Simultaneous activity counts measured using an ActiWatch-L. The cellular telephone–derived actimetry signal of C during epochs of low physical activity (7:50–9:00, 9:25–9:55, 9:55–11:25) has a higher face validity than the wristwatch actimeter signal of D. (E) Double-plot actogram of participant activity over 21-day observation period. Activity counts (depicted in green) calculated as described in the Methods section. Missing data depicted as breaks in the activity trace and account for approximately 8.4% (42.5 hours of the total 504 hours) observation. Dotted lines are at midnight Central Standard Time.
Figure 2
Figure 2
Simultaneous measurement of in-community location, physical activity, and geographic lifespace using cellular telephones. (A) Map depicting participant commute to work. Waypoints (in red) sampled every 60 seconds during trip. Coordinates mapped using www.gpsvisualizer.com. Numbers next to selected waypoints correspond to numbers in the time versus activity count graph at bottom. A selected expansion of the time immediately before waypoint 3 is provided in inset (A) and suggests that, for this participant, little accelerometer activity was detected during driving. (B) Upon arrival at the University of Nebraska Medical Center campus, the participant then walked around the campus. Again, waypoints (in blue) were sampled every 60 seconds during this trip. Inset (B), between waypoint 7 and 8, depicts the participant stopped at the corner of 42nd Street and Emile, waiting for the traffic light to change before crossing the street. Inset (C) was randomly chosen during a period of continuous ambulation and suggests the possibility of obtaining gait speed from this quasiperiodic unconditioned accelerometer trace. Tick marks on x and y axes for all insets are of the same magnitude and depict 0 to 3 g force for the y axis and 60 seconds of time for the x axis (across entire range). (C) Activity counts for the entire trip are shown in the time versus activity count graph and are cross-referenced to current weather conditions (obtained from http://www.wunderground.com, first from the Blair, NE, station, second from the nearest Omaha, NE, station). Second panel depicts in-community location over day (D), week (E), and month (F) interval measured using cellular telephones. Yellow outline shows the extent of geographic movement for each interval. The path in D is the participant commute from home to work (highlighted in A). The more-elaborate trip of E (depicted in yellow circles) occurred when the participant attended a conference in Ashland, Nebraska. The monthly lifespace also depicts a pleasure trip to central Nebraska to visit a colleague’s farm (green circles) and a trip with the spouse to Council Bluffs, Iowa (red circles). (G) Probability density graph for 1 month in community location. The two largest peaks correspond to the participant’s home and place of work. The probability density representation is one way of quantifying the geographic aspect of lifespace while providing complete anonymity for the participant. (H) Continuous measurement of lifespace scores as determined from in-community locations. Scores calculated using Lifespace Questionnaire. Because lifespace scores determined using this method assess mobility over the past week, only 3 weeks of scores were determined from 1 month of data. The decrease in lifespace score noted from November 24, 2009, reflects the onset of the Thanksgiving holiday, during which the participant did not commute outside of the immediate home neighborhood.
Figure 3
Figure 3
Simultaneous activity and Bluetooth location sensing to study organization of indoor activities. (A) Timeline reveals 2 representative days of data collected using Bluetooth beacons and cellular telephone. Legend as above. This automated approach captured 1 day on which the participant came home late after a work-related meeting. *An at-home routine during which the participant reads in bed with his spouse and then returns to work is also captured. (B) Pie chart shows time budget for this period of observation. Time budget value determined from in-home positioning data provided by Bluetooth beacons and cellular telephone.

References

    1. Munneke M, de Jong Z, Zwinderman AH, et al. The value of a continuous ambulatory activity monitor to quantify the amount and intensity of daily activity in patients with rheumatoid arthritis. J Rheumatol. 2001;28:745–750. - PubMed
    1. Hobbs FB, Damon BL. U.S Bureau of the Census CPR, Special Studies. Washington, DC: U.S. Government Printing Office; 1996. 65+ in the United States. pp. 23–190.
    1. Kinsella K. Urban and rural dimensions of global population aging: An overview. J Rural Health. 2001;17:314–322. - PubMed
    1. Tabloski PA. Global aging: Implications for women and women’s health. J Obstet Gynecol Neonatal Nurs. 2004;33:627–638. - PubMed
    1. Katz S, Stroud MW., III Functional assessment in geriatrics. A review of progress and directions. J Am Geriatr Soc. 1989;37:267–271. - PubMed

Publication types

LinkOut - more resources