Structures of human Golgi-resident glutaminyl cyclase and its complexes with inhibitors reveal a large loop movement upon inhibitor binding
- PMID: 21288892
- PMCID: PMC3069447
- DOI: 10.1074/jbc.M110.208595
Structures of human Golgi-resident glutaminyl cyclase and its complexes with inhibitors reveal a large loop movement upon inhibitor binding
Abstract
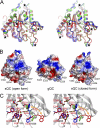
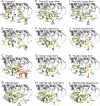
Aberrant pyroglutamate formation at the N terminus of certain peptides and proteins, catalyzed by glutaminyl cyclases (QCs), is linked to some pathological conditions, such as Alzheimer disease. Recently, a glutaminyl cyclase (QC) inhibitor, PBD150, was shown to be able to reduce the deposition of pyroglutamate-modified amyloid-β peptides in brain of transgenic mouse models of Alzheimer disease, leading to a significant improvement of learning and memory in those transgenic animals. Here, we report the 1.05-1.40 Å resolution structures, solved by the sulfur single-wavelength anomalous dispersion phasing method, of the Golgi-luminal catalytic domain of the recently identified Golgi-resident QC (gQC) and its complex with PBD150. We also describe the high-resolution structures of secretory QC (sQC)-PBD150 complex and two other gQC-inhibitor complexes. gQC structure has a scaffold similar to that of sQC but with a relatively wider and negatively charged active site, suggesting a distinct substrate specificity from sQC. Upon binding to PBD150, a large loop movement in gQC allows the inhibitor to be tightly held in its active site primarily by hydrophobic interactions. Further comparisons of the inhibitor-bound structures revealed distinct interactions of the inhibitors with gQC and sQC, which are consistent with the results from our inhibitor assays reported here. Because gQC and sQC may play different biological roles in vivo, the different inhibitor binding modes allow the design of specific inhibitors toward gQC and sQC.
Figures


Similar articles
-
Structural and functional analyses of a glutaminyl cyclase from Ixodes scapularis reveal metal-independent catalysis and inhibitor binding.Acta Crystallogr D Biol Crystallogr. 2014 Mar;70(Pt 3):789-801. doi: 10.1107/S1399004713033488. Epub 2014 Feb 22. Acta Crystallogr D Biol Crystallogr. 2014. PMID: 24598748 Free PMC article.
-
Human glutaminyl cyclase: Structure, function, inhibitors and involvement in Alzheimer's disease.Pharmacol Res. 2019 Sep;147:104342. doi: 10.1016/j.phrs.2019.104342. Epub 2019 Jul 6. Pharmacol Res. 2019. PMID: 31288079 Review.
-
X-ray Structure-Guided Discovery of a Potent Benzimidazole Glutaminyl Cyclase Inhibitor That Shows Activity in a Parkinson's Disease Mouse Model.J Med Chem. 2024 Jun 13;67(11):8730-8756. doi: 10.1021/acs.jmedchem.4c00049. Epub 2024 May 31. J Med Chem. 2024. PMID: 38817193
-
Glutaminyl cyclases, the potential targets of cancer and neurodegenerative diseases.Eur J Pharmacol. 2022 Sep 15;931:175178. doi: 10.1016/j.ejphar.2022.175178. Epub 2022 Aug 7. Eur J Pharmacol. 2022. PMID: 35948163 Review.
-
Exploring the binding mode of PQ912 against secretory glutaminyl cyclase through systematic exploitation of conformational ensembles.Chem Biol Drug Des. 2021 Nov;98(5):850-856. doi: 10.1111/cbdd.13940. Epub 2021 Sep 15. Chem Biol Drug Des. 2021. PMID: 34423556
Cited by
-
Structural and functional analyses of a glutaminyl cyclase from Ixodes scapularis reveal metal-independent catalysis and inhibitor binding.Acta Crystallogr D Biol Crystallogr. 2014 Mar;70(Pt 3):789-801. doi: 10.1107/S1399004713033488. Epub 2014 Feb 22. Acta Crystallogr D Biol Crystallogr. 2014. PMID: 24598748 Free PMC article.
-
A class of benzofuranoindoline-bearing heptacyclic fungal RiPPs with anticancer activities.Nat Chem Biol. 2025 Jun 23. doi: 10.1038/s41589-025-01946-9. Online ahead of print. Nat Chem Biol. 2025. PMID: 40551021
-
Linked production of pyroglutamate-modified proteins via self-cleavage of fusion tags with TEV protease and autonomous N-terminal cyclization with glutaminyl cyclase in vivo.PLoS One. 2014 Apr 14;9(4):e94812. doi: 10.1371/journal.pone.0094812. eCollection 2014. PLoS One. 2014. PMID: 24733552 Free PMC article.
-
The soluble Y115E-Y117E variant of human glutaminyl cyclase is a valid target for X-ray and NMR screening of inhibitors against Alzheimer disease.Acta Crystallogr F Struct Biol Commun. 2015 Aug;71(Pt 8):986-92. doi: 10.1107/S2053230X15010389. Epub 2015 Jul 28. Acta Crystallogr F Struct Biol Commun. 2015. PMID: 26249687 Free PMC article.
-
Piperine Increases Pentagamavunon-1 Anti-cancer Activity on 4T1 Breast Cancer Through Mitotic Catastrophe Mechanism and Senescence with Sharing Targeting on Mitotic Regulatory Proteins.Iran J Pharm Res. 2022 Feb 4;21(1):e123820. doi: 10.5812/ijpr.123820. eCollection 2022 Dec. Iran J Pharm Res. 2022. PMID: 35765510 Free PMC article.
References
-
- Goren H. J., Bauce L. G., Vale W. (1977) Mol. Pharmacol. 13, 606–614 - PubMed
-
- Van Coillie E., Proost P., Van Aelst I., Struyf S., Polfliet M., De Meester I., Harvey D. J., Van Damme J., Opdenakker G. (1998) Biochemistry 37, 12672–12680 - PubMed
-
- Schilling S., Manhart S., Hoffmann T., Ludwig H. H., Wasternack C., Demuth H. U. (2003) Biol. Chem. 384, 1583–1592 - PubMed
-
- Huang K. F., Wang Y. R., Chang E. C., Chou T. L., Wang A. H. (2008) Biochem. J. 411, 181–190 - PubMed
Publication types
MeSH terms
Substances
Associated data
- Actions
- Actions
- Actions
- Actions
- Actions
- Actions
LinkOut - more resources
Full Text Sources
Other Literature Sources
Chemical Information
Molecular Biology Databases

