. 2011 Apr 8;286(14):12590-601.
doi: 10.1074/jbc.M110.203604. Epub 2011 Feb 1.

PDE4D and PDE4B function in distinct subcellular compartments in mouse embryonic fibroblasts

Affiliations

PDE4D and PDE4B function in distinct subcellular compartments in mouse embryonic fibroblasts

Brigitte E Blackman et al. J Biol Chem. .

Abstract

Signaling through cAMP regulates most cellular functions. The spatiotemporal control of cAMP is, therefore, crucial for differential regulation of specific cellular targets. Here we investigated the consequences of PDE4B or PDE4D gene ablation on cAMP signaling at a subcellular level using mouse embryonic fibroblasts. PDE4B ablation had no effect on the global or bulk cytosol accumulation of cAMP but increased both basal and hormone-dependent cAMP in a near-membrane pool. Conversely, PDE4D ablation enhanced agonist-induced cAMP accumulation in the bulk cytosol as well as at the plasma membrane. Both PDE4B and PDE4D ablation significantly modified the time course and the level of isoproterenol-induced phosphorylation of vasodilator-stimulated phosphoprotein, a membrane cytoskeletal component. A second membrane response through Toll-like receptor signaling, however, was only affected by PDE4B ablation. PDE4D but not PDE4B ablation significantly prolonged cAMP-response element-binding protein-mediated transcription. These findings demonstrate that PDE4D and PDE4B have specialized functions in mouse embryonic fibroblasts with PDE4B controlling cAMP in a discrete subdomain near the plasma membrane.


Figures

FIGURE 1.
FIGURE 1.
Characterization of Epac2 cAMP sensors. A and B, WT MEFs were transduced with adenoviral constructs encoding either cytEpac2 (A) or pmEpac2 (B). Scale bar, 10 μm. C, in vitro dose-response curves of Epac2 sensors expressed in HEK293 cells. Changes in FRET (ΔCFP/YFP) responses to cAMP were measured using a SpectraMax fluorometer. Data represent the mean ± S.E., and normalized data were analyzed using sigmoidal dose response (variable slope) (n ≥ 9). D, WT MEFs transduced with cytEpac2 or pmEpac2 were incubated with IBMX (100 μm) and forskolin (50 μm), and the maximum decrease in FRET was calculated. Data represent mean ± S.E. from four or more experiments. Error bars, S.E.; **, p < 0.01.
FIGURE 2.
FIGURE 2.
cAMP accumulation in wild type and PDE4 KO MEFs stimulated with Iso. A, MEFs deficient in PDE4B or PDE4D as well as wild type controls were incubated for the indicated times with 10 nm Iso. The cell culture medium was then aspirated, and incubations were terminated by the addition of 0.1% TCA in 95% ethanol. Cyclic AMP concentration in the resulting extracts was measured by RIA. B and C, MEFs transduced with cytEpac2 (B) or pmEpac2 (C) were incubated for the indicated times with 10 nm Iso. The percent decrease in FRET relative to basal (%ΔF) was determined. D, the cAMP response to 10 nm Iso treatment for MEFs expressing either cytEpac2 or pmEpac2 expressed as the area under the curve (AUC). Data were analyzed using the unpaired t test; **, p < 0.01; ***, p < 0.0001. Data represent mean ± S.E. In B and C, the number of cells analyzed (n) is given and summarizes data from four or more experiments. Error bars, S.E.
FIGURE 3.
FIGURE 3.
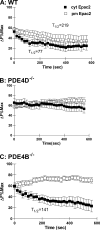
Decay of cAMP response following Iso stimulation. A, B, and C, WT (A) and MEFs deficient in PDE4D (B) or PDE4B (C) expressing either cytEpac2 (■) or pmEpac2 (□) were incubated with 10 nm Iso. Data are expressed as a percentage of the maximum response for cytEpac2 and pmEpac2 in cells treated with IBMX and forskolin (see Fig. 1C). Where possible, the half-time (t½) to return to a new steady state level of cAMP concentration was calculated using exponential decay analysis from the maximal Iso response. Error bars, S.E.
FIGURE 4.
FIGURE 4.
cAMP levels in PDE4B- and PDE4D-null MEFs stimulated with 100 nm PGE2. A, cells were incubated for the indicated times with 100 nm PGE2, and cAMP concentration in the cell extracts was measured by RIA. The graph reports the mean ± S.E. of three separate experiments. B and C, MEFs transduced with cytEpac2 (B) or pmEpac2 (C) were incubated for the indicated times with 100 nm PGE2, and the percent change in FRET (%ΔF) was calculated. In each case, the cell number (n) is given. D, the cAMP response to 100 nm PGE2 treatment for MEFs expressing either cytEpac2 or pmEpac2 expressed as the area under the curve (AUC). Data were analyzed using the unpaired t test; ***, p < 0.0001 (WT versus PDE4B−/− and PDE4D−/−; pmEpac2); *, p = 0.0113 (WT versus PDE4D−/−; cytEpac2) and p = 0.604 (WT versus PDE4B−/−; cytEpac2). Data represent mean ± S.E. Error bars, S.E.
FIGURE 5.
FIGURE 5.
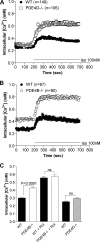
PDE4B and PDE4D control a pool of cAMP in vicinity of CNG channels. Calcium influx in MEFs expressing the modified olfactory CNG channel (C460W/E583M) was measured to determine the effect of PDE4 variant ablation on cAMP accumulation in response to 100 nm Iso treatment. Intracellular calcium ([Ca2+]i) concentration was measured by ratiometric fura-2 fluorescence and is proportional to the local concentration of cAMP. A and B, knock-out of either PDE4D (A) or PDE4B (B) caused an increase in the membrane-associated cAMP accumulation in response to Iso stimulation. The number of individual cells analyzed (n) is given for each MEF cell culture. C, cells were untreated for basal measurements or treated with rolipram (Rol) (10 μm) for 15 min. The graphs report the mean ± S.E. of at least four separate experiments. Error bars, S.E.
FIGURE 6.
FIGURE 6.
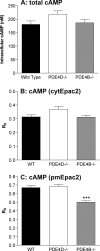
Global, cytosolic, and plasma membrane-associated basal cAMP concentrations. A, comparison of basal global cAMP levels in the three cell types as measured by RIA. B and C, the basal FRET over donor ratio (R0) for cells transduced with cytEpac2 (B) or pmEpac2 (C) was calculated to determine the relative basal cAMP concentrations. A decrease in R0 reflects an increase in cAMP. Data were analyzed using the unpaired t test; ***, p < 0.0001. The graphs report the mean ± S.E. of three or more separate experiments. Error bars, S.E.
FIGURE 7.
FIGURE 7.
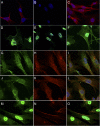
PDE4D staining is punctate and cytoplasmic, whereas PDE4B staining is cytoplasmic and membrane-localized with nonspecific staining in nucleus. A, B, and C, Aanti-PDE4D staining of WT (A) as well as PDE4D- (B) and PDE4B-deficient (C) MEFs. D, E, and F, anti-PDE4B staining of WT (D), PDE4B- (E), and PDE4D (F)-deficient MEFs. G, H, and I, anti-calreticulin (endoplasmic reticulum marker) staining (G) and anti-PDE4D staining (H) show minimal colocalization (I, overlay). J, K, and L, anti-syntaxin (Golgi marker) staining (J) and anti-PDE4D staining (K) show limited colocalization (L, overlay). M, N, and O, PDE4B (M) staining colocalizes with phalloidin (N) showing some localization to actin cortical filaments (O, overlay). Scale bar, 10 μm.
FIGURE 8.
FIGURE 8.
Ablation of PDE4D but not PDE4B increases CREB-dependent transcription. Wild type, PDE4D−/−, and PDE4B−/− MEFs were transduced with CRE-luciferase reporter lentivirus. After 72 h, the cells were treated with or without 10 μm Iso and lysed 20 h later, and luciferase activity was measured. The transduction was performed two times in triplicate. Activity was corrected for GFP expression. n.s., not significant; RLU, relative luciferase units. Error bars, S.E.; *, p < 0.05.
FIGURE 9.
FIGURE 9.
Iso-dependent VASP phosphorylation of PDE4-null MEFs. MEFs deficient in PDE4B (4B) and PDE4D (4D) along with wild type controls were stimulated with Iso for the times indicated and then harvested in SDS buffer containing phosphatase inhibitors. Equal amounts of protein were separated by SDS-PAGE, and Western blotting was performed using an antibody against phosphorylated Ser-157 of VASP. A, representative blot showing the time course of phosphorylated VASP detection in MEFs stimulated with 100 nm Iso in the indicated genotypes. B, quantification of VASP phosphorylation time course as a ratio of maximum wild type signal. C, representative blot showing the increased Ser-157 phosphorylation in response to increasing concentrations of Iso after 3 min of stimulation. D, quantification of the Iso dose response. Data were corrected for loading with tubulin and represent the mean ± S.E. of four experiments. EC50 values are as follows: WT, 5.57 ± 2.36 nm; PDE4B−/−, 1.54 ± 1.85 nm and PDE4D−/−, 1.74 ± 2.50 nm (mean ± S.E.; n = 4). Error bars, S.E.
FIGURE 10.
FIGURE 10.
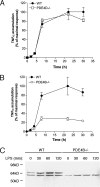
PDE4B expression increases following LPS treatment and is required for LPS-induced TNFα accumulation. A and B, TNFα accumulation in response to LPS stimulation is unaffected in PDE4D-null MEFs (A) and reduced in PDE4B-null MEFs (B). C, Western blot with anti-PDE4B antibodies using whole cell extracts from LPS-treated wild type and PDE4B−/− MEFs. Error bars, S.E.
FIGURE 11.
FIGURE 11.
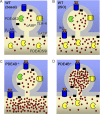
Schematic model of PDE4B and PDE4D cellular distribution and resulting pattern of cAMP accumulation. A, B, C, and D, cyclic AMP distribution in WT MEFs with no stimulation (A) and following Iso stimulation in WT (B), PDE4D−/− (C), and PDE4B−/− (D) MEFs. PDE4B is localized to a small portion of the cell membrane (<2% of the total cell volume). This compartment has limited equilibration with the cytosol. AR, adrenergic receptor.

Similar articles

Cited by

References

    1. Rich T. C., Fagan K. A., Tse T. E., Schaack J., Cooper D. M., Karpen J. W. (2001) Proc. Natl. Acad. Sci. U.S.A. 98, 13049–13054 - PMC - PubMed
    1. Beavo J. A., Bechtel P. J., Krebs E. G. (1974) Proc. Natl. Acad. Sci. U.S.A. 71, 3580–3583 - PMC - PubMed
    1. Rich T. C., Xin W., Mehats C., Hassell K. A., Piggott L. A., Le X., Karpen J. W., Conti M. (2007) Am. J. Physiol. Cell Physiol. 292, C319–C331 - PMC - PubMed
    1. Barnes A. P., Livera G., Huang P., Sun C., O'Neal W. K., Conti M., Stutts M. J., Milgram S. L. (2005) J. Biol. Chem. 280, 7997–8003 - PubMed
    1. Jurevicius J., Fischmeister R. (1996) Proc. Natl. Acad. Sci. U.S.A. 93, 295–299 - PMC - PubMed

Publication types

MeSH terms

Substances

LinkOut - more resources