. 2011 May;300(5):F1180-92.
doi: 10.1152/ajprenal.00353.2010. Epub 2011 Feb 2.

Bardoxolone methyl (BARD) ameliorates ischemic AKI and increases expression of protective genes Nrf2, PPARγ, and HO-1

Affiliations

Bardoxolone methyl (BARD) ameliorates ischemic AKI and increases expression of protective genes Nrf2, PPARγ, and HO-1

Qing Qing Wu et al. Am J Physiol Renal Physiol. 2011 May.

Abstract

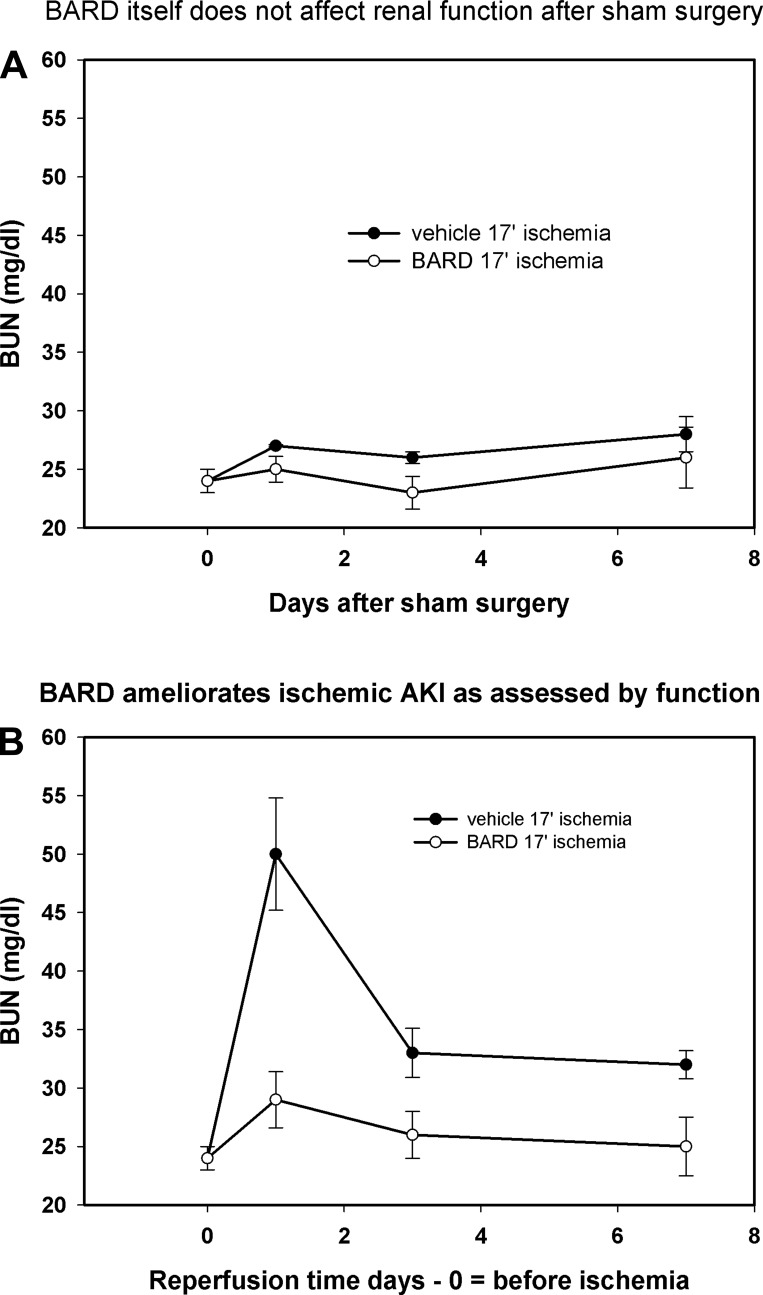
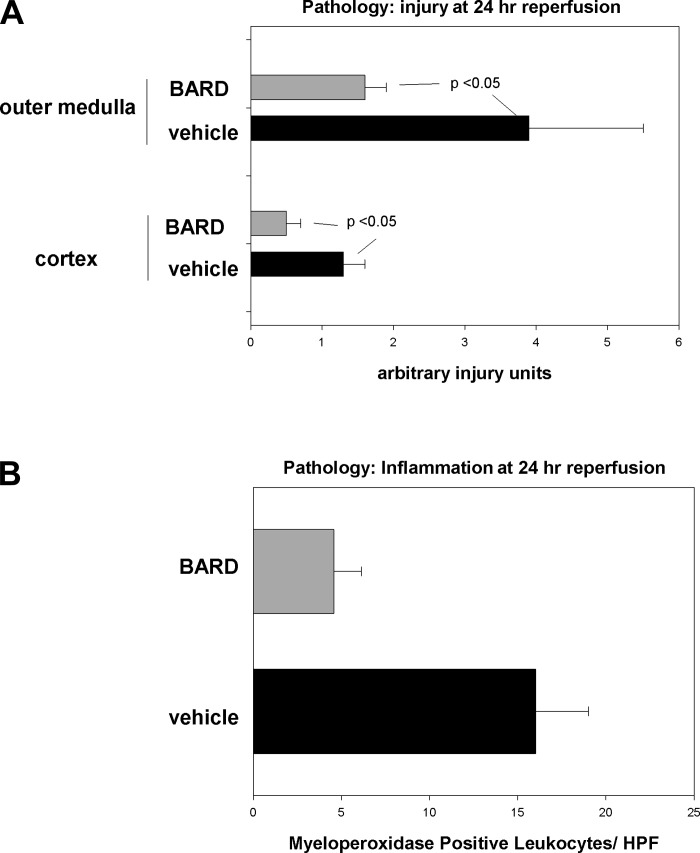
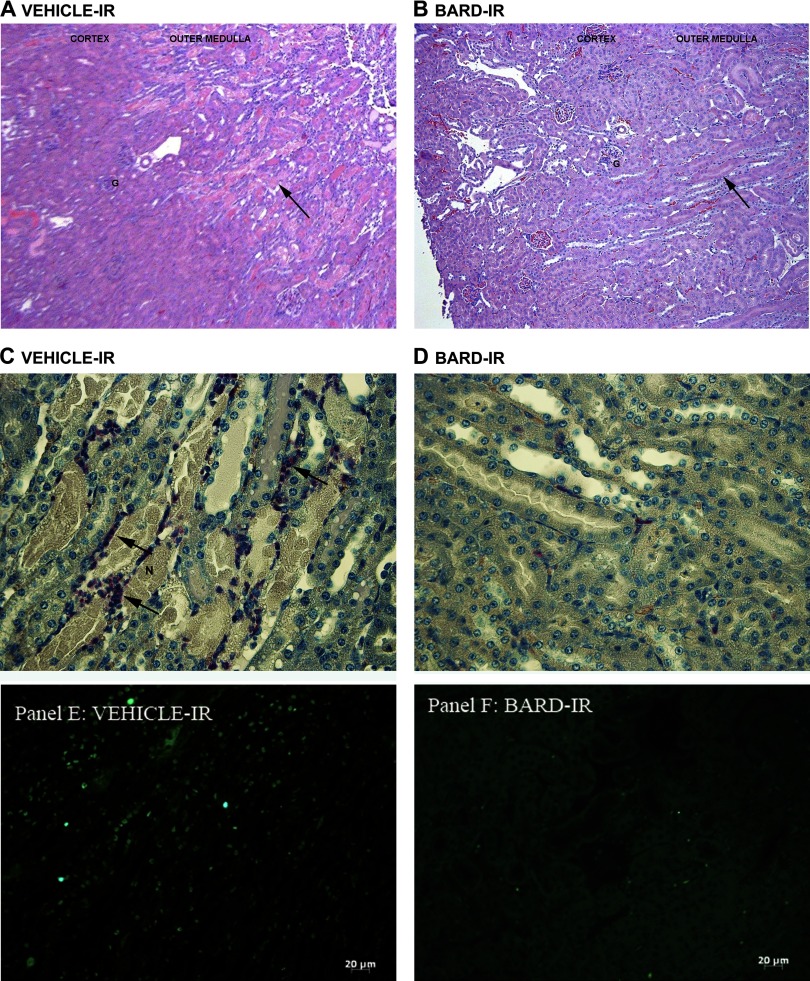
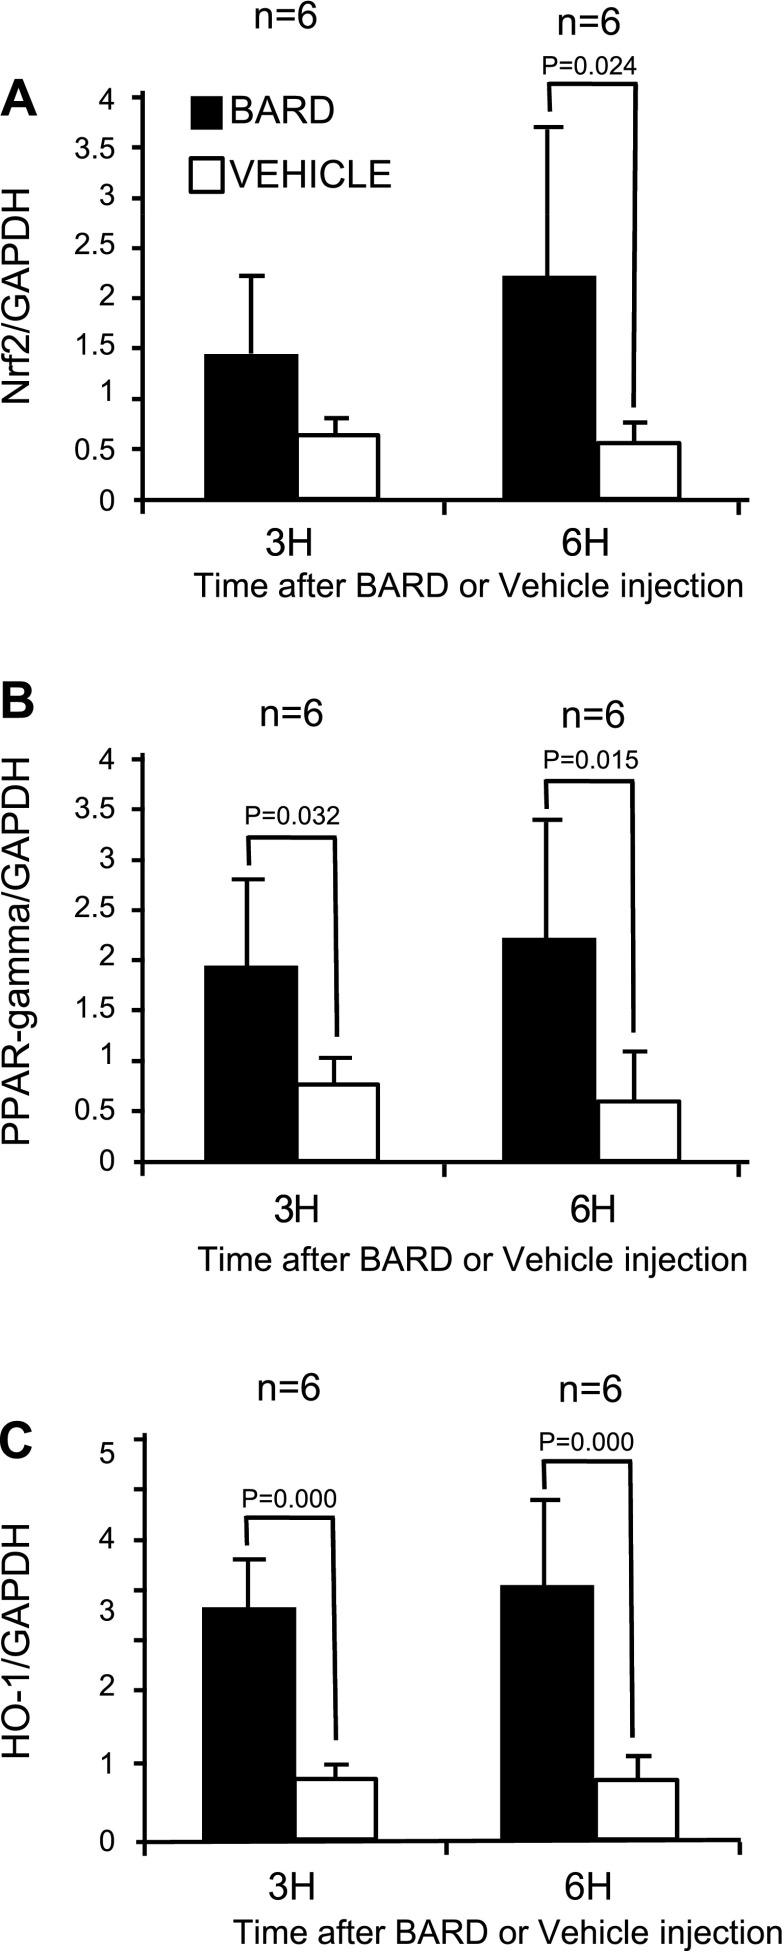
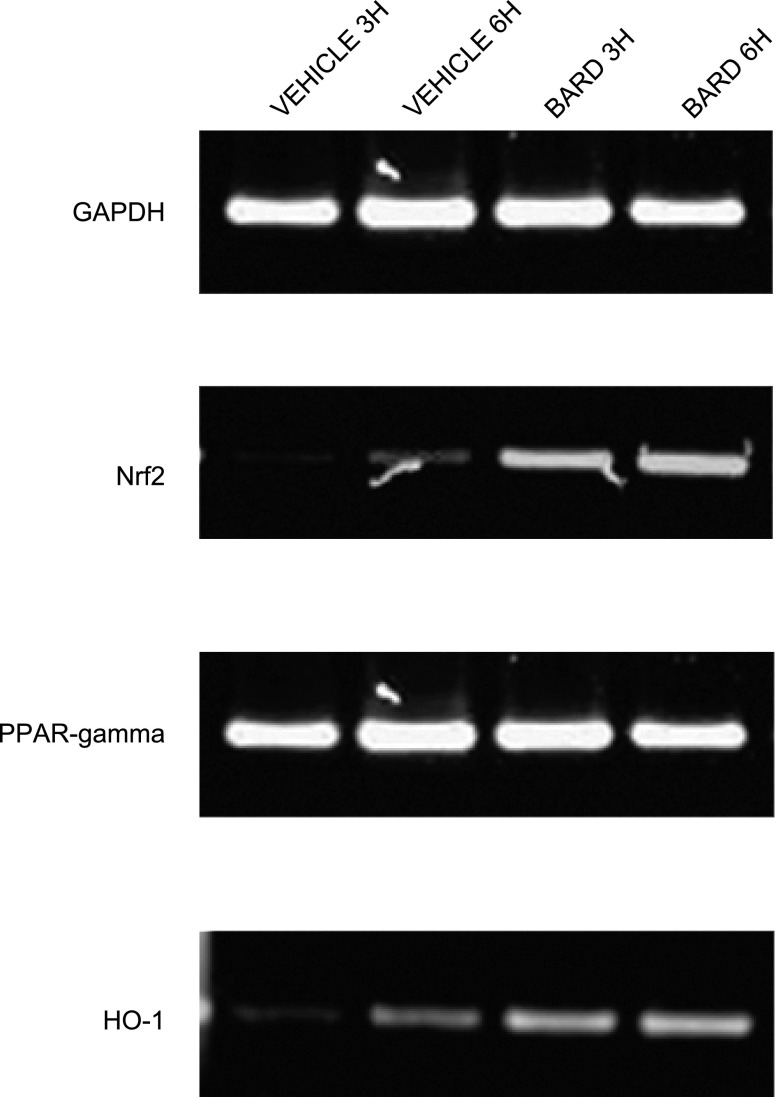
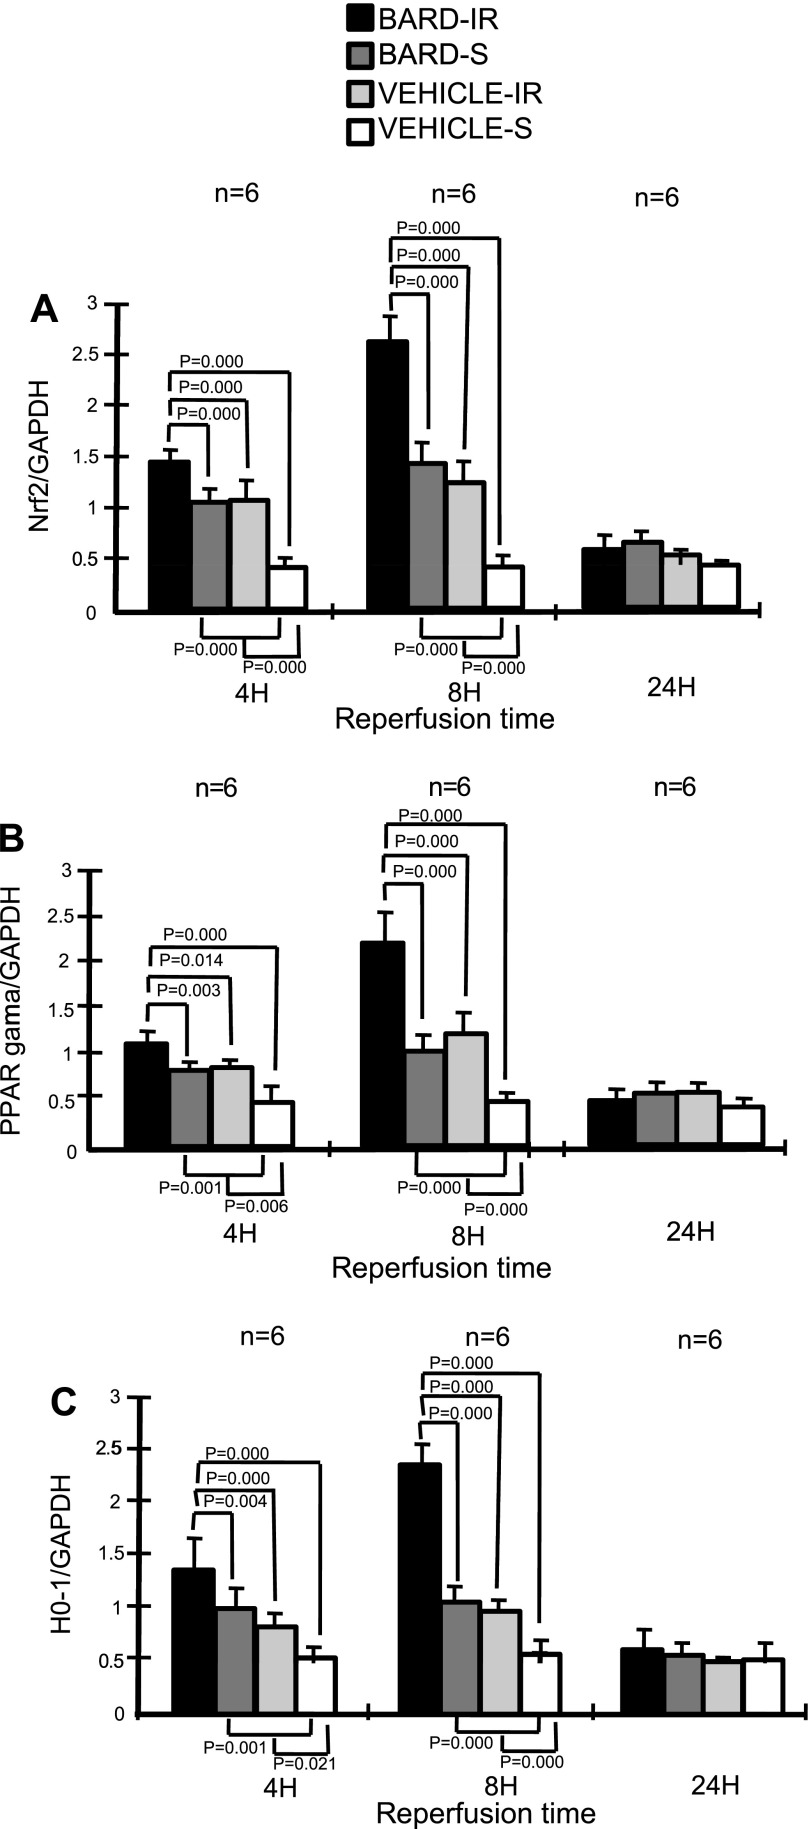
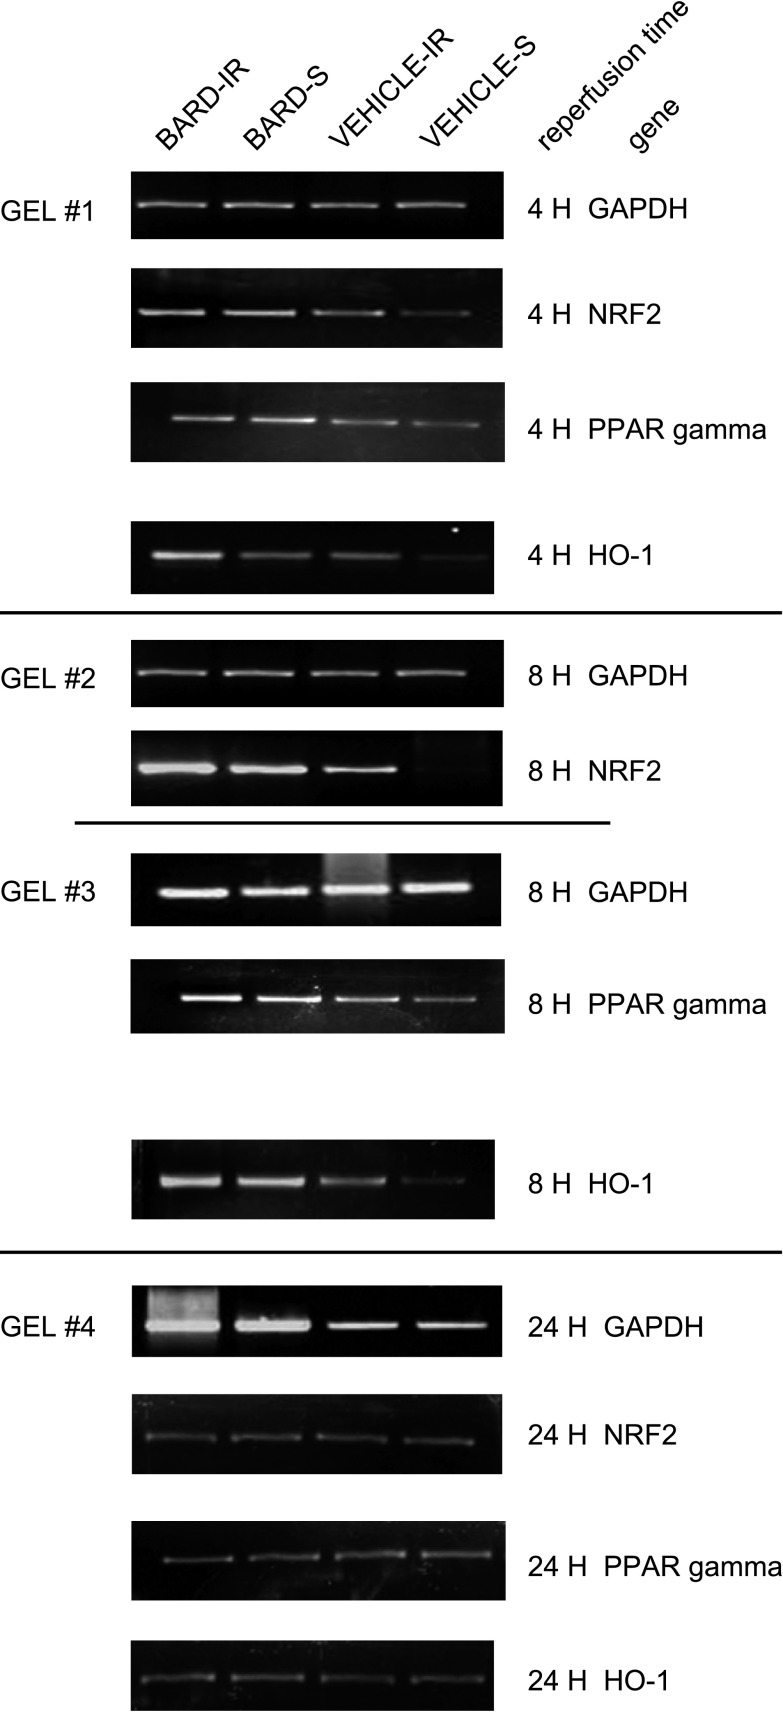
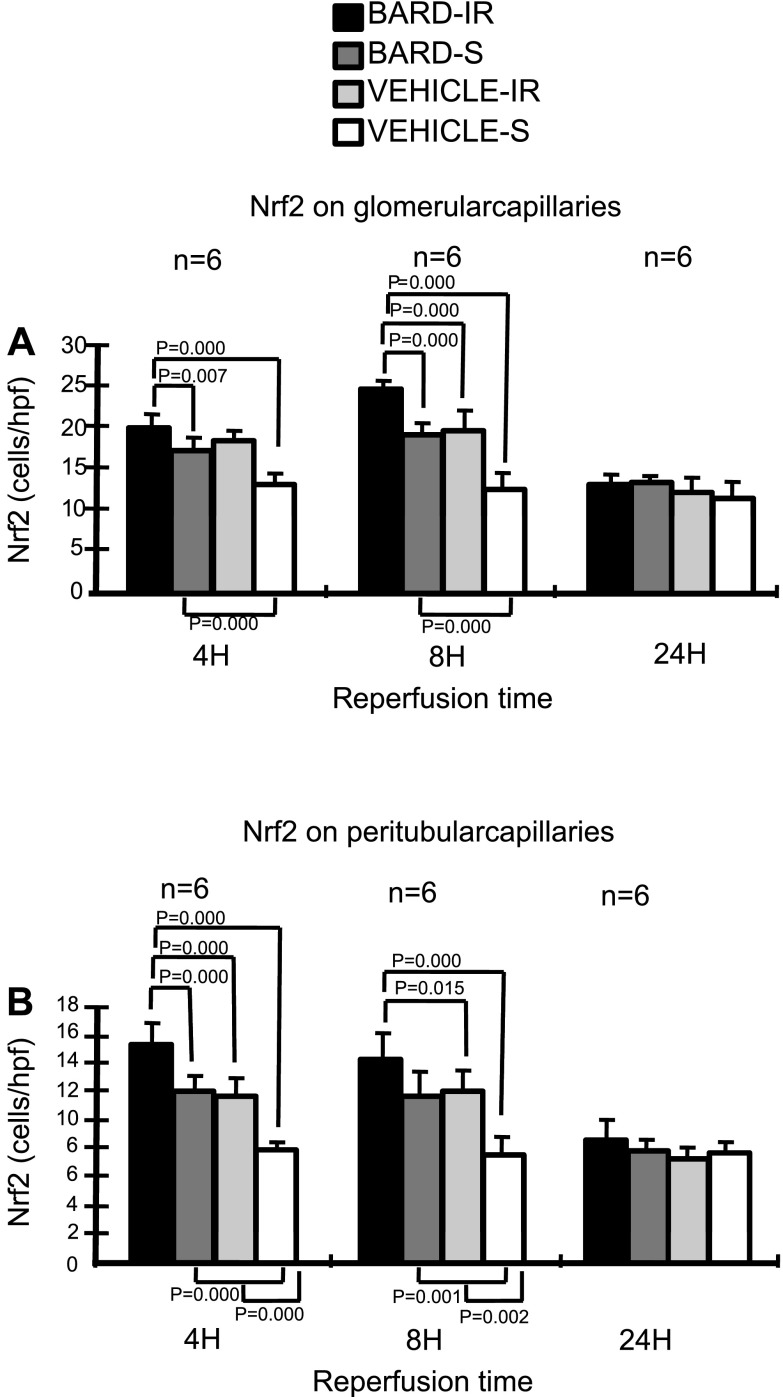
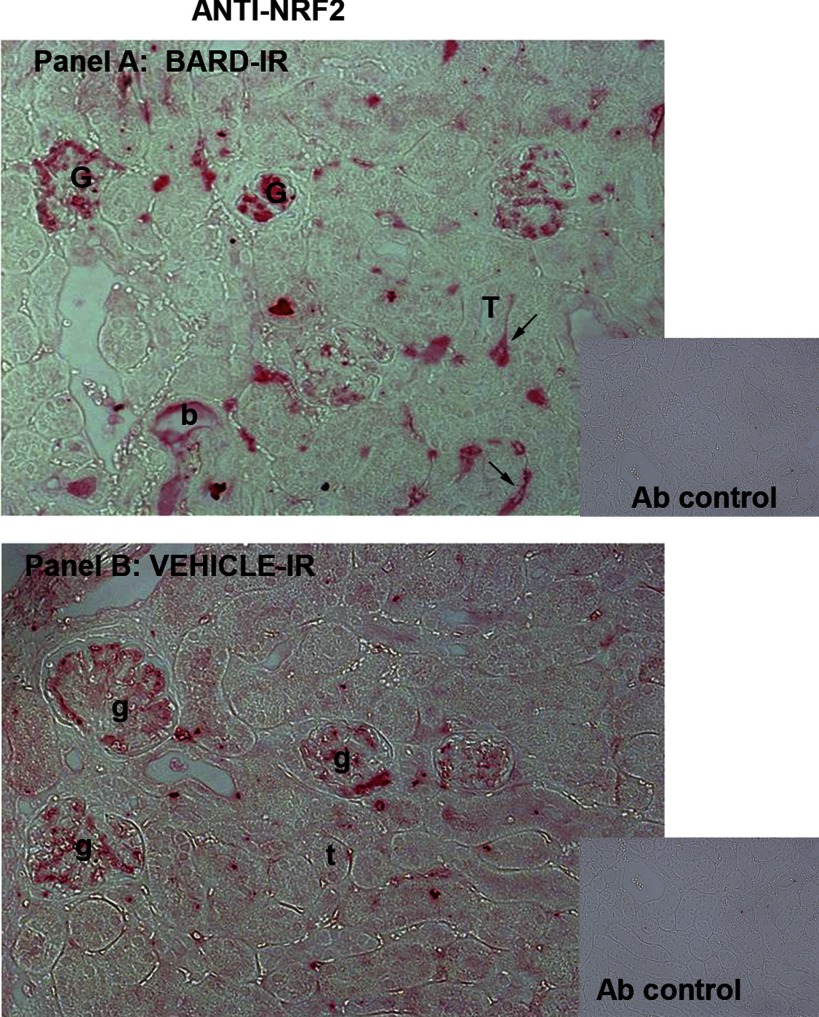
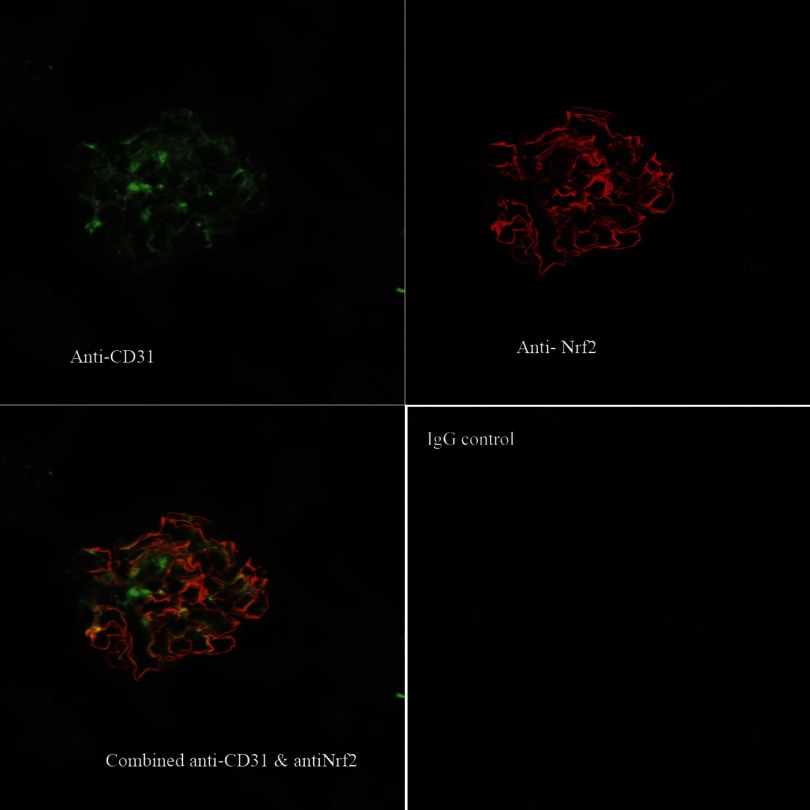
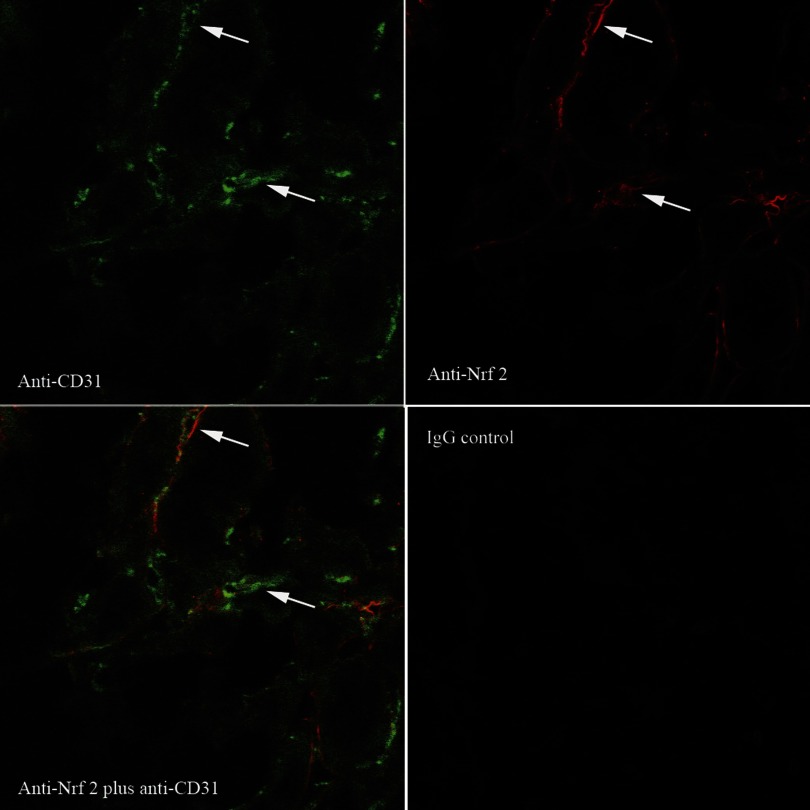
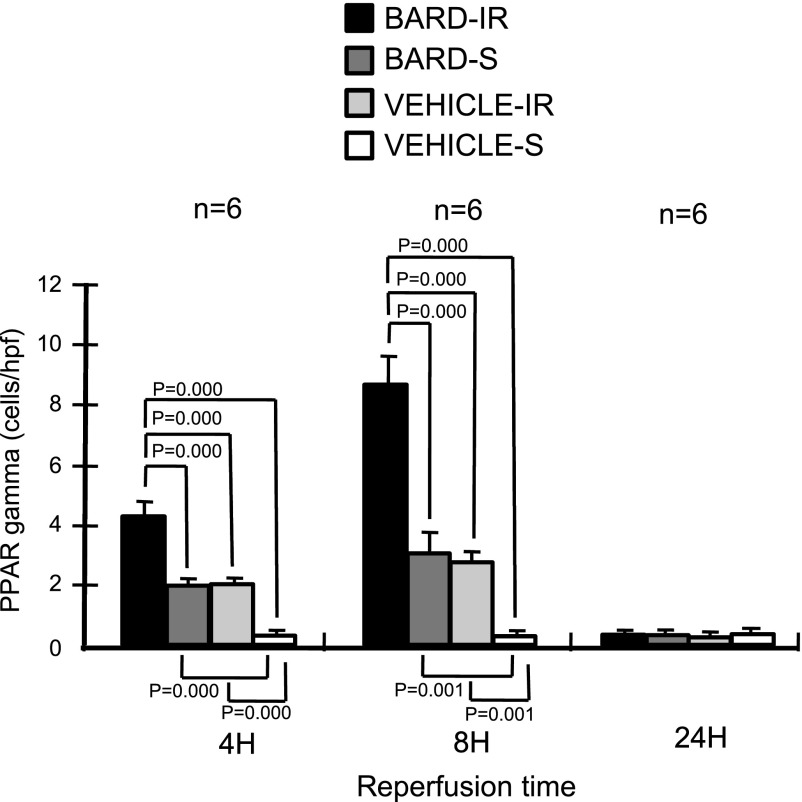
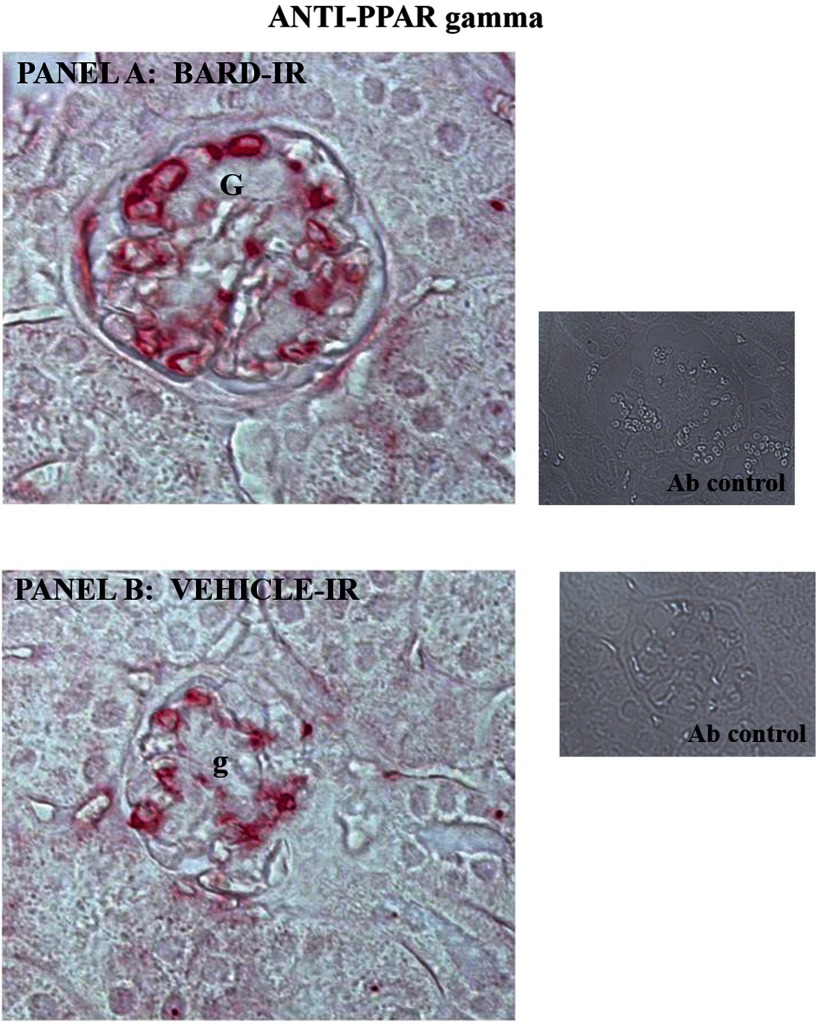
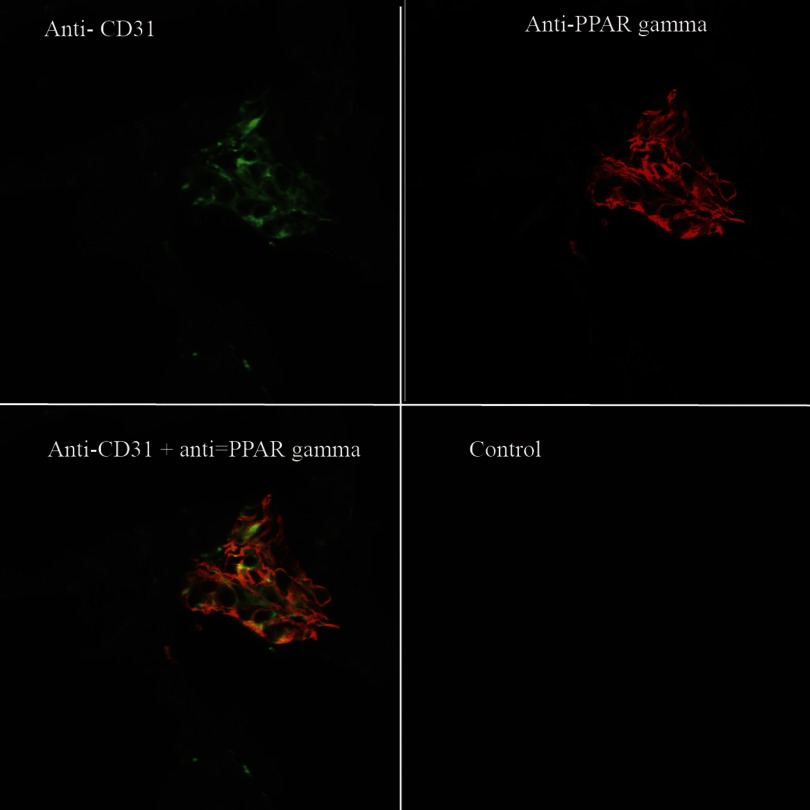
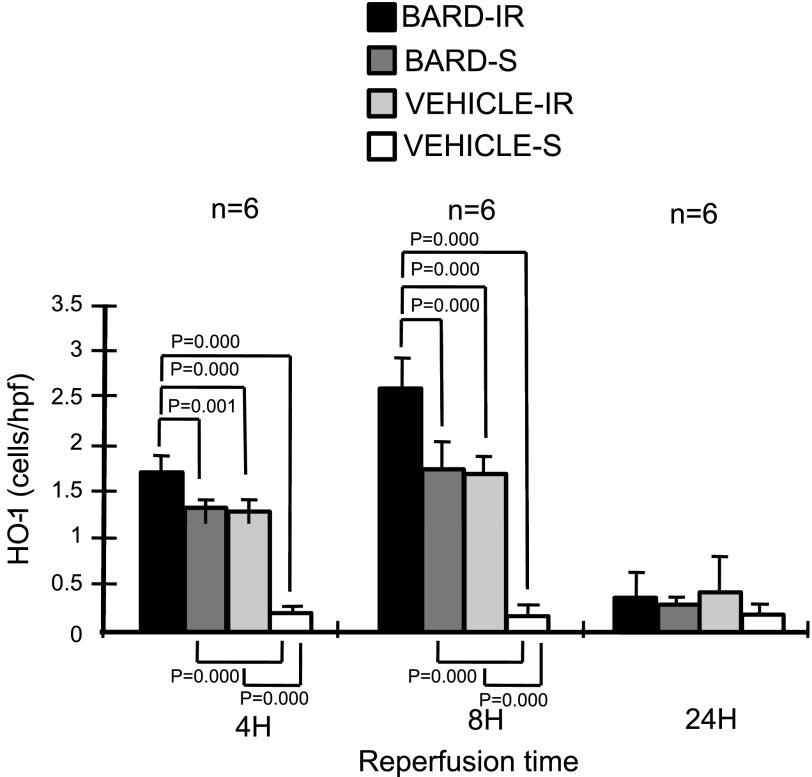
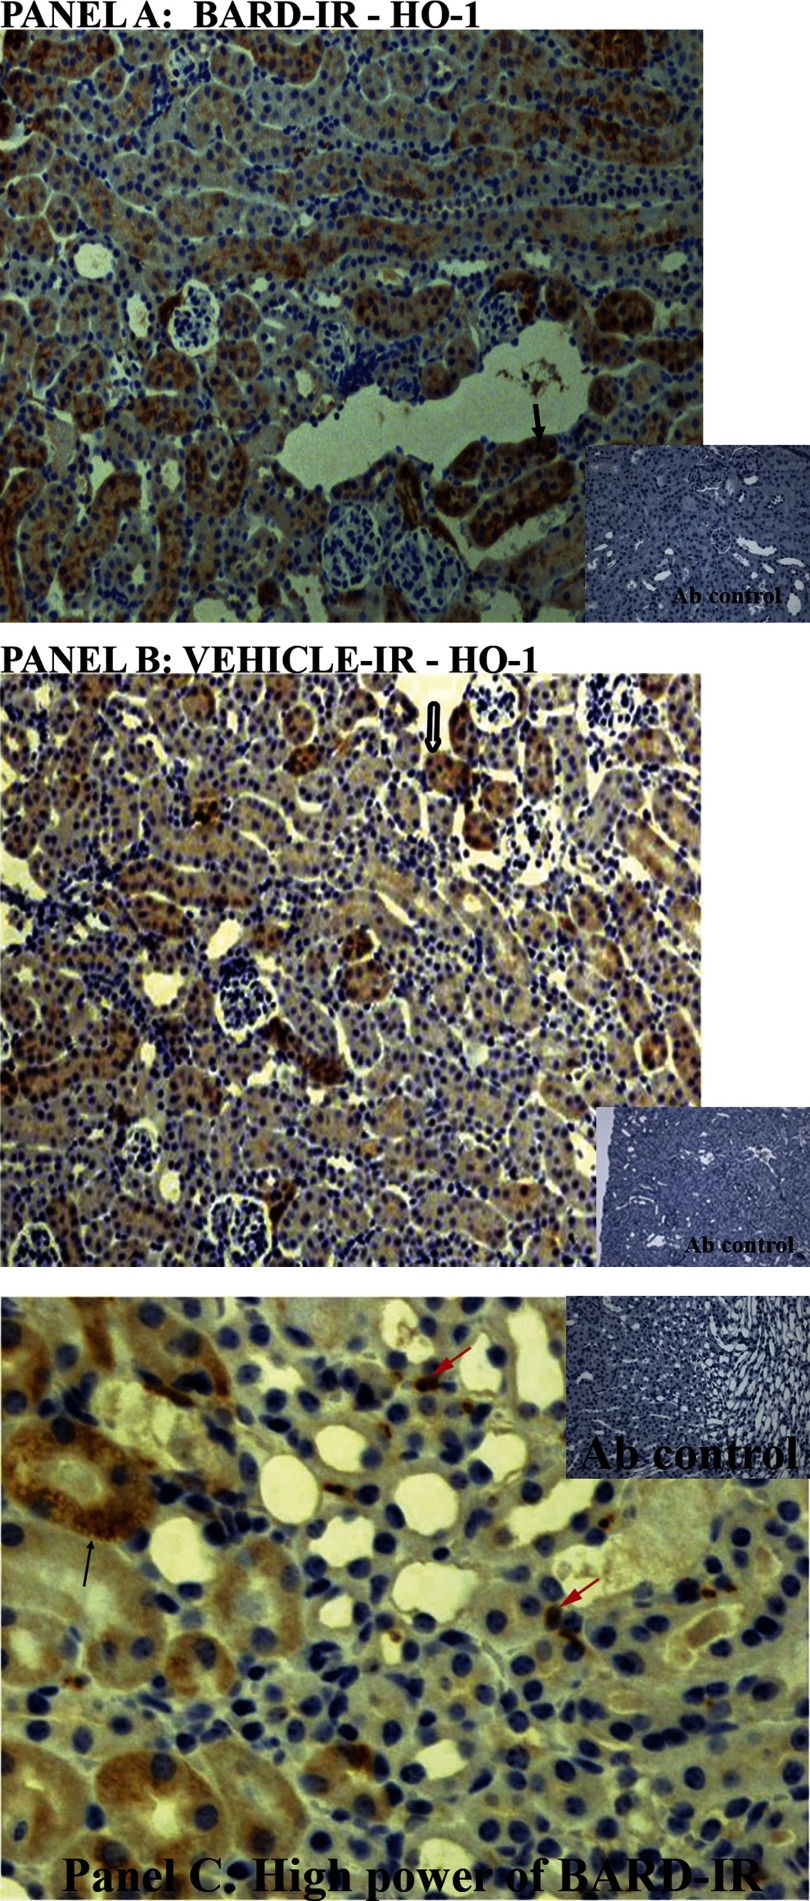
Ischemic acute kidney injury (AKI) triggers expression of adaptive (protective) and maladaptive genes. Agents that increase expression of protective genes should provide a therapeutic benefit. We now report that bardoxolone methyl (BARD) ameliorates ischemic murine AKI as assessed by both renal function and pathology. BARD may exert its beneficial effect by increasing expression of genes previously shown to protect against ischemic AKI, NF-E2-related factor 2 (Nrf2), peroxisome proliferator-activated receptor-γ (PPARγ), and heme oxygenase 1 (HO-1). Although we found that BARD alone or ischemia-reperfusion alone increased expression of these genes, the greatest increase occurred after the combination of both ischemia-reperfusion and BARD. BARD had a different mode of action than other agents that regulate PPARγ and Nrf2. Thus we report that BARD regulates PPARγ, not by acting as a ligand but by increasing the amount of PPARγ mRNA and protein. This should increase ligand-independent effects of PPARγ. Similarly, BARD increased Nrf2 mRNA; this increased Nrf2 protein by mechanisms in addition to the prolongation of Nrf2 protein half-life previously reported. Finally, we localized expression of these protective genes after ischemia and BARD treatment. Using double-immunofluorescence staining for CD31 and Nrf2 or PPARγ, we found increased Nrf2 and PPARγ on glomerular endothelia in the cortex; Nrf2 was also present on cortical peritubular capillaries. In contrast, HO-1 was localized to different cells, i.e., tubules and interstitial leukocytes. Although Nrf2-dependent increases in HO-1 have been described, our data suggest that BARD's effects on tubular and leukocyte HO-1 during ischemic AKI may be Nrf2 independent. We also found that BARD ameliorated cisplatin nephrotoxicity.


Figures

Fig. 1.
Fig. 1.
Bardoxolone methyl (BARD) and renal function of normal vs. ischemic kidneys. A: BARD itself did not affect renal function after sham surgery. BARD, 2 mg/kg bid, was started 48 h before sham surgery (day 0) and continued for 7 days. Sham surgery was a right nephrectomy, dissection of the left renal pedicle, and placement of the clamp beneath this pedicle so that blood flow was not occluded; n = 5 mice/group. Values are means ± SE. B: BARD ameliorates ischemic AKI as assessed by function. BUN, blood urea nitrogen. BARD or vehicle was given as in A, but renal pedicles were clamped for 17 min on day 0. Values are means ± SE; n = 4 mice/group. P < 0.05 between BARD and vehicle groups at day 1 of reperfusion.
Fig. 2.
Fig. 2.
Effects of BARD on ischemic AKI at 24-h reperfusion. A: pathology: injury. The x-axis is arbitrary injury units, with 0 being the least and with 5 being maximal injury; see the text. BARD was administered as in Fig. 1; n = 5 kidneys/group. B: pathology: inflammation. The x-axis is the number of napthol-AS-d-chloracetate-esterase-positive leukocytes per high-powered field; n = 5 kidneys/group. Values are means ± SD. P values were determined by t-tests.
Fig. 3.
Fig. 3.
A and B: effects of BARD on pathology and inflammation with representative photomicrographs. Representative low-power views of hematoxylin- and eosin-stained sections of vehicle-treated (A) vs. BARD-treated (B) ischemic kidneys are shown. IR, ischemia-reperfusion. G indicates a few of many glomeruli. Arrow shows outer medulla, where there are many necrotic tubules in A but very few necrotic tubules in B. C and D: effects of BARD on pathology and inflammation with representative photomicrographs. Representative high-power views of kidneys from vehicle-treated (C) vs. BARD-treated (D) mice are shown. N indicates several of many necrotic tubules, and arrows indicate some of many esterase-positive neutrophils (see methods) in the vehicle-treated outer medulla (C). E and F: effects of BARD on apoptosis as assessed by terminal transferase-dUTP nick-end labeling (TUNEL) assay. The vehicle-treated ischemic kidney has many TUNEL-positive cells (E), whereas the BARD-treated ischemic kidney has few TUNEL-positive cells (F).
Fig. 4.
Fig. 4.
BARD increases renal NF-E2-related factor 2 (Nrf2), peroxisome proliferator-activated receptor-γ (PPARγ), and heme oxygenase-1 (HO-1) mRNA abundance in surgically unmanipulated kidneys: densitometries. Kidneys were harvested 3 or 6 h after a single injection of BARD; n = 6/group. Average and standard ratios of the RT-PCR are shown. P values are comparisons between the indicated groups by t-test.
Fig. 5.
Fig. 5.
BARD increases renal Nrf2, PPARγ, and HO-1 mRNA abundance in surgically unmanipulated kidneys. Shown is a representative RT-PCR gel. 3H and 6H indicate 3 and 6 h after BARD or vehicle administration, respectively.
Fig. 6.
Fig. 6.
BARD increases renal Nrf2 (A), PPARγ (B), and HO-1 (C) mRNA abundance after IR: densitometries. The y-axis shows the ratio of densitometry of the indicated gene to the densitometry of GAPDH. IR, ischemia caused by clamping the renal arteries, followed by the reperfusion times shown on the x-axis; S, sham surgery where a clamp was placed under the renal arteries and no occlusion of the renal arteries occurred. P values are by 1-way ANOVA of all treatment groups at a given reperfusion time, followed by the Student-Newman-Keuls method applied to the indicated groups.
Fig. 7.
Fig. 7.
BARD increases renal Nrf3, PPARγ, and HO-1 mRNA abundance after IR: representative gels. Gel 1 compares the RT-PCR for the above 3 genes compared with GAPDH at 4-h reperfusion in kidneys; gels 2 and 3 show the results at 8-h reperfusion; gel 4 shows the results at 24-h reperfusion.
Fig. 8.
Fig. 8.
BARD increases renal Nrf2 protein. Sections were immunostained for Nrf2 protein. A: semiquantitative analysis of the glomeruli. B: semiquantitative analysis of the peritubular capillaries of the cortex. The y-axis shows the number of Nrf2-positive cells per high-power field (hpf). The statistical analyses for each time point were by ANOVA, and the comparisons between the indicated groups were then performed by the Student-Newman-Keuls method.
Fig. 9.
Fig. 9.
Increased Nrf2 in BARD- vs. vehicle-treated ischemic renal cortex. A: anti-Nrf2 immunoperoxidase staining of BARD-treated ischemic kidneys at 8-h reperfusion. G, intensely Nrf2-positive glomeruli; T, one of many Nrf2-negative tubules; b, one rare Nrf2-positive tubule. Black arrows indicate peritubular Nrf2-positive “capillaries.” Capillaries are provisionally identified in this figure, and definitively identified in Figs. 11 and 12 that show double staining of CD31 and Nrf2. Inset: control antibody. B: anti-Nrf2 immunoperoxidase in vehicle-treated ischemic kidneys at 8-h reperfusion. Glomeruli that are less intensely stained than in the BARD-treated kidney in A are indicated as g, and t indicates one of many tubules. Inset: control antibody.
Fig. 10.
Fig. 10.
Localization of Nrf2 to glomerular endothelia of BARD-treated ischemic kidneys at 8-h reperfusion. Anti-CD31 is shown in green, anti-Nrf2 in red, and the overlap of both antibodies in yellow.
Fig. 11.
Fig. 11.
Localization of Nrf2 to cortical peritubular endothelia of BARD-treated ischemic kidneys at 8-h reperfusion. White arrows show a few of the many endothelia stained with anti-CD31 (green), anti-Nrf2 (red), and both antibodies (yellow).
Fig. 12.
Fig. 12.
Semiquantitative analysis of renal PPARγ protein in glomeruli. Sections were immunostained for PPARγ protein. The y-axis shows the number of Nrf2-positive cells per hpf. The statistical analyses for each time point were by ANOVA, and the comparisons between the indicated groups were then performed by the Student-Newman-Keuls method.
Fig. 13.
Fig. 13.
Increased PPARγ in BARD- vs. vehicle-treated ischemic renal cortex. A: anti-PPARγ immunoperoxidase staining of BARD-treated ischemic kidneys at 8-h reperfusion. G, intensely PPARγ-positive glomeruli. Inset: control antibody. B: anti-PPARγ immunoperoxidase in vehicle-treated ischemic kidneys at 8-h reperfusion. Glomeruli that are less intensely stained than in the BARD-treated kidney in A are indicated as g. Inset: control antibody.
Fig. 14.
Fig. 14.
Localization of PPARγ to glomerular endothelia of BARD-treated ischemic kidneys at 8-h reperfusion. Anti-CD31 is shown in green, anti-PPARγ in red, and the overlap of both antibodies in yellow.
Fig. 15.
Fig. 15.
Semiquantitative analysis of renal HO-1 protein. Sections were immunostained for HO-1. The y-axis shows the number of Nrf2-positive cells per hpf. The statistical analyses for each time point were by ANOVA, and the comparisons between the indicated groups were then performed by the Student-Newman-Keuls method.
Fig. 16.
Fig. 16.
A and B: localization of increased HO-1 in BARD-treated ischemic kidneys. A: BARD-treated ischemic kidney. Black arrow indicates one of many tubules prominently stained for HO-1. B: vehicle-treated ischemic kidney. Hollow black arrow indicates one of many tubules less prominently stained for HO-1 compared with A. C: localization of increased HO-1 in BARD-treated ischemic kidneys. C: high power of BARD-treated ischemic kidney. Black arrow indicates one of many HO-1 positive tubules. Red arrows indicate some interstitial cells that may be leukocytes by virtue of their morphology.

References

    1. Ahmad R, Raina D, Meyer C, Kharbanda S, Kufe D. Triterpenoid CDDO-Me blocks the NF-kappa B pathway by direct inhibition of IKKbeta on Cys-179. J Biol Chem 281: 35764–35769, 2006. - PubMed
    1. Alam J, Cook JL. How many transcription factors does it take to turn on the heme oxygenase-1 gene? Am J Respir Cell Mol Biol 36: 166–174, 2007. - PubMed
    1. Aleksunes LM, Goedken MJ, Rockwell CE, Thomale J, Manautou JE, Klaassen CD. Transcriptional regulation of renal cytoprotective genes by Nrf2 and its potential use as a therapeutic target to mitigate cisplatin-induced nephrotoxicity. J Pharmacol Exp Ther 335: 2–12, 2010. - PMC - PubMed
    1. Alvarez-Maqueda M, El Bekay R, Alba G, Monteseirin J, Chacon P, Vega A, Martin-Nieto J, Bedoya FJ, Pintado E, Sobrino F. 15-Deoxy-delta 12,14-prostaglandin J2 induces heme oxygenase-1 gene expression in a reactive oxygen species-dependent manner in human lymphocytes. J Biol Chem 279: 21929–21937, 2004. - PubMed
    1. Benson SC, Pershadsingh HA, Ho CI, Chittiboyina A, Desai P, Pravenec M, Qi N, Wang J, Avery MA, Kurtz TW. Identification of telmisartan as a unique angiotensin II receptor antagonist with selective PPARgamma-modulating activity. Hypertension 43: 993–1002, 2004. - PubMed

Publication types

MeSH terms