. 2011 Apr;300(4):F1026-42.
doi: 10.1152/ajprenal.00187.2010. Epub 2011 Feb 2.

Role of smooth muscle protein SM22α in glomerular epithelial cell injury

Affiliations

Role of smooth muscle protein SM22α in glomerular epithelial cell injury

Caroline B Marshall et al. Am J Physiol Renal Physiol. 2011 Apr.

Abstract

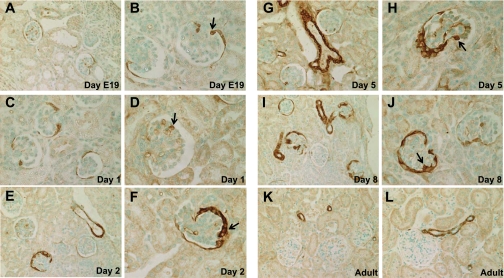
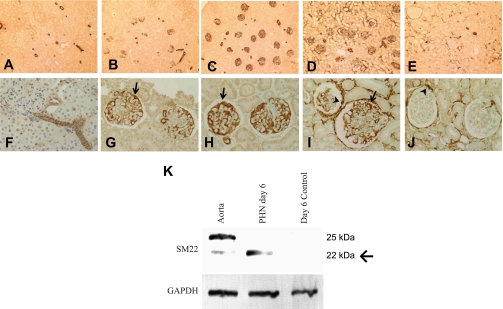
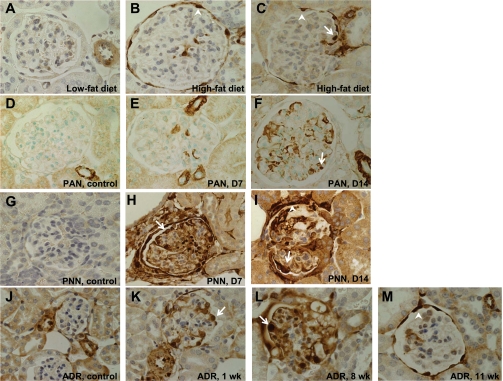
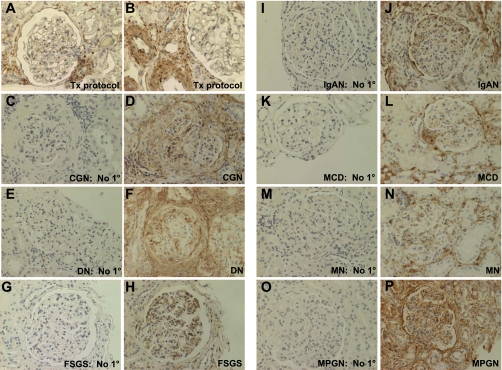
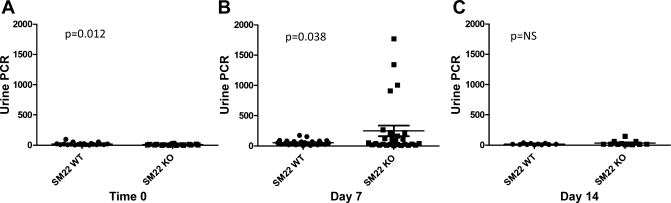
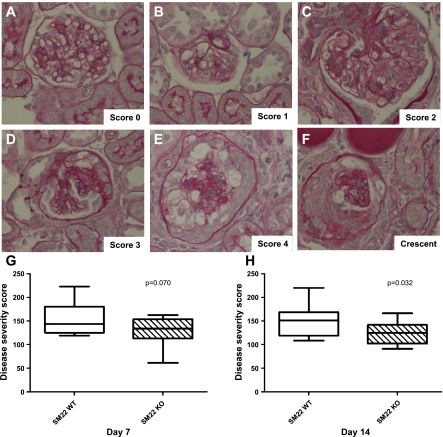
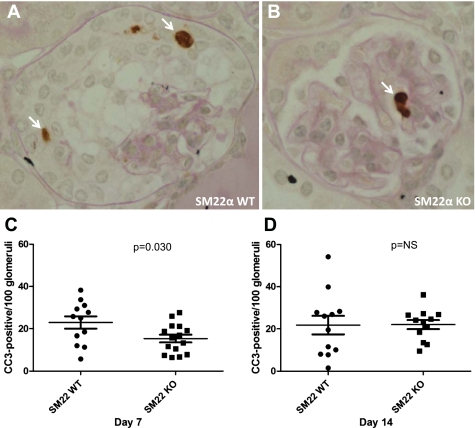
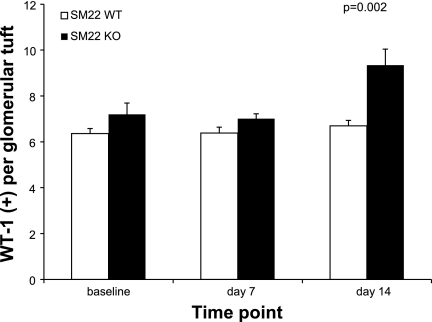
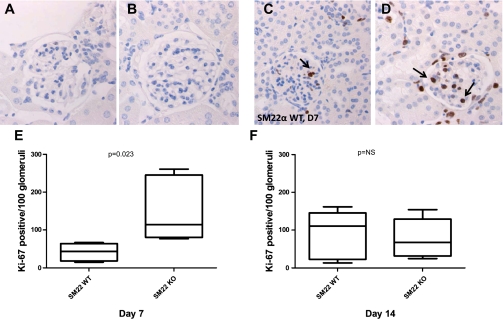
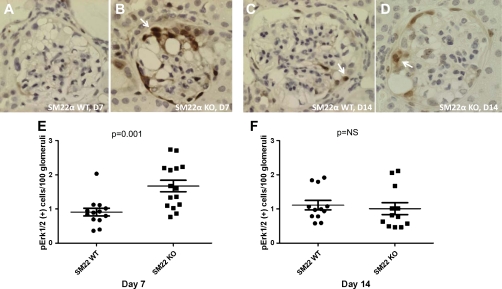
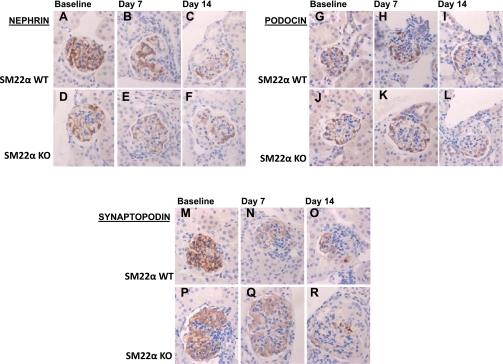
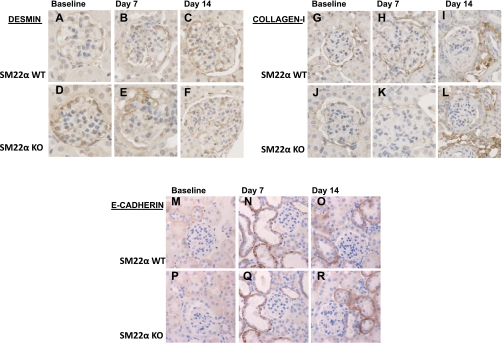
Podocytes are considered terminally differentiated cells in the mature kidney under normal conditions. In the face of injury, podocytes may proceed along several possible pathways, including dedifferentiation and proliferation, persistent cell cycle arrest, hypertrophy, apoptosis, or necrosis. There is mounting evidence that transdifferentiation into a dysregulated phenotype may also be a potential cell fate. We have previously reported that the transcript of SM22α, an actin-binding protein considered one of the earliest markers of smooth muscle differentiation, is upregulated nearly 70-fold in glomeruli of rats with passive Heymann nephritis (PHN). In contrast, the SM22α transcript is absent in normal adult rat glomeruli. The purpose of this study was to define SM22α's expression during kidney development and its role in glomerular diseases characterized by podocyte injury and proteinuria. During glomerulogenesis and podocyte differentiation, SM22α was expressed in glomeruli. This expression disappeared with glomerular maturation. Along with SM22α induction in PHN, confirmed at both mRNA and protein levels, SM22α was also induced across a broad range of proteinuric diseases, including experimental animal models (puromycin aminonucleoside nephropathy, adriamycin nephropathy, passive nephrotoxic nephritis, and diet-induced obesity) and human diseases (collapsing glomerulopathy, diabetic nephropathy, classic focal segmental glomerulosclerosis, IgA nephropathy, minimal-change disease, membranous nephropathy, and membranoproliferative glomerulonephritis). Crescentic glomerulonephritis was induced in SM22α +/+ and SM22α -/- mice by intraperitoneal injection of sheep anti-rabbit glomeruli antibody 12.5 mg/20 g body wt × 2 doses (n = 12-15/group), with mice euthanized at 7 and 14 days. Compared with SM22α -/- mice, SM22α +/+ mice demonstrated worse disease by histopathological parameters. In addition, there was greater apoptosis (cleaved caspase-3 immunostaining), fewer podocytes (Wilms' tumor-1 immunostaining), and less proliferation (Ki-67 immunostaining) in diseased SM22α +/+ mice. Furthermore, there was decreased activation of Erk1/2 in diseased SM22α +/+ mice. We conclude that the de novo expression of SM22α in glomerular epithelial cells affects the course of crescentic glomerulonephritis.


Figures

Fig. 1.
Fig. 1.
SM22α expression during active glomerulogenesis and podocyte differentiation. Representative micrographs of immunohistochemistry (IHC) for SM22α at embryonic day 19 (A and B), postnatal day 1 (C and D), day 2 (E and F), day 5 (G and H), day 8 (I and J), and in an adult mouse (K and L). During glomerular development, there was a progressive increase in the expression of SM22α, as determined by IHC, prenatally and during the early postnatal period, in a distribution that included developing podocytes, parietal epithelial cells, and endothelial cells (arrows indicate examples of positive cells). In adult mice, following kidney maturation, SM22α staining was absent in glomeruli, but remained positive in adjacent vessels.
Fig. 2.
Fig. 2.
SM22α levels in passive Heymann nephritis (PHN) model of membranous nephropathy. AJ: representative micrographs of IHC for SM22α. Shown are control tissue (A and F) and tissue following disease induction at day 3 (B and G), day 6 (C and H), day 10 (D and I), and day 30 (E and J). In control tissue, only arterioles stained positive for SM22α. Following disease induction, there was a progressive increase in SM22α staining in glomeruli from days 3–10. By day 30, the immunostaining had decreased in the glomerular tuft, but remained prominent in parietal epithelial cells (PECs) and in the interstitium. Original magnification ×10 (AE) and ×20 (FJ). Arrows indicate positive podocytes and arrowheads indicate positive PECs. K: Western blot for SM22α. In protein extracted from isolated normal glomeruli, no SM22α was detected. Protein extracted from isolated glomeruli of PHN rats showed abundantly expressed SM22α by day 6 of disease. Protein extracted from the aorta served as the positive control. GAPDH was used as a housekeeping protein to ensure equal protein loading. Arrow indicates band of interest at 22 kDa.
Fig. 3.
Fig. 3.
SM22α IHC in rodent disease models characterized by podocyte injury and proteinuria. Representative micrographs of IHC for SM22α. Original magnification ×40. Arrows indicate examples of positive podocytes; arrowheads indicate examples of positive PECs. AC: diet-induced obesity (DIO) in mice. A: in mice fed a low-fat diet, there was no significant glomerular staining for SM22α. An adjacent vessel served as the internal positive control. B and C: in mice fed a high-fat diet, there was positive SM22α staining in both podocytes and PECs. DF: puromycin aminonucleoside nephropathy (PAN) in rats. D: in rats that received vehicle alone, there was positive staining for SM22α in vessels only. E and F: by day 7 of disease, and increasing by day 14, there was de novo expression of SM22α in podocytes. GI: passive nephrotoxic nephritis (PNN) in mice. G: in mice that received vehicle alone, SM22α staining was negative in glomeruli. H and I: by day 7, and continuing at day 14, there was de novo expression of SM22α, with positive staining in podocytes and PECs. JM: adriamycin (ADR) nephropathy in mice. J: in mice receiving vehicle only, there was no significant staining in glomeruli. K: by 1 wk after administration of ADR, there was de novo expression of SM22α in podocytes and PECs. L: staining of SM22α increased by week 8 following ADR administration. M: by week 11 of disease, the SM22α staining of podocytes had diminished, but the staining in PECs remained strong.
Fig. 4.
Fig. 4.
SM22α IHC in human diseases characterized by proteinuria. Representative micrographs of IHC for SM22α. A and B: protocol biopsy of transplant kidney tissue, considered “normal” control. There was no significant staining for SM22α within the glomeruli. The staining in vessels served as the internal positive control. CP: in all cases, with omission of the primary antibody, there was no significant staining. In diseased tissues, there was positive intraglomerular staining for SM22α in a podocyte, PEC, and mesangial cell distribution. In some instances, there was marked periglomerular and tubulointerstitial staining associated with positively stained polymorphonuclear leukocytes within the interstitium. In addition, peritubular capillaries intensely stained positively for SM22α. C and D: collapsing glomerulopathy (CGN). E and F: diabetic nephropathy (DN). G and H: focal segmental glomerulosclerosis (FSGS). I and J: IgA nephropathy (IgAN). K and L: minimal change disease (MCD). M and N: membranous nephropathy (MN). O and P: membranoproliferative glomerulonephritis (MPGN).
Fig. 5.
Fig. 5.
Urinary protein-to-creatinine ratio (PCR) in SM22α +/+ and SM22α −/− mice at baseline and following induction of experimental crescentic GN. A: at time 0, SM22α +/+ mice had a statistically significantly greater PCR at baseline compared with SM22α −/− mice (P < 0.05). B: at day 7 of disease, SM22α −/− mice had a statistically significantly greater PCR compared with SM22α +/+ mice (P < 0.05). C: at day 14 following disease induction, there was no statistically significant difference in PCR between SM22α +/+ and SM22α −/− mice.
Fig. 6.
Fig. 6.
Histopathological changes by periodic acid-Schiff (PAS) staining in SM22α +/+ and SM22α −/− mice with experimental crescentic GN. AF: histopathology (original magnification ×40). Representative micrographs of PAS staining of tissues from diseased mice are shown to illustrate the scoring system used to obtain the disease severity score. A: score 0 = normal glomerulus. B: score 1 = minimal disease, characterized by capillary loop dilatation. C: score 2 = mesangial matrix expansion and proliferative changes, affecting <50% of glomerular tuft. D: score 3 = proliferative changes affecting 50–75% of glomerular tuft. E: score 4 = proliferative changes affecting >75% of glomerular tuft. F: crescent, extracapillary proliferation of cells within the urinary space. G and H: disease severity score. G: at day 7 of disease, there was no significant difference in disease severity score between SM22α +/+ and SM22α −/− mice. H: at day 14 following disease induction, SM22α +/+ mice exhibited statistically significantly greater disease severity compared with SM22α −/− mice, as semiquantitatively assessed by disease severity score (P < 0.05).
Fig. 7.
Fig. 7.
Apoptosis detection by IHC for cleaved caspase-3 (CC3) in SM22α +/+ and SM22α −/− mice following induction of crescentic GN. A and B: representative micrographs of CC3 staining in diseased glomerular tissue from SM22α +/+ mice (A) and SM22α −/− mice (B). Arrows indicate positively stained cells. C and D: quantification of positively stained cells for CC3 in tissues from diseased SM22α +/+ and SM22α −/− mice. C: at day 7 following disease induction, there were statistically significantly more cells staining positively for CC3 in SM22α +/+ tissue compared with SM22α −/− tissue (P < 0.05). D: by day 14, this difference was no longer statistically significant.
Fig. 8.
Fig. 8.
Wilms' tumor (WT)-1 IHC in SM22α +/+ and SM22α −/− mice in experimental crescentic GN. Quantification of WT-1-positive cells per glomerular tuft is shown. Before disease induction and at day 7 of disease, there was not a statistically significant difference in the number of WT-1-positive cells between groups. By day 14, there were significantly more WT-1-positive cells in glomeruli of SM22α −/− mice compared with SM22α +/+ mice (P < 0.05).
Fig. 9.
Fig. 9.
IHC for Ki-67 in SM22α +/+ and SM22α −/− mice in experimental crescentic GN. Representative micrographs of IHC for Ki-67 are shown. A and C: SM22α +/+ mice at baseline (A) and day 7 of disease (C). B and D: SM22α −/− mice at baseline (B) and day 7 of disease (D). Original magnification ×40. Arrows indicate examples of positively stained cells in a podocyte distribution. E and F: quantification of Ki-67-positive cells per 100 glomeruli counted. E: at day 7 following disease induction, there was a statistically significantly greater number of Ki-67-positive cells in tissue from SM22α −/− mice compared with SM22α +/+ mice (P < 0.05). F: this difference was no longer significant by day 14 of disease.
Fig. 10.
Fig. 10.
IHC for pErk1/2 in SM22α +/+ and SM22α −/− mice in experimental crescentic GN. Representative micrographs of IHC for pErk1/2 are shown. A and C: SM22α +/+ mice at day 7 (A) and day 14 of disease (C). B and D: SM22α −/− mice at day 7 (B) and day 14 of disease (D). Original magnification ×40. Arrows indicate examples of positively stained cells in a podocyte and PEC distribution. E and F: quantification of pErk1/2-positive cells per 100 glomeruli counted. E: at day 7 following disease induction, there was a statistically significantly greater number of pErk1/2-positive cells in tissue from SM22α −/− mice compared with SM22α +/+ mice (P < 0.05). F: this difference was no longer significant by day 14 of disease.
Fig. 11.
Fig. 11.
IHC for podocyte-specific proteins nephrin, podocin, and synaptopodin in SM22α +/+ and SM22α −/− mice in experimental crescentic GN. Representative micrographs of IHC for nephrin (AF), podocin (GL), and synaptopodin (MR) are shown (original magnification ×40). At baseline, there is no significant difference in nephrin staining between SM22α +/+ and SM22α −/− tissues, with strong linear staining seen along the glomerular capillary loops (A and D). Following disease induction, there is diminished nephrin staining, with no significant difference between the two groups at the early (B and E) and late (C and F) time points. At baseline, there is more podocin staining in SM22α +/+ tissue compared with SM22α −/− tissue (G and J). At day 7 following disease induction, there is no significant difference in podocin staining for SM22α +/+ and SM22α −/− mice (H and K). By day 14 following injury, the SM22α +/+ tissue demonstrates greater podocin staining compared with that seen in SM22α −/− mice (I and L). At baseline, there is no significant difference in staining for synaptopodin in SM22α +/+ and SM22α −/− mice (M and P). Following disease induction, there is diminished synaptopodin staining, with no significant difference between the 2 groups at the early (N and Q) and late (O and R) time points.
Fig. 12.
Fig. 12.
IHC for desmin, collagen type I, and E-cadherin in SM22α +/+ and SM22α −/− mice in experimental crescentic GN. Representative micrographs of IHC for intermediate filament protein desmin (AF), interstitial matrix component collagen type I (GL), and epithelial marker E-cadherin (MR) are shown (original magnification ×40). At baseline, there is no significant difference in desmin staining between SM22α +/+ and SM22α −/− tissues (A and D). Following disease induction, there is increased desmin staining within the glomerular tuft area, with no significant difference between the two groups at the early (B and E) and late (C and F) time points. At baseline, there is no significant staining for collagen type I within the glomerular tuft area (G and J). Following disease induction, there is no significant increase in staining within the glomerular tuft area, but there is an increase in tubulointerstitial staining in both SM22α +/+ and SM22α −/− mice (H and K, I and L). At baseline, there is no significant staining in the glomerular tuft area for E-cadherin in SM22α +/+ and SM22α −/− mice (M and P). Following disease induction, there is increased tubular epithelial staining for E-cadherin, with no significant difference between the 2 groups at the early (N and Q) and late (O and R) time points.

References

    1. Adam PJ, Regan CP, Hautmann MB, Owens GK. Positive- and negative-acting Kruppel-like transcription factors bind a transforming growth factor beta control element required for expression of the smooth muscle cell differentiation marker SM22alpha in vivo. J Biol Chem 275: 37798–37806, 2000 - PubMed
    1. Appel D, Kershaw DB, Smeets B, Yuan G, Fuss A, Frye B, Elger M, Kriz W, Floege J, Moeller MJ. Recruitment of podocytes from glomerular parietal epithelial cells. J Am Soc Nephrol 20: 333–343, 2009 - PMC - PubMed
    1. Asanuma K, Kim K, Oh J, Giardino L, Chabanis S, Faul C, Reiser J, Mundel P. Synaptopodin regulates the actin-bundling activity of alpha-actinin in an isoform-specific manner. J Clin Invest 115: 1188–1198, 2005 - PMC - PubMed
    1. Assinder SJ, Stanton JA, Prasad PD. Transgelin: an actin-binding protein and tumour suppressor. Int J Biochem Cell Biol 41: 482–486, 2009 - PubMed
    1. Bariety J, Bruneval P, Hill GS, Mandet C, Jacquot C, Meyrier A. Transdifferentiation of epithelial glomerular cells. J Am Soc Nephrol 14, Suppl 1: S42–S47, 2003 - PubMed

Publication types