. 2011 Feb 15;25(4):336-49.
doi: 10.1101/gad.2011311. Epub 2011 Feb 2.

Yeast cells can access distinct quiescent states

Affiliations

Yeast cells can access distinct quiescent states

Maja M Klosinska et al. Genes Dev. .

Abstract

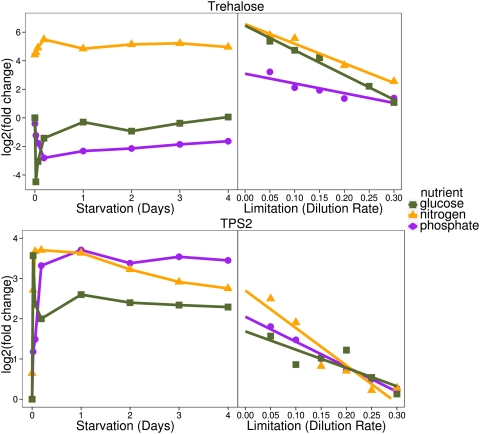
We conducted a phenotypic, transcriptional, metabolic, and genetic analysis of quiescence in yeast induced by starvation of prototrophic cells for one of three essential nutrients (glucose, nitrogen, or phosphate) and compared those results with those obtained with cells growing slowly due to nutrient limitation. These studies address two related questions: (1) Is quiescence a state distinct from any attained during mitotic growth, and (2) does the nature of quiescence differ depending on the means by which it is induced? We found that either limitation or starvation for any of the three nutrients elicits all of the physiological properties associated with quiescence, such as enhanced cell wall integrity and resistance to heat shock and oxidative stress. Moreover, the starvations result in a common transcriptional program, which is in large part a direct extrapolation of the changes that occur during slow growth. In contrast, the metabolic changes that occur upon starvation and the genetic requirements for surviving starvation differ significantly depending on the nutrient for which the cell is starved. The genes needed by cells to survive starvation do not overlap the genes that are induced upon starvation. We conclude that cells do not access a unique and discrete G(0) state, but rather are programmed, when nutrients are scarce, to prepare for a range of possible future stressors. Moreover, these survival strategies are not unique to quiescence, but are engaged by the cell in proportion to nutrient scarcity.


Figures

Figure 1.
Figure 1.
Physiological properties of quiescent cells are extensions of those of slow-growing cells. (A) Survival of strain Y3358 grown to exponential phase in limiting SD and transferred at time 0 to SD lacking glucose, nitrogen, or phosphate for the indicated amount of time. Survival of an isogenic ura3 strain starved for uracil is also shown. Viability was determined by colony-forming units and normalized to the viability at the onset of starvation. (B) FACS analysis of Sytox Green-stained cells cultured in the same conditions as in A at the indicated times after transfer to starvation conditions. (C) Heat-shock sensitivity. Cells growing exponentially in limiting SD (left) or quiescent cells after 4 d of starvation for glucose, nitrogen, or phosphate (right) were incubated for the indicated times at 50°C or 53°C as indicated. Serial 10-fold dilutions were spotted onto YEPD plates and growth is shown after 2 d at 30°C. (D) Sensitivity to oxidative stress. Cells were grown to exponential phase in limiting SD, starved for 4 d for the indicated nutrient, or grown in chemostat at indicated growth rates. Aliquots were treated with 0 mM, 1 mM, 5 mM, 10 mM, or 50 mM H2O2 for 1 h at 30°C, and then 10-fold serial dilutions were spotted onto YEPD plates. Growth is shown after 2 d of incubation at 30°C. (E) Sensitivity to zymolyase. Cells were grown as in D. Cells from the culture samples were harvested and resuspended in 50 mM potassium phosphate (pH 7.5) to an OD (600 nm) of 0.5, and the indicated amount of zymolyase T20 solution (10 mg/mL) was added to a total volume of 1 mL per sample. ODs were determined after incubation for 40 min at 30°C.
Figure 2.
Figure 2.
Cells exhibit a limited quiescent-specific transcriptional response. (A) Heat map of the global transcriptional changes resulting from starvation for glucose (C), nitrogen (N), or phosphate (P) for increasing time, juxtaposed next to those resulting from growth at increasing doubling times. Data are shown for ∼5500 genes that are organized by unsupervised hierarchical clustering. Data for expression as a function of nutrient limitation were taken from Brauer et al. (2008) for strain Y3840 with dilution rates of 0.05 h−1, 0.1 h−1, 0.15 h−1, 0.2 h−1, 0.25 h−1, and 0.3 h−1 (left to right). Reference for all chemostat samples is from a glucose-limited culture with a dilution rate of 0.25 h−1. Starvation data were obtained with strain Y3358 starved for 30 min, 90 min, 270 min, 1 d, 2 d, 3 d, 4 d, or 8 d (left to right), normalized as described in the Materials and Methods to the reference culture in Brauer et al. (2008). Bars immediately to the left of the data identify those genes that show either growth rate-specific gene expression (green) or quiescence-specific gene expression over all three nutrient conditions. (B) Expression patterns of genes showing growth rate-specific expression (left), quiescence expression (middle), or both (right) are organized as in A.
Figure 3.
Figure 3.
Metabolic profiles differ during starvation for different nutrients. Relative metabolite levels in nutrient-starved and nutrient-limited cultures were obtained as described in the Materials and Methods and are represented as a heat map, organized as in Figure 2A. The reference for all samples is from an exponential culture growing on SD.
Figure 4.
Figure 4.
Trehalose metabolism in starved cells. Relative trehalose levels (top panel) and TPS2 mRNA levels (bottom panel) are shown following starvation for glucose, nitrogen, or phosphate, and as a function of dilution rate in chemostats limiting for those nutrients. The reference for all samples is from an exponential culture growing on SD. The data for starvation and limitation in each panel are plotted using the same vertical axis scale
Figure 5.
Figure 5.
Discordance in TCA cycle intermediates and gene expression levels during starvation. On a diagram of the TCA cycle consisting of the TCA cycle intermediates (ovals) and the genes encoding enzymes (rounded rectangles) catalyzing interconversion of those intermediates are indicated the change in levels of the metabolites and mRNAs at 4 d of starvation for glucose (top panel), nitrogen (middle panel), or phosphate (bottom panel) relative to those in cells growing exponentially on SD.

Similar articles

Cited by

References

    1. Airoldi EM, Huttenhower C, Gresham D, Lu C, Caudy AA, Dunham MJ, Broach JR, Botstein D, Troyanskaya OG 2009. Predicting cellular growth from gene expression signatures. PLoS Comput Biol 5: e1000257 doi: 10.1371/journal.pcbi.1000257 - PMC - PubMed
    1. Benjamini Y, Yekutieli D 2001. The control of the false discovery rate in multiple testing under dependency. Ann Stat 29: 1165–1188
    1. Boer VM, Amini S, Botstein D 2008. Influence of genotype and nutrition on survival and metabolism of starving yeast. Proc Natl Acad Sci 105: 6930–6935 - PMC - PubMed
    1. Boer VM, Crutchfield CA, Bradley PH, Botstein D, Rabinowitz JD 2010. Growth-limiting intracellular metabolites in yeast growing under diverse nutrient limitations. Mol Biol Cell 21: 198–211 - PMC - PubMed
    1. Brauer MJ, Yuan J, Bennett BD, Lu W, Kimball E, Botstein D, Rabinowitz JD 2006. Conservation of the metabolomic response to starvation across two divergent microbes. Proc Natl Acad Sci 103: 19302–19307 - PMC - PubMed

Publication types

MeSH terms