. 2011 Apr;22(7):1104-19.
doi: 10.1091/mbc.E10-07-0596. Epub 2011 Feb 2.

Functional characterization of putative cilia genes by high-content analysis

Affiliations

Functional characterization of putative cilia genes by high-content analysis

Cary K Lai et al. Mol Biol Cell. 2011 Apr.

Abstract

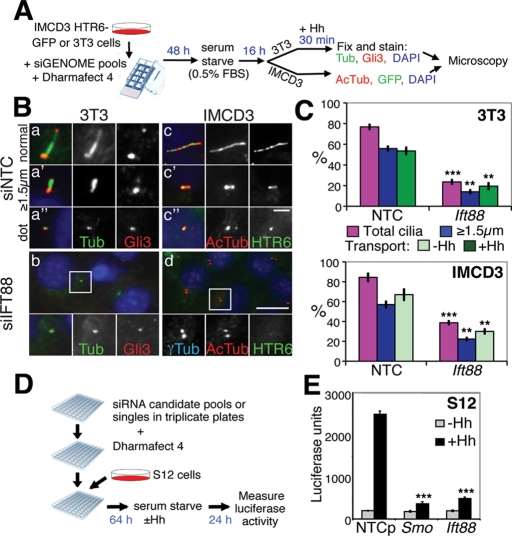
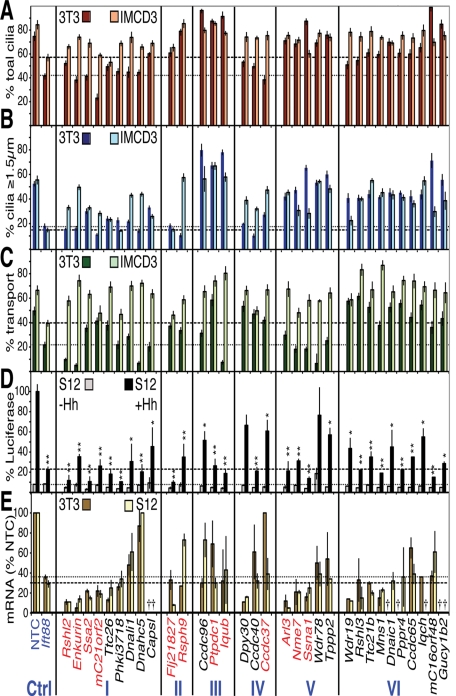
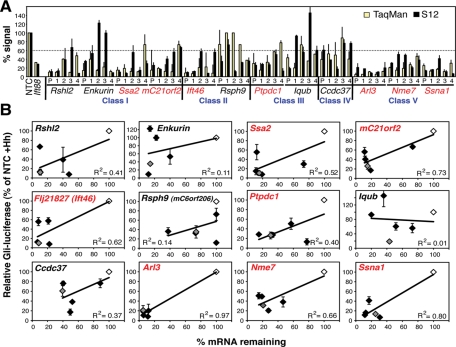
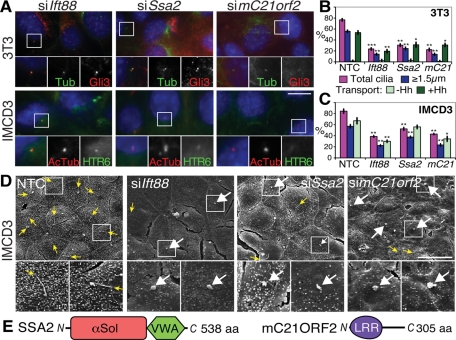
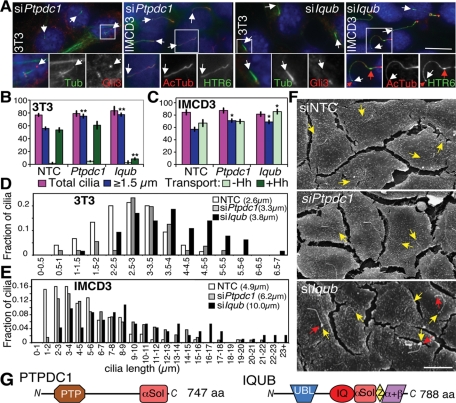
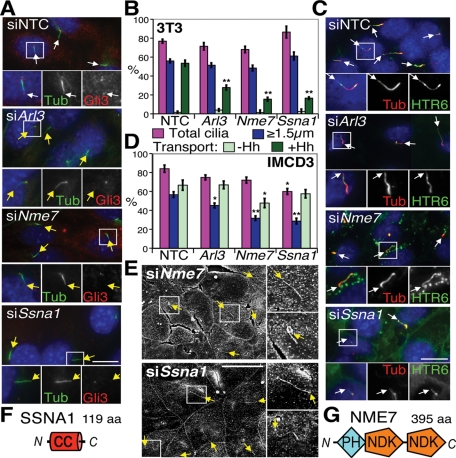
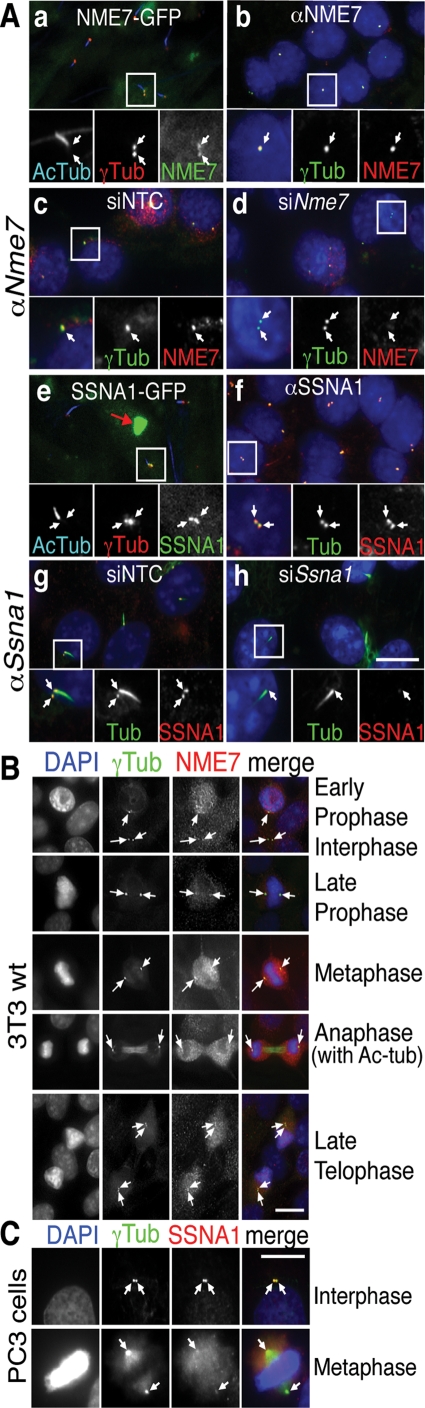
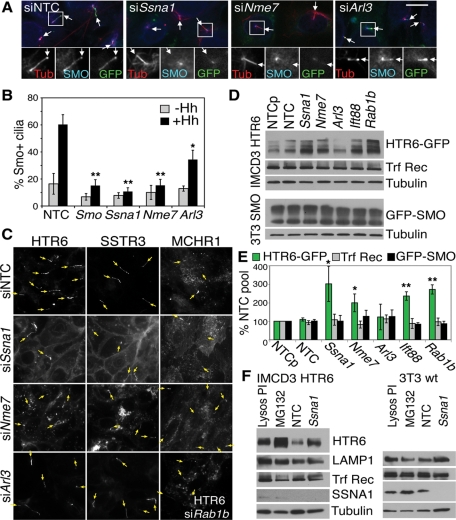
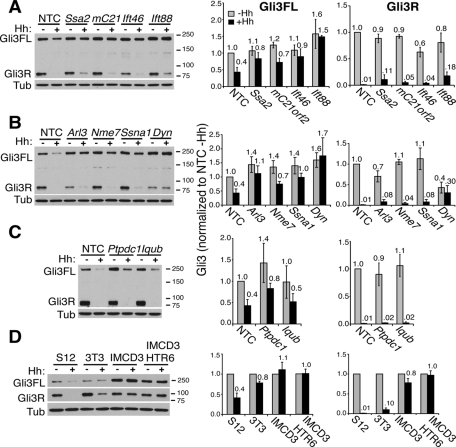
Cilia are microtubule-based protrusions from the cell surface that are involved in a number of essential signaling pathways, yet little is known about many of the proteins that regulate their structure and function. A number of putative cilia genes have been identified by proteomics and comparative sequence analyses, but functional data are lacking for the vast majority. We therefore monitored the effects in three cell lines of small interfering RNA (siRNA) knockdown of 40 of these genes by high-content analysis. We assayed cilia number, length, and transport of two different cargoes (membranous serotonin receptor 6-green fluorescent protein [HTR6-GFP] and the endogenous Hedgehog [Hh] pathway transcription factor Gli3) by immunofluorescence microscopy; and cilia function using a Gli-luciferase Hh signaling assay. Hh signaling was most sensitive to perturbations, with or without visible structural cilia defects. Validated hits include Ssa2 and mC21orf2 with ciliation defects; Ift46 with short cilia; Ptpdc1 and Iqub with elongated cilia; and Arl3, Nme7, and Ssna1 with distinct ciliary transport but not length defects. Our data confirm various ciliary roles for several ciliome proteins and show it is possible to uncouple ciliary cargo transport from cilia formation in vertebrates.


Figures

FIGURE 1:
FIGURE 1:
siRNA screen outline and controls. (A) The microscopy-based siRNA screen setup. Transfection of siRNA, serum starvation, fixation, and staining were performed as detailed in Materials and Methods. (B) Microscopy assay controls for cilia structure and transport. 3T3 (a and b) or IMCD3 HTR6-GFP (c and d) cells were transfected with nontargeting control (siNTC, top) or Ift88 (siIft88, bottom) siRNAs then were serum starved for 16 h. 3T3 cells were stimulated with Hh for 30 min immediately before fixation and staining for endogenous Gli3 (red channel), cilia and centrosomes (anti–acetylated tubulin and anti–γ-tubulin, respectively [Tub], green channel), and nuclei (DAPI, blue channel). Note that anti-Gli3 nonspecifically cross-reacts with centrosomes in addition to its specific cilia tip staining (Wen et al., 2010). Three representative cilia types in control cells are shown: a normal ∼2.5-μm-long cilium (a), a substantial but short cilium ≤1.5 μm long (longer than it is wide) (a′), and a ciliary “dot” that is only as long as it is wide (∼0.5 μm) (a′′). IMCD3 HTR6-GFP cells were fixed and stained for cilia (anti–acetylated tubulin [AcTub], red channel) and DAPI (blue channel), and HTR6-GFP fluorescence was detected in the green channel. Again, examples of normal (c), short (c′) and dot (c′′) cilia are shown. Insets at the bottom of b and d show 2× magnification of the boxed regions, with individual and merged channels shown (anti–γ-tubulin [γTub] in the Cy5 channel replaces DAPI in the inset of d). Scale bar represents 2.5 μm in a, c, and insets and 10 μm in the main panel of b and d. (C) Quantification of cilia phenotypes upon siRNA knockdown. Images of 3T3 or IMCD3 HTR6-GFP cells treated as in (B) were scored for ciliation (% total cilia, magenta), cilia length (% ≥1.5-μm-long cilia, blue), and ciliary cargo (% transport, green) of Gli3 (3T3, defined as a Gli3 spot distinct from the centrosome) or HTR6-GFP (IMCD3), scoring as a percentage of the (blue bar) “nondot” cilia (≥1.5 μm long so that the tip and base were clearly distinct) that transport each cargo. The means and standard deviations (SDs) of three independent experiments are shown. Asterisks denote statistical significance between NTC and Ift88 siRNA-treated samples according to the t test (**p ≤ 0.01; ***p ≤ 0.001). (D) Outline of the S12 Gli-luciferase Hh signaling assay. Transfection of siRNA, serum starvation, Hh addition, and luciferase measurements are described in Materials and Methods. (E) Quantification of Hh signaling in the S12 assay with (black) and without (gray) Hh using NTC and positive control siRNAs to Smoothened (Smo) and Ift88. The means and SDs of three independent experiments are shown. ***p ≤ 0.001 vs. siNTC control.
FIGURE 2:
FIGURE 2:
Primary screen results for the 32 candidate siRNAs with ciliary phenotypes. The results of the three functional assays are plotted in categories according to the resulting phenotypes (classes listed at the bottom). (A) Ciliation phenotypes. The percentage of cells bearing any cilium (including ciliary dots) in 3T3 (rusty red) and IMCD3 HTR6-GFP (beige) cells. The means ± standard deviations (SDs) of three different sets of cilia from a single experiment are plotted. (B) Cilia length phenotypes. The percentages of cells with cilia at least ≥1.5 μm in length (i.e., longer than ciliary “dots”) are plotted for 3T3 (dark blue) and IMCD3 HTR6-GFP (light blue) cells. The means and SDs from the same images scored in (A) are shown. (C) Ciliary cargo transport phenotypes. The ≥1.5-μm-long cilia in (B) were scored for the percentage (mean ± SD) with strong cilia tip Gli3 in 3T3 cells (dark green) or ciliary HTR6-GFP in IMCD3 cells (light green). Dotted and dashed lines in A–C highlight the positive control siIft88 3T3 and IMCD3 percentages, respectively. (D) Hh signaling phenotypes. % Gli-luciferase signal remaining after siRNA treatment in S12 cells with (black) or without Hh (gray) normalized to 100% for siNTC + Hh. Dotted and dashed lines indicate the siIft88 luciferase levels – and + Hh, respectively. The means and SDs of three independent experiments are plotted. *p ≤ 0.05; **p ≤ 0.01 vs. siNTC (+Hh data only). (E) Quantitation of mRNA knockdown. The % mRNA remaining relative to siNTC (means and SDs of one triplicate experiment) after siRNA treatment in 3T3 (gold) and S12 (light yellow) cells, with remaining Ift88 mRNA levels marked with dotted and dashed lines, respectively. Crosses indicate genes with low to undetectable levels of mRNA as measured by qRT-PCR TaqMan analysis (Ct > 34.5). Genes listed in red were chosen for further validation; blue are controls.
FIGURE 3:
FIGURE 3:
Correlation of S12 phenotype with mRNA knockdown of 12 selected genes. (A) Comparison of mRNA and S12 Hh signaling levels. siRNA knockdown was performed in Hh-treated S12 cells with pooled siRNAs (P) and their four component individual siRNAs (1–4) to the indicated genes. The percentage of mRNA remaining after siRNA knockdown (normalized to NTC as 100%) was measured by TaqMan RT-PCR (yellow), and cilia function was measured using the S12 Gli-luciferase assay + Hh (black). The means and standard deviations (SDs) of three experiments are shown. The dotted line indicates the cutoff value used (60%) for selecting top quality hits in (B). (B) Correlation of cilia function (Hh signaling) and gene knockdown. Same data as in (A) plotted with Gli-luciferase levels (as % siNTC + Hh) on the y-axes and remaining mRNA levels (as % siNTC) on the x-axes. Gray diamonds are pooled siRNAs, black are the four individual siRNAs, and white are the siNTCs. The means and SDs of three independent S12 experiments are shown. R2 is the Spearman’s rho coefficient of correlation. The seven genes in red were considered the top hits due to good correlation.
FIGURE 4:
FIGURE 4:
Effects of Class I gene knockdowns (ciliation defects). (A) Representative images of ciliation defects in Ift88, Ssa2, and mC21orf2 siRNA-treated 3T3 (top) and IMCD3 (bottom) cells stained as in Figure 1B. Scale bar is 10 μm; insets show single and merged channel images of the boxed regions at 2× magnification. (B) Quantification of cilia phenotypes upon Class I siRNA knockdown in ≥200 3T3 cells. At least 200 cilia from images as in (A) were scored as before for % total cilia (magenta), % cilia ≥1.5 μm (blue), and % ≥1.5 μm cilia with ciliary Gli3 accumulation (green). The means and standard deviations (SDs) of three independent experiments are shown. *p ≤ 0.05, **p ≤ 0.01, ***p ≤ 0.001 vs. siNTC. mC21, mC21orf2. (C) Quantification as in (B) except in IMCD3 cells transporting HTR6-GFP instead of Gli3. *p ≤ 0.05, **p ≤ 0.01 vs. siNTC. (D) Representative SEM images of control and Class I–depleted IMCD3 cells. Yellow arrows point to tips of long cilia (note these are rarer in Class I-deficient cells); white arrows point to ciliary stumps. Scale bar is 20 μm in the main panels, and 3× magnifications of the boxed regions are shown underneath. (E) Schematic of SSA2 and mC21ORF2 proteins, drawn approximately to scale. αSol depicts a helical alpha solenoid fold (previously called the TROVE domain; Bateman and Kickhoefer, 2003); LRR, Leu-rich repeat.
FIGURE 5:
FIGURE 5:
Effects of Class III gene knockdowns (abnormally long cilia). (A) Representative images of 3T3 and IMCD3 HTR6-GFP cells depleted of Ptpdc1 (left) or Iqub (right) and stained as in Figure 1B. White arrows indicate cilia tips, and red arrows indicate bulges in cilia (only seen with siIqub). Scale bar is 10 μm; insets show 2× magnification of the boxed regions for 3T3 cells and 1.5× magnification for IMCD3 cells. (B) 3T3 quantitations as in Figure 4B but with NTC, Ptpdc1, and Iqub siRNAs. **p ≤ 0.01 vs. siNTC. (C) IMCD3 HTR6-GFP quantitations as in Figure 4C with NTC, Ptpdc1, and Iqub siRNAs. *p ≤ 0.05 vs. NTC. (D) Histogram of cilia length distribution in Ptpdc1 and Iqub siRNA-transfected 3T3 cells, with the mean cilia lengths in parentheses. (E) As in (D), but with IMCD3 HTR6-GFP cells. (F) Representative SEM images of Ptpdc1- and Iqub-depleted IMCD3 cells. Yellow arrows indicate cilia tips, and red arrows indicate ciliary bulges in Iqub-deficient cells. Scale bar is 10 μm. (G) Schematic of PTPDC1 and IQUB proteins, drawn approximately to scale. αSol depicts a helical solenoid fold; PTP, protein tyrosine phosphatase; Z, Zn2+-binding module; α+β, novel IQUB C-terminal domain.
FIGURE 6:
FIGURE 6:
Effects of Class V gene knockdowns (cilia transport defects). (A) Representative images of NTC, Arl3-, Nme7-, and Ssna1-depleted 3T3 cells stained as in Figure 1B. White and yellow arrows indicate Gli3+ and Gli3 cilia tips, respectively. Scale bar is 10 μm; insets show 2× magnification of the boxed regions with individual and merged channels. (B) 3T3 cilia quantitations following Class V gene depletion. **p ≤ 0.01 vs. NTC. (C) Representative images of Class V–depleted IMCD3 HTR6-GFP cells, with white arrows indicating cilia tips. (D) IMCD3 cilia quantitations. *p ≤ 0.05, **p ≤ 0.01 vs. NTC. (E) SEM of Nme7- and Ssna1-depleted IMCD3 cells. Upper insets on the right of each panel show 2× magnified cilia typical of the majority, whereas lower insets show examples of the few abnormally bent or kinked cilia. Yellow arrows point to cilia tips. Scale bar is 10 μm. Schematics of SSNA1 (F) and NME7 (G) protein domains, drawn approximately to scale. CC, coiled-coil.
FIGURE 7:
FIGURE 7:
Class V hits localize to centrosomes. (A) Serum-starved 3T3 Nme7-GFP (a) and Ssna1-GFP (e) stable cell lines were stained for cilia (Ac-Tub, Cy5 channel) and centrosomes (γTub, red channel) with GFP fluorescence detected in the green channel. SSNA1 (± GFP tag) aggregated in inclusion bodies (red arrow in e) even when stably expressed, so low SSNA1-GFP expressers were selected by flow cytometry and further siSsna1-transfected to enable centrosome detection. Serum-starved IMCD3 HTR6-GFP cells were stained for nuclei (DAPI, blue), centrosomes (γTub, Cy5 channel, pseudo colored green), and with anti-NME7 (b) or anti-SSNA1 antibodies (f) (Cy3, red channel). 3T3 wild type (wt) cells costained with anti-NME7 (c and d) or anti-SSNA1 (g and h) in red and anti-acetylated and γ-tubulins in green following siNTC (c and g), siNme7 (d), or siSsna1 (h) transfection. Scale bar is 10 μm, and insets show 2× magnification of the boxed region. NME7 staining (red) in nonstarved 3T3 cells (B) and SSNA1 staining in nonciliated PC3 cells (C) during the indicated stages of mitosis, as identified by DAPI (blue) and γ-tubulin (green) staining. Scale bar is 15 μm in (B) and (C). White arrows point to centrosomes. Note the anaphase panel in (B) has both acetylated and γ-tubulin staining.
FIGURE 8:
FIGURE 8:
Class V hits differentially affect GPCR transport. (A) Effect of Class V knockdown on ciliary accumulation of GFP-SMO. GFP-SMO 3T3 stable cells depleted of Class V genes were stimulated with Hh for 16 h, fixed, and stained for acetylated tubulin in red (or bottom left panels) and an unpurified anti-SMO antiserum (the centrosomal reactivity is present in the preimmune serum and not related to SMO) in the cyan Cy5 channel (or bottom middle panels), with GFP fluorescence in green (or bottom right). Scale bar is 10 μm; insets show 2× magnification of the boxed regions; arrows indicate cilia tips. (B) Quantitation of the anti-SMO signal in ∼300 cilia stained as in (A) with (black) or without (gray) Hh treatment. *p ≤ 0.05; **p ≤ 0.01 vs. siNTC + Hh. (C) Differential effects of Class V knockdown on GPCR-GFP localization. IMCD3 HTR6-GFP (left), IMCD3 SSTR3-GFP (middle), and RPE1 MCHR1-GFP (right) cells were transfected with NTC or Class V siRNAs as indicated and were serum starved for 16 h. The intrinsic GFP fluorescence is shown, with arrows pointing to cilia tips identified by Ac-tubulin staining. Bottom right panel shows HTR6-GFP in IMCD3 Rab1b-depleted cells for comparison with siNme7. (D) Western blot of IMCD3 HTR6-GFP (top panels) or GFP-SMO 3T3 cells (bottom panels) following 64-h siRNA transfection and 16-h serum starvation. Lysates (50 μg) were loaded on an 18% Tris–glycine gel and immunoblotted with anti-GFP for GPCRs, tubulin loading control, and anti-transferrin receptor (Trf Rec). NTCp is a second nontargeting pool of siRNAs used as an extra control and for statistical analysis. (E) Quantitation of four (or eight for Ssna1) experiments such as the one shown in (D), normalized to tubulin and NTC pool. *p ≤ 0.05; **p ≤ 0.01 vs. NTC. Knockdown efficiencies of SSNA1 and NME7, for which antibodies are available, are shown in Supplemental Figure S4, F–H. (F) Comparison of SSNA1 knockdown in IMCD3 HTR6-GFP (left) or 3T3 wild-type (wt) cells (right) with 16-h lysosomal protease inhibitor (Lysos PI; leupeptin at 10 μg/ml and 5 μM pepstatin A) or proteasomal inhibitor treatment (MG132; 10 μM). The lysosomal protein LAMP1 and endocytic transferrin receptor (Trf Rec) are shown for comparison, with tubulin as the loading control (50 μg of lysates on 18% gels). SSNA1 (∼14 kDa) was barely detectable in IMCD3 cells (see Supplemental Figure S4F for a higher loaded blot), but is more highly expressed in 3T3 cells. Western blot was performed as in (D).
FIGURE 9:
FIGURE 9:
Different classes of cilia genes have distinct effects on Gli3 processing and degradation. (A–C, left panels) S12 cells transfected with the indicated siRNAs for a total of 72 h were treated with (+) or without (–) Hh for 16 h prior to lysis and Western blotting with anti-Gli3N antibody 6F5 as described (Wen et al., 2010) to detect both full-length Gli3 (Gli3FL) and the truncated Gli3 repressor (Gli3R). (D) S12, 3T3, IMCD3, and IMCD3 HTR6-GFP cells – or + Hh were blotted as in (A–C). All blots shown are representative of at least three to five experiments. Molecular weight markers in kilodaltons are indicated on the right. Tubulin antibody 1A2 (Tub) served as the loading control. mC21, mC21orf2; Dyn, Dync2h1. (A–D, right panels) Quantitation of Gli3FL (left) and Gli3R (right graphs) from ≥3 blots were quantitated and normalized to the tubulin loading control and then to the NTC siRNA –Hh. The means and standard deviations (SDs) of ≥3 independent experiments for each siRNA are plotted with their values relative to siNTC –Hh above each bar. Gray bars are –Hh; black bars are +Hh.

References

    1. Ahmed NT, Gao C, Lucker BF, Cole DG, Mitchell DR. ODA16 aids axonemal outer row dynein assembly through an interaction with the intraflagellar transport machinery. J Cell Biol. 2008;183:313–322. - PMC - PubMed
    1. Avidor-Reiss T, Maer AM, Koundakjian E, Polyanovsky A, Keil T, Subramaniam S, Zuker CS. Decoding cilia function: defining specialized genes required for compartmentalized cilia biogenesis. Cell. 2004;117:527–539. - PubMed
    1. Badano JL, Mitsuma N, Beales PL, Katsanis N. The ciliopathies: an emerging class of human genetic disorders. Annu Rev Genomics Hum Genet. 2006;7:125–148. - PubMed
    1. Bateman A, Kickhoefer V. The TROVE module: a common element in Telomerase, Ro and Vault ribonucleoproteins. BMC Bioinformatics. 2003;4:49. - PMC - PubMed
    1. Berbari NF, Johnson AD, Lewis JS, Askwith CC, Mykytyn K. Identification of ciliary localization sequences within the third intracellular loop of G protein-coupled receptors. Mol Biol Cell. 2008;19:1540–1547. - PMC - PubMed

Publication types

MeSH terms