. 2011 Feb 2;31(5):1905-18.
doi: 10.1523/JNEUROSCI.3488-10.2011.

Gateways of ventral and dorsal streams in mouse visual cortex

Affiliations

Gateways of ventral and dorsal streams in mouse visual cortex

Quanxin Wang et al. J Neurosci. .

Abstract

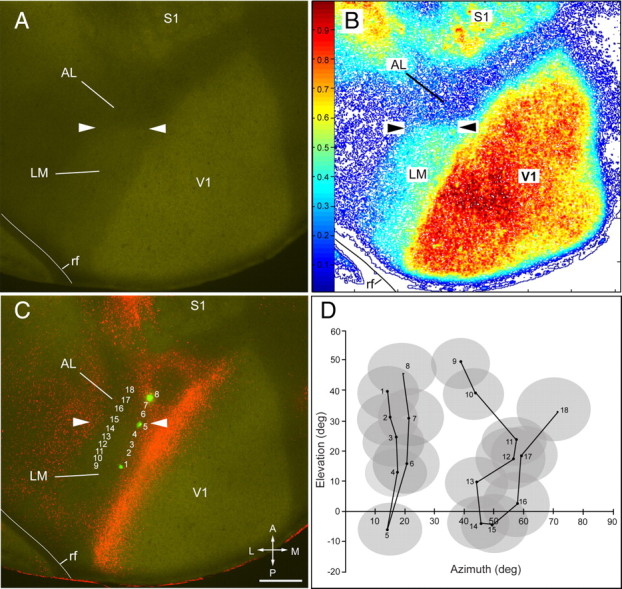
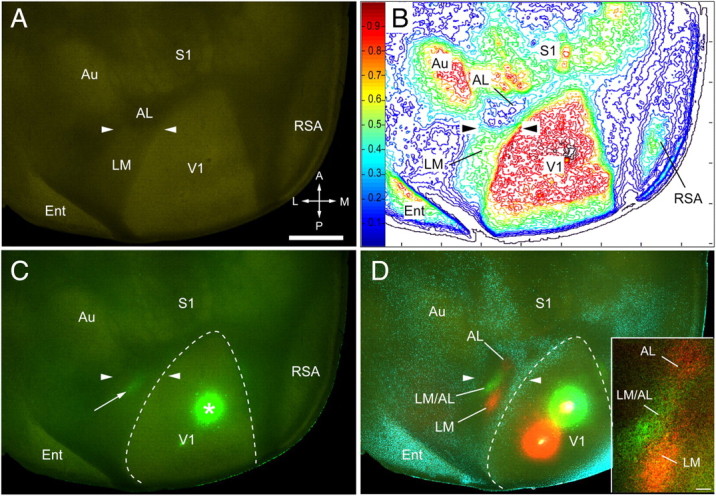
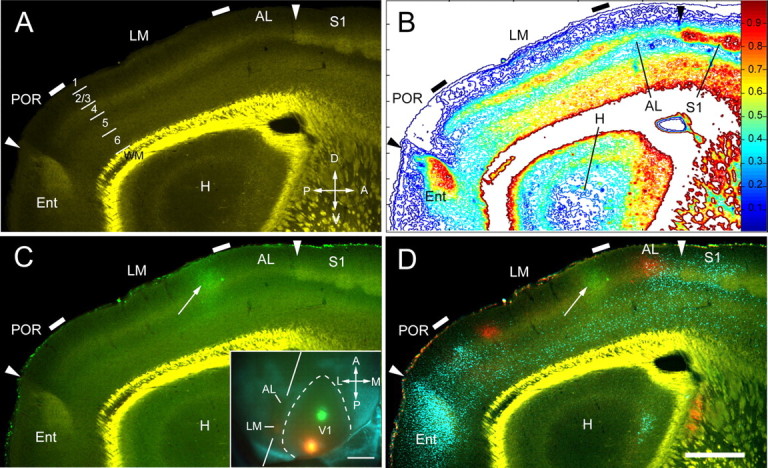
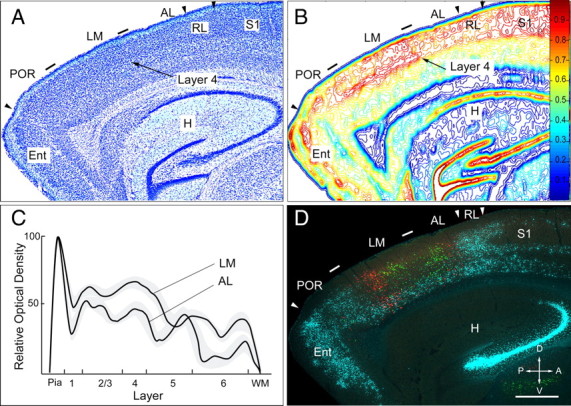
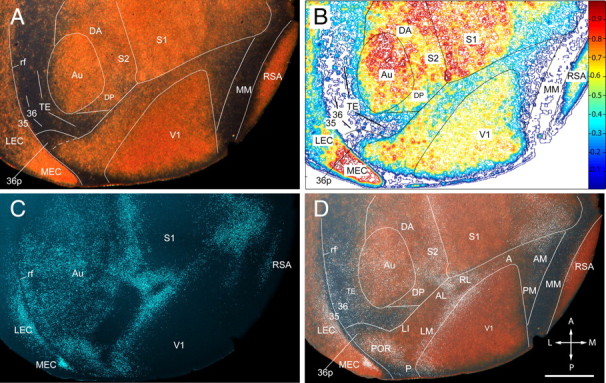
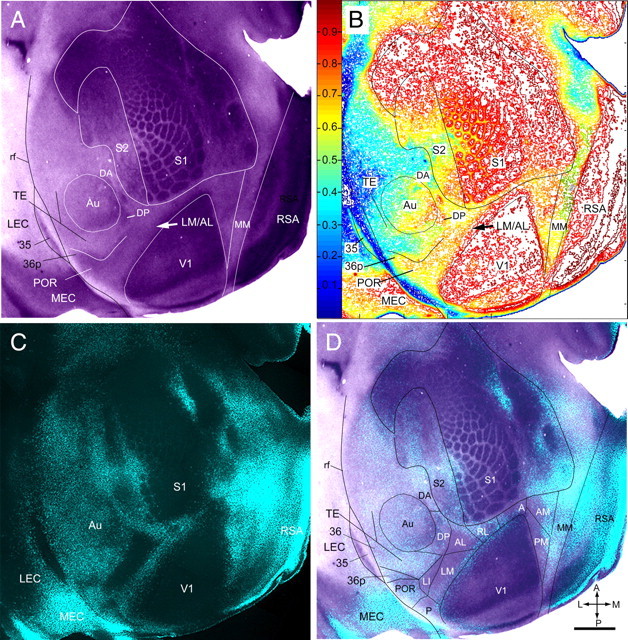
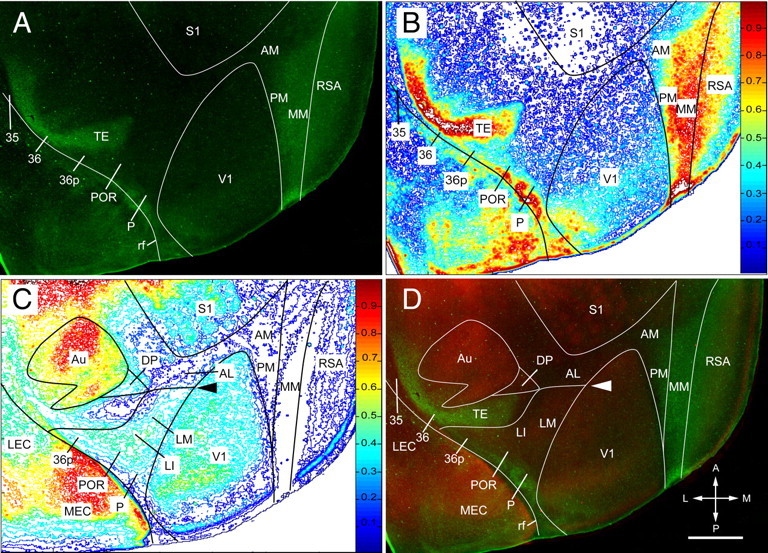
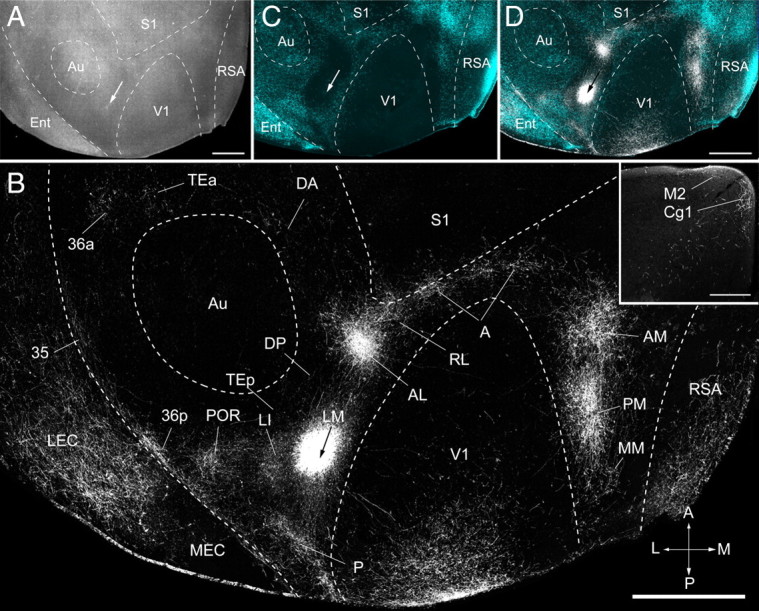
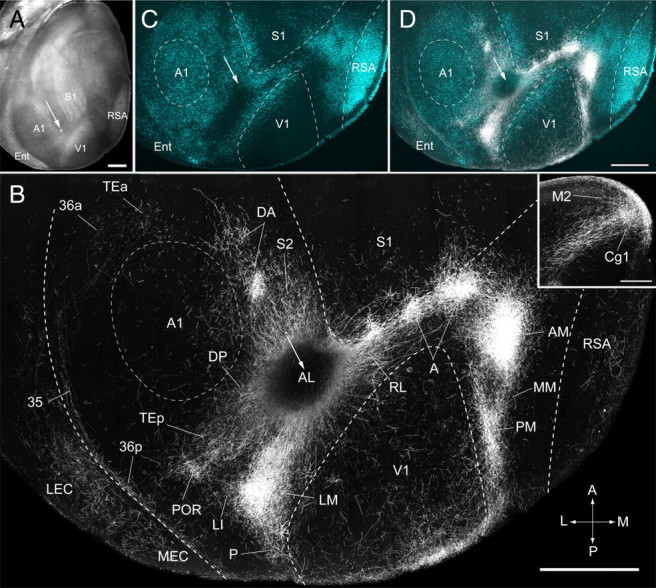
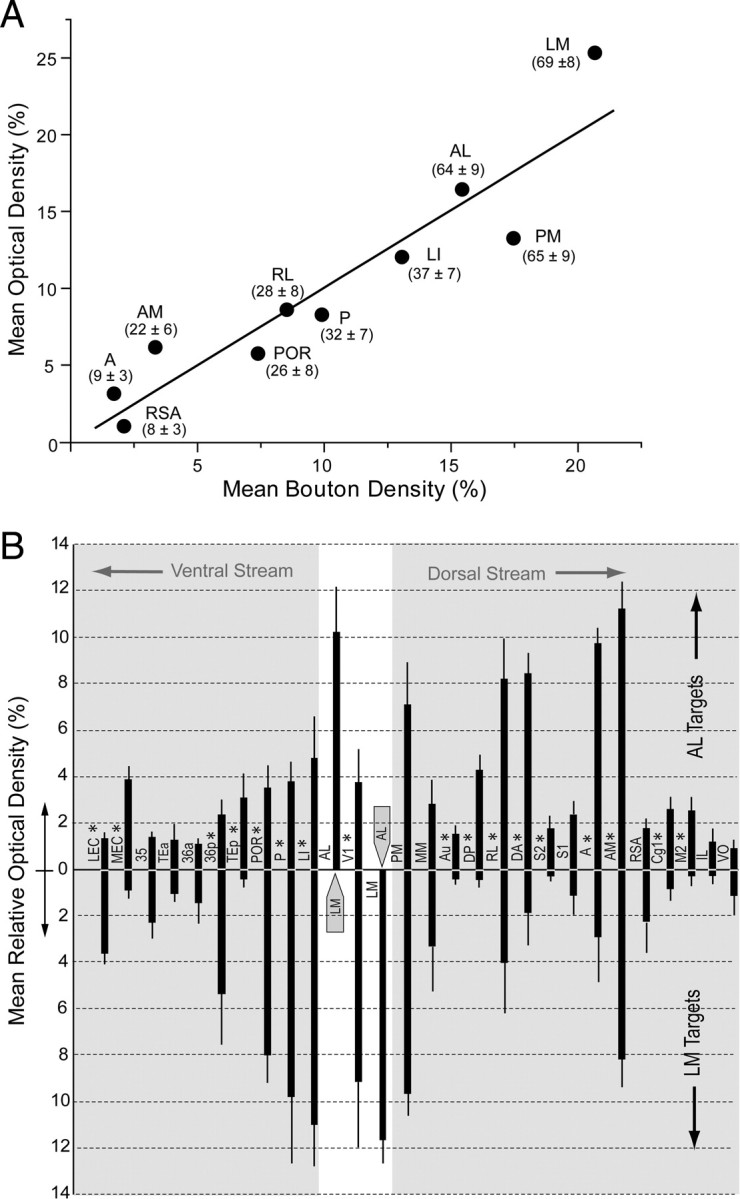
It is widely held that the spatial processing functions underlying rodent navigation are similar to those encoding human episodic memory (Doeller et al., 2010). Spatial and nonspatial information are provided by all senses including vision. It has been suggested that visual inputs are fed to the navigational network in cortex and hippocampus through dorsal and ventral intracortical streams (Whitlock et al., 2008), but this has not been shown directly in rodents. We have used cytoarchitectonic and chemoarchitectonic markers, topographic mapping of receptive fields, and pathway tracing to determine in mouse visual cortex whether the lateromedial field (LM) and the anterolateral field (AL), which are the principal targets of primary visual cortex (V1) (Wang and Burkhalter, 2007) specialized for processing nonspatial and spatial visual information (Gao et al., 2006), are distinct areas with diverse connections. We have found that the LM/AL border coincides with a change in type 2 muscarinic acetylcholine receptor expression in layer 4 and with the representation of the lower visual field periphery. Our quantitative analyses also show that LM strongly projects to temporal cortex as well as the lateral entorhinal cortex, which has weak spatial selectivity (Hargreaves et al., 2005). In contrast, AL has stronger connections with posterior parietal cortex, motor cortex, and the spatially selective medial entorhinal cortex (Haftig et al., 2005). These results support the notion that LM and AL are architecturally, topographically, and connectionally distinct areas of extrastriate visual cortex and that they are gateways for ventral and dorsal streams.


Figures

Figure 1.
Figure 1.
LM/AL border identified by the transition of m2AChR expression coincides with receptive field recordings from lower visual field. A, Expression of m2AChR in a tangential section through layer 4 in left adult visual cortex. The arrowheads mark the LM/AL border between the m2AChR-expressing area LM and the nonexpressing area AL. B, Density contour map of m2AChR expression showing a ≥20% reduction of immunostaining at the LM/AL border (arrowheads). C, D, Overlay of m2AChR with FR-labeled callosal connections. Numbered rows in C indicate recording sites in areas LM and AL. The receptive fields at site 1 (posterior green mark) are in the upper visual field (D), drop to the lower visual field (site 5, middle green mark) at the LM/AL border (C, D, arrowheads), and reverse back to upper fields (site 8, anterior green mark) in AL (C, D). A second series of recordings (sites 9–18) shows a similar trend with a reversal at site 15. Note that the recordings sites 5 and 15 coincide with the transition in m2AChR expression (arrowheads), showing that the LM/AL border represents the lower visual field periphery, which was previously identified as the boundary between areas LM and AL (Wang and Burkhalter, 2007). rf, Rhinal fissure; A, anterior; M, medial; P, posterior; L, lateral. Scale bar, 0.5 mm.
Figure 2.
Figure 2.
Chemoarchitectonic LM/AL border identified by m2AChR expression and connections from lower visual field of V1. A, m2AChR expression in tangential section through layer 4 of left adult cerebral cortex, showing an abrupt decrease in labeling intensity in the belt on the lateral side of V1 (arrowheads). B, Density contour map of m2AChR expression showing a ≥20% reduction of immunostaining at the LM/AL border (arrowheads). C, Overlay of m2AChR (green-yellow immunolabeling) with lower field input from V1 labeled by anterograde transport after injection of FE into V1 (asterisk). The bright green projection (arrow) coincides with the LM/AL border marked by arrowheads. D, Overlay of m2AChR expression with the projections from the lower quadrant of the visual field of V1 (green FE-labeled axons), the upper quadrant of V1 (red FR-labeled axons), and callosal connections (blue bisbenzimide-labeled cell bodies). The red (FR) and green (FR) spots in V1 mark the injection sites. The yellow centers indicate dye saturation at the center of injection sites. Note that the green projection from the lower field labels a single site that coincides with the LM/AL border (arrowheads) marked by m2AChR expression (C). Inset, Lower field projection from V1 (green) to the LM/AL border is flanked by two red clusters from the upper field of V1 terminating in LM and AL. Ent, Entorhinal cortex; A, anterior; M, medial; P, posterior; L, lateral. Scale bars: A, 1 mm; D, inset, 0.1 mm.
Figure 3.
Figure 3.
Chemoarchitectonic LM/AL border shown by m2AChR expression in parasagittal section coincides with V1 inputs from lower visual field. A, m2AChR expression in parasagittal section showing moderate to strong immunofluorescence in layers 1, 2, 4, deep 5, and 6 of areas LM and AL. Note the transition in the thickness of layer 4 at the LM/AL and LM/POR borders (tick marks). The posterior arrowhead indicates the border between POR and entorhinal cortex (Ent). The anterior arrowhead marks the AL/S1 border. Bright yellow represents nonspecific labeling of myelinated fibers in white matter. A, anterior; V, ventral; P, posterior; D, dorsal. B, Density contour map of m2AChR expression showing a ≥20% reduction of immunostaining and a decrease in the width of staining in layer 4 that coincides with the LM/AL border (tick mark). C, Overlay of anterogradely FE-labeled connections from the lower field of V1 shows that the green projection site (arrow) is aligned with a transition in the width of m2AChR staining in layer 4 that coincides with the LM/AL border. Inset, In situ image of green and red injection sites into V1. The blue pattern represents callosal projections. The oblique lines indicate the plane of quasi parasagittal sectioning. A, anterior; M, medial; P, posterior; L, lateral. Scale bar, 1 mm. D, Overlay of m2AChR expression (faint green/yellow staining) with V1 projections from lower (green, FE) and upper (red, FR) fields and callosal connections (blue, bisbenzimide). Note that the green projection (arrow) coincides with the LM/AL border (tick mark). The posterior red projection is near the posterior border of the acallosal region (i.e., border with POR), whereas the anterior red projection falls into AL. The bright yellow color represents nonspecific staining of white matter. H, Hippocampus; Ent, entorhinal cortex. Scale bar, 0.5 mm.
Figure 4.
Figure 4.
Cytoarchitectonic LM/AL border coincides with lower visual field input from V1. A, Nissl-stained parasagittal section. Tick marks indicate LM/AL and LM/POR borders. Within LM, there are no clear cytoarchitectonic differences between layers 2/3 and 4. In deep layers of LM, cells are less densely packed. In AL, layer 4 appears more distinct from layers 2/3 and 5. These differences are more readily apparent by marking the LM/AL border through tracing of lower field inputs to V1 (D). The arrowheads indicate the POR/Ent, AL/RL, and RL/S1 borders. B, Density contour map of Nissl-stained cell bodies shown in A. The optical density of layers 2–4 of LM is 10–20% higher than in AL. The difference is most prominent in layer 4. The map also indicates that layer 4 in AL is thinner than in LM. C, Line scan of optical density across layers in LM and AL. The average ± SEM (gray regions) density in layers 2–4 of LM is higher and layer 4 is wider than in AL. WM, White matter. D, Fluorescence image of section adjacent to the Nissl-stained section depicted in A, showing retrogradely labeled callosal connections (blue) and microsphere-labeled neurons that project to the upper (red) and lower (green) visual field representation of V1. Both green patches are flanked by two red clusters of neurons at posterior and anterior edge of the acallosal region. Notice that the green patches are closer together on the posterior and anterior sides of the LM/AL border (tick mark) shown in A and B. H, Hippocampus; Ent, entorhinal cortex; A, anterior; V, ventral; P, posterior; D, dorsal. Scale bar, 0.5 mm.
Figure 5.
Figure 5.
Regional pattern of neurofilament protein (SMI-32) expression in layer 4 of adult mouse cerebral cortex. A, Dark-field image of SMI-32-immunolabeled tangential section showing the posterior half of the left cerebral cortex. The gold-colored labeling shows strong SMI-32 expression in V1 (note that the sections are cut transversely at the posterior pole, which exposes the weakly labeled upper layers), Au, and S1, as well as in RSA and MEC. Moderate SMI-32 expression is found in the cortex between S1 and Au, which contains S2, DP, and DA. Moderate labeling is also observed in LEC and throughout the belt on the lateral side of V1. Much weaker expression is seen in the acallosal region on the medial side of V1. Weak labeling is also found at the lateral (ventral) tip of the belt in a region that corresponds to area 36p. Extremely sparse SMI-32 expression is present in an L-shaped region in TE and the perirhinal areas 36 and 35 on the lateral side of Au. Little detectable SMI-32 expression is seen in a longitudinal MM strip adjacent to RSA. B, Density contour map of SMI-32 expression providing a quantitative image of the staining shown in A. C, Fluorescence image of retrogradely bisbenzimide-labeled callosal connections in the same section shown in A. D, Overlay of SMI-32 labeling shown in A with white, false-colored callosal connections shown in C. The SMI-32-expressing belt around V1 is shown in an overlay of the fixed pattern of callosal connections. Callosal landmarks were used as reference for identification of areas V1, P, POR, LM, LI, AL, RL, A, AM, and PM, which were previously described by topographic mapping (Wang and Burkhalter, 2007). Labeling in P is nonuniform because of transverse sectioning of weakly labeled upper layers. Labeling of the belt's most lateral tip is weaker and outlines the weakly topographic area 36p (Wang and Burkhalter, 2007). In the rest of the uniformly callosally connected cortex, SMI-32 expression is found in a region that extends from the posterior/dorsal corner of Au into the gap between S1 and Au. This region includes DP, DA, and S2. Very sparse SMI-32 staining is shown in the L-shaped belt on the posterior and lateral side of Au, which includes TE, field 36, and field 35. Extremely sparse staining is present in MM. rf, Rhinal fissure; A, anterior; M, medial; P, posterior; L, lateral. Scale bar, 1 mm.
Figure 6.
Figure 6.
Regional pattern of m2AChR expression in layer 4 of adult mouse cerebral cortex. A, m2AChR-immunolabeled tangential section showing most of the left cerebral cortex. Expression of m2AChR is strong in V1, S1, RSA, and MEC. S2 shows three to five rows of m2AChR-expressing ring-like structures. Moderate staining is found in a belt on the lateral side of V1, extending from 36p to the LM/AL border (arrow) at which the labeling density abruptly decreased and continued around the tip to the medial side of V1. Adjacent to the triangular field on the medial side of V1, we found an unlabeled longitudinal strip, which was previously identified as MM (Wang and Burkhalter, 2007). Moderate nonuniform m2AChR expression is found in Au (identified by myeloarchitectonic borders) and in a region designated DP, adjacent to the posterior/dorsal corner of Au. Weak staining is found on the lateral (ventral) side of Au in intermediate parts of TE and field 36. B, Density contour map of m2AChR expression providing a quantitative image of the staining shown in A). The arrow marks a ≥20% difference in m2AChR expression at the LM/AL border (arrow). C, Fluorescence image of retrogradely bisbenzimide-labeled callosal connections in the same section shown in A. D, Overlay of m2AChR expression shown in A with callosal connections shown in C. The m2AChR-expressing belt around V1 is shown to overlay the fixed pattern of callosal connections. These landmarks were used as references for identifying areas V1, P, POR, 36p, LM, LI, AL, RL, A, AM, and PM, which were previously described by topographic mapping (Wang and Burkhalter, 2007). Note that m2AChR expression is weaker in AL (better seen in A and B), which lies in the anterior part of the large acallosal region on the lateral side of V1. Slightly stronger m2AChR expression is observed in acallosal cortex that contains AM and PM on the medial side of V1. In the more uniformly callosally connected cortex, m2AChR expression is present in DP but is absent in DA in the anterior part of the dorsal auditory belt. Very sparse m2AChR staining is present in the L-shaped belt on the posterior and lateral (ventral) side of Au, which includes TE and area 36. Considerable m2AChR expression is found in the acallosal area 35. rf, Rhinal fissure; A, anterior; M, medial; P, posterior; L, lateral. Scale bar, 1 mm.
Figure 7.
Figure 7.
Complementary patterns of RALDH3 and m2AChR expression. A, RALDH3 expression in layer 4 of cerebral cortex in an 11-d-old mouse. Intense staining is found in the center of MM. RALDH3 expression weakens in lateral parts of PM and AM as well as in medial parts of RSA. Strong expression is present in a temporal association (TE) and perirhinal cortex (area 36). Expression of RALDH3 is slightly weaker in posterior parts of P, POR, and 36p close to the rhinal sulcus. No detectable expression of RALDH3 is observed in area 35. B, Density contour map of RALDH3 expression, providing a quantitative image of the staining shown in A. C, Density contour map of m2AChR immunofluorescence of double-immunostained section shown in A. A ≥20% difference in staining intensity is shown at the LM/AL border (arrowhead). D, Overlay of m2AChR (red) and RALDH3 (green) expression in the same section immunolabeled with two different antibodies, showing mainly complementary staining patterns. The LM/AL border is indicated with an arrowhead. rf, Rhinal fissure; A, anterior; M, medial; P, posterior; L, lateral. Scale: 1 mm.
Figure 8.
Figure 8.
Connections of area LM of adult mouse visual cortex. A, Tangential section through layer 2/3 of left posterior cerebral cortex showing injection site (arrow) in a dark-field image of myeloarchitecture. B, Dark-field image of axonal projections labeled by BDA injection (arrow) into LM. The projections to areas P, POR, LI, AL, RL, A, AM, and PM of the visual cortex are identified by their location relative to fixed retrogradely bisbenzimide-labeled callosal landmarks (Wang and Burkhalter, 2007) shown in the overlay in C and D. V1, S1, and Au were identified by their distinct myeloarchitectures. RSA, MEC, LEC, Cg1 (inset), and M2 (inset) were identified based on cytoarchitectonic features (Franklin et al., 2007). Projections to TEa, 36p, and 35 were identified by their relative location to SMI-32-, m2AChR-, and RALDH3-labeled/unlabeled regions (see Results for details). DA was identified by its location in the m2AChR-negative region at the dorsal/anterior margin of Au. MM was identified by its location in the SMI-32-negative/m2AChR-negative/RALDH3-positive strip in callosally connected cortex. Ent, Entorhinal cortex; A, anterior; M, medial; P, posterior; L, lateral. Scale bars: A, B, D, 1 mm; B, inset, 0.3 mm.
Figure 9.
Figure 9.
Connections of area AL of adult mouse visual cortex. A, Tangential section through layer 2/3 of left posterior cerebral cortex showing injection site (arrow) in a dark-field image of myeloarchitecture. B, Dark-field image of axonal projections labeled by BDA injection (injection site is dark because of quenching by the brown reaction product) into AL (arrow). C, D, The projections to areas P, POR, LI, LM, RL, A, AM, and PM of the visual cortex are identified by their location relative to retrogradely bisbenzimide-labeled callosal connections (C) and overlaying these fixed landmarks on the BDA-labeled projection pattern (D). V1, S1, and Au were identified by their distinct myeloarchitectures. RSA, MEC, LEC, Cg1 (inset), and M2 (inset) were identified based on cytoarchitectonic features (Paxinos and Franklin, 2001). S2 was identified based on distinctive m2AChR expression (see Fig. 6A). DP was identified as the SMI-32-positive/m2AChR-positive region at the dorsal/posterior edge of Au. DA was identified by location in the m2AChR-negative region at the dorsal/anterior margin of Au. Projections to TE (TEa, TEp), 36 (36p), and 35 were identified by their location relative to SMI-32-, m2AChR-, and RALDH3-labeled/unlabeled regions (see text for details). MM was identified by its location in the m2AChR-negative/RALDH3-positive strip in callosally connected cortex. Ent, Entorhinal cortex; A, anterior; M, medial; P, posterior; L, lateral. Scale bars: A, B, D, 1 mm; B, inset, 0.3 mm.
Figure 10.
Figure 10.
Relative strengths of inputs from areas LM and AL to targets in ventral and dorsal cerebral cortex. A, Positive significant (R2 = 0.94, p < 0.0001) correlation between average bouton density (3 fields in layers 2–4 per projection in 3 mice) and average optical density (3 fields in layers 2–4 per projection in 3 mice) of BDA-labeled connections in 10 targets of V1. Numbers in parentheses indicate the average ± SEM number of boutons/100 μm2 counted in three sections across each projection field in three mice. B, Relative strength (mean optical density/projection as a percentage of the sum of optical densities of all projections ± SEM) of projections from LM (downward facing bars) and AL (upward facing bars) in different targets of the cortex. Projections from LM more strongly innervate targets in temporal cortex, whereas AL more strongly innervates parietal and frontal cortex, suggesting that LM and AL are gateways to ventral (gray region on the left side) and dorsal (gray region on the right side) streams, respectively. Injected areas LM and AL are indicated by gray arrows. *Significant (p < 0.05) differences.

References

    1. Ahmed B, Anderson JC, Douglas RJ, Martin KAC, Nelson JC. Polyneuronal innervation of spiny stellate neurons in cat visual cortex. J Comp Neurol. 1994;341:39–49. - PubMed
    1. Alloway KD. Information processing stream in rodent barrel cortex: the differential functions of barrel and septal circuits. Cereb Cortex. 2008;18:979–989. - PubMed
    1. Aronoff R, Matyas F, Mateo C, Ciron C, Schneider B, Petersen CC. Long-range connectivity of mouse primary somatosensory barrel cortex. Eur J Neurosci. 2010;31:2221–2233. - PubMed
    1. Beckstead RM. An autoradiographic examination of corticocortical and subcortical projections of the mediodorsal-projection (prefrontal) cortex in the rat. J Comp Neurol. 1979;184:43–61. - PubMed
    1. Benison AM, Rector DM, Barth DS. Hemispheric mapping of secondary somatosensory cortex in the rat. J Neurophysiol. 2007;97:200–2007. - PubMed

Publication types

LinkOut - more resources