. 2011 Feb;22(2):246-52.
doi: 10.1681/ASN.2010050471.

Predominance of intraglomerular T-bet or GATA3 may determine mechanism of transplant rejection

Affiliations

Predominance of intraglomerular T-bet or GATA3 may determine mechanism of transplant rejection

Qiquan Sun et al. J Am Soc Nephrol. 2011 Feb.

Abstract

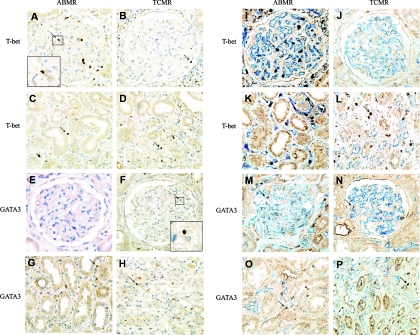
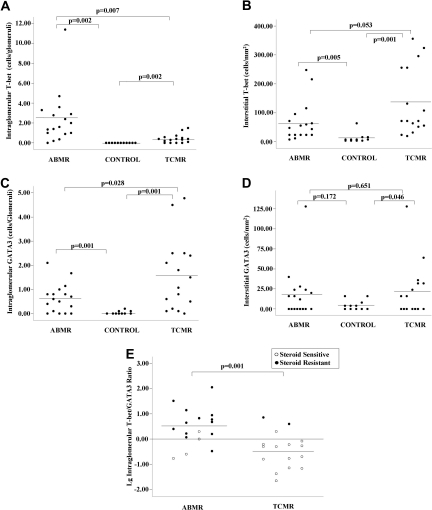
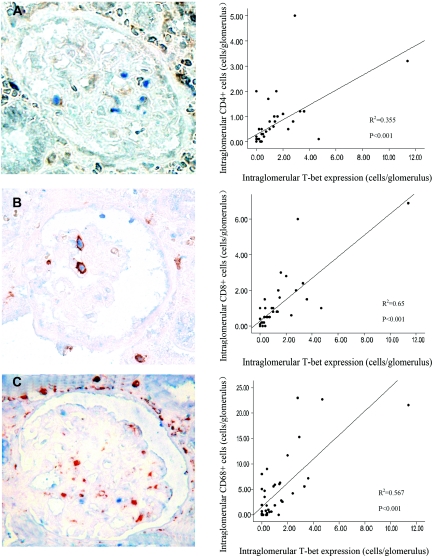
The transcription factors T-bet and GATA3 determine the differentiation of helper T cells into Th1 or Th2 cells, respectively. An altered ratio of their relative expression promotes the pathogenesis of certain immunological diseases, but whether this may also contribute to the pathogenesis of antibody-mediated rejection (ABMR) versus T cell-mediated rejection (TCMR) is unknown. Here, we characterized the intragraft expression of T-bet and GATA3 and determined the correlation of their levels with the presence of typical lesions of ABMR and TCMR. We found a predominant intraglomerular expression of T-bet in patients with ABMR, which was distinct from that in patients with TCMR. In ABMR, interstitial T-bet expression was typically located in peritubular capillaries, although the overall quantity of interstitial T-bet was less than that observed in TCMR. The expression of intraglomerular T-bet correlated with infiltration of CD4+ and CD8+ lymphocytes, which express T-bet, as well as intraglomerular CD68+ monocyte/macrophages, which do not express T-bet. The predominance of intraglomerular T-bet expression relative to GATA3 expression associated with poor response to treatment with bolus steroid. In summary, predominance of intraglomerular T-bet expression correlates with antibody-mediated rejection and resistance to steroid treatment.


Figures

Figure 1.
Figure 1.
Intragraft T-bet and GATA3 expression is different in renal allografts with different mechanisms of acute rejection. Positive staining is labeled with a brown color. (A) Intraglomerular T-bet expression in ABMR. (B) Intraglomerular T-bet expression in TCMR. (C) Interstitial T-bet expression in ABMR. (D) Interstitial T-bet expression in TCMR. (E) Intraglomerular GATA3 expression in ABMR, which is negative in this case. (F) Intraglomerular GATA3 expression in TCMR. (G) Interstitial GATA3 expression in ABMR. (H) Interstitial GATA3 expression in TCMR. Compared with TCMR group, the quantity of intraglomerular T-bet was higher, whereas GATA3 was lower in the ABMR group. In contrast, the amount of interstitial T-bet was lower in the ABMR group. (I through P) Costaining with CD31 (to highlight capillaries) shows the location of T-bet and GATA3. In the ABMR group, the majority of T-bet+ cells were located in the peritubular capillaries area; however, in the TCMR group, T-bet+ cells were scattered within the interstitial area. The incidence of interstitial GATA3 was similar in both ABMR and TCMR groups. Magnification was ×400 (+ enlarged image).
Figure 2.
Figure 2.
The predominance of intragraft T-bet or GATA3 correlates with different mechanisms of acute rejection and different responses to steroid treatment. (ABMR, n = 17; TCMR, n = 16; control, n = 11). (A) Quantitative measurement of the number of intraglomerular T-bet expression in acute rejection. (B) Quantification of interstitial T-bet expression (cells/mm2) in graft biopsies displaying acute rejection. (C) Quantitative measurement of intraglomerular GATA3 expression in acute rejection (cells/glomerulus). (D) Quantification of interstitial GATA3 expression (cells/mm2) in graft biopsies displaying acute rejection. (E) Ratio of intraglomerular T-bet/GATA3 (log) in acute rejection and its relationship with response to steroid treatment. To calculate the ratio, values of less than 0.1 cell/glomerulus were recorded as 0.1 cell/glomerulus. The black circles represent steroid-resistant cases, and the white circles represent steroid-sensitive cases.
Figure 3.
Figure 3.
Intraglomerular T-bet expression strongly correlates with CD4+, CD8+, or CD68+ cell infiltration. (A) Costaining of T-bet (blue) and CD4 (brown) and scatter plot to the right demonstrating the correlation between T-bet and CD4. (B) Costaining of T-bet (blue) and CD8 (brown), scatter plot demonstrating correlation between T-bet and CD8. (C) Costaining of T-bet (blue) and CD68 (brown), and scatter plot to the right demonstrating correlation between T-bet and CD68. T-bet was expressed in some of the CD4+ or CD8+ cells and was correlated with CD4+ and CD8+ cell count. Although no CD68+ cells coexpressed T-bet, the intraglomerular expression of T-bet was strongly correlated with intraglomerular CD68+ cell infiltration. Magnification was ×400.

References

    1. Wolfe RA, Ashby VB, Milford EL, Ojo AO, Ettenger RE, Agodoa LY, Held PJ, Port FK: Comparison of mortality in all patients on dialysis, patients on dialysis awaiting transplantation, and recipients of a first cadaveric transplant. N Engl J Med 341: 1725–1730, 1999 - PubMed
    1. Colvin RB: Antibody-mediated renal allograft rejection: Diagnosis and pathogenesis. J Am Soc Nephrol 18: 1046–1056, 2007 - PubMed
    1. Terasaki PI, Cai J: Humoral theory of transplantation: Further evidence. Curr Opin Immunol 17: 541–545, 2005 - PubMed
    1. Noble A: Review article: Molecular signals and genetic reprogramming in peripheral T-cell differentiation. Immunology 101: 289–299, 2000 - PMC - PubMed
    1. Farrar JD, Asnagli H, Murphy KM: T helper subset development: Roles of instruction, selection, and transcription. J Clin Invest 109: 431–435, 2002 - PMC - PubMed

Publication types