. 2011 Feb;22(2):317-26.
doi: 10.1681/ASN.2009060615.

Distinct macrophage phenotypes contribute to kidney injury and repair

Affiliations

Distinct macrophage phenotypes contribute to kidney injury and repair

Sik Lee et al. J Am Soc Nephrol. 2011 Feb.

Abstract

The ischemically injured kidney undergoes tubular cell necrosis and apoptosis, accompanied by an interstitial inflammatory cell infiltrate. In this study, we show that iNos-positive proinflammatory (M1) macrophages are recruited into the kidney in the first 48 hours after ischemia/reperfusion injury, whereas arginase 1- and mannose receptor-positive, noninflammatory (M2) macrophages predominate at later time points. Furthermore, depletion of macrophages before ischemia/reperfusion diminishes kidney injury, whereas depletion at 3 to 5 days after injury slows tubular cell proliferation and repair. Infusion of Ifnγ-stimulated, bone marrow-derived macrophages into macrophage-depleted mice at the time of kidney reperfusion restored injury to the level seen without macrophage depletion, suggesting that proinflammatory macrophages worsen kidney damage. In contrast, the appearance of macrophages with the M2 phenotype correlated with the proliferative phase of kidney repair. In vitro studies showed that IFNγ-stimulated, proinflammatory macrophages begin to express markers of M2 macrophages when cocultured with renal tubular cells. Moreover, IL-4-stimulated macrophages with an M2 phenotype, but not IFNγ-stimulated proinflammatory macrophages, promoted renal tubular cell proliferation. Finally, tracking fluorescently labeled, IFNγ-stimulated macrophages that were injected after injury showed that inflammatory macrophages can switch to an M2 phenotype in the kidney at the onset of kidney repair. Taken together, these studies show that macrophages undergo a switch from a proinflammatory to a trophic phenotype that supports the transition from tubule injury to tubule repair.


Figures

Figure 1.
Figure 1.
Macrophages switch phenotypes during kidney injury and repair. (A and B) Immunostaining for F4/80 (green) shows a progressive increase in macrophages surrounding the injured tubules from days 1 to 7. n = 4 to 8 mice/group, P < 0.001 for days 3 to 7 versus day 1. (C) Immunostaining for Cd11c and F4/80 shows that a small percentage of F4/80+ cells coexpress the dendritic cell marker Cd11c (arrows), whereas other F4/80+ cells do not express Cd11c (asterisks). (D) Quantification of F4/80+Cd11c+ cells in control mice and on day 7 after injury. **P < 0.01 versus day 0. (E and F) qPCR for iNos (E) and Arg-1 (F) from F4/80+ cells isolated from kidneys at indicated times after I/R. Values reported as ddCt relative to day 1. **P < 0.01, ***P < 0.001.
Figure 2.
Figure 2.
Macrophages induced in vitro and activated in vivo demonstrate similar expression patterns. (A) PCR of mRNA isolated from BMMs treated for 24 hours with either Ifnγ or IL-4. Ifnγ induces expression of the M1 marker iNos, whereas IL-4 induces expression of the M2 marker Arg-1. (B) RNA isolated from BMMs stimulated for 24 hours with either Ifnγ or IL-4 was used for real-time PCR of message levels for iNos, Arginase-1, or IL-12 relative to their expression in uninduced BMMs. A representative experiment is shown (from an n of 3). (C) F4/80+Cd11c macrophages were isolated from kidneys at baseline (D0) and compared with F4/80+Cd11cMR macrophages 24 hours after I/R injury and F4/80+Cd11cMR+ macrophages 7 days after I/R injury. A representative real-time PCR for iNos, Arg-1, and IL-12 relative to their expression in D0 cells is shown (from an n of 3).
Figure 3.
Figure 3.
Macrophages demonstrate plasticity in vitro and in vivo. (A) BMMs were stimulated with Ifnγ to induce iNos expression and labeled with the cytosolic tracker dye PKH26. Original magnification: ×1000. (B) PKH26 labeled M1 macrophages were injected intravenously at 3 days after I/R, followed on day 5 by immunofluorescence analysis of PKH26, iNos, and MR. Multiple PKH26+MR+ cells were detected in the injured kidneys on day 5 (arrowheads), whereas most PKH26+ cells had lost iNos expression (arrows). Original magnification: ×400. (C) Quantification of PKH26+iNos+ and PKH26+MR+ macrophages injected either on day 0 and analyzed on day 1 after I/R or injected on day 3 and analyzed on day 5 after I/R. n = 4 separate mice/group, ***P < 0.001 versus day 1. (D) BMM were stimulated for 48 hours with vehicle (BMM), Ifnγ (M1), IL-4 (M2), or vehicle followed by MPT coculture (BMM+MPT) or Ifnγ followed by MPT coculture (M1+MPT) and then immunostained for MR (green) or isotype control. Stimulation with IL-4 or coculture with MPT results in increased expression of MR (bottom three panels). Original magnification: ×400. (E) FACS analysis of MR expression by naive BMM versus IL-4–induced BMMs (M2), naive BMMs versus naive BMMs cocultured with MPT cells, and Ifnγ-activated BMMs (M1) versus M1 cocultured with MPT cells.
Figure 4.
Figure 4.
MPT coculture induces a hybrid activation state in macrophages that is IL-4 independent. BMMs were stimulated with Ifnγ for 48 hours (M1), followed by culture for 48 hours in the presence of Ifnγ, vehicle, IL-4, or MPT coculture, followed by RNA harvest and quantitative RT-PCR, normalized to Hprt expression. (A) Expression of iNos, Arg1, and MR after coculture of M1-induced cells with MPT was not statistically different from that seen after stimulation with IL-4. (B) Ym1 and Igf1 expression are significantly lower in M1+MPT compared with M1+IL-4, whereas IL-1β and Msr1 mRNA expression in M1+MPT are significantly upregulated. Expression is presented relative to M1-activated BMMs treated with vehicle. n = 4, *P < 0.05, **P < 0.01, and ***P < 0.001 for M1+IL-4 versus M1+MPT. (C) Quantitative RT-PCR analysis of Arg1 and MR expression in IL-4rαtm1Sz BMMsw (IL-4R KO) induced with IL-4 for 24 hours relative to that in IL-4–stimulated strain-matched Balb/c wild-type BMMs. (D–G) IL-4R KO BMMs or WT BMMs stimulated with Ifnγ for 24 hours (M1) were cocultured with (D and E) MPT cells (M1+MPT) or (F and G) primary tubular epithelial cells isolated from wild-type Balb/c kidneys (M1+PTEC) for 48 hours. ddCt expression shown relative to M1-induced KO and WT BMMs, respectively. A representative experiment is shown for each condition (from an n of 3). (H and I) Wild-type (Balb/c) or IL-4Rα–null mice were subjected to unilateral ischemia/reperfusion and contralateral nephrectomy. Sections from the ischemically injured kidney were stained for MR on day 7 after injury (H), and samples were obtained for BUN on the indicated days (I). The infiltration of MR-positive cells and the course of BUN after I/R were indistinguishable in the two groups of mice. n = 11 mice/group.
Figure 5.
Figure 5.
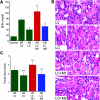
Proinflammatory macrophages promote tubule injury. Mice treated for 2 days with liposomal vehicle (LV) or liposomal clodronate (LC) were subjected to unilateral I/R and contralateral nephrectomy, followed by infusion of 1 × 10⁶ M1 or M2 macrophages immediately after I/R. (A) BUN values are shown 24 hours after I/R ± macrophage infusion. n = 4 to 8 animals/group, **P < 0.01 versus I/R+LC alone, P = not significant versus I/R+LV alone. *P < 0.05 versus I/R+LC+M1, P = not significant versus I/R+LC alone. (B) Histology of mice treated as in A shows increased tubular injury in the LV control and LC+M1 group compared with LC or LC+M2. Original magnification: ×400. (C) Blinded scoring of tubular injury shows increased injury in the mice receiving M1 macrophages (n = 4 mice/group, ***P < 0.001 LC versus LV, P < 0.001 LC+M1 versus LC, P < 0.001 LC+M2 versus LC+M1, P = not significant versus LC+M2 versus LC).
Figure 6.
Figure 6.
Alternatively activated macrophages promote tubule proliferation and kidney repair. (A) Transwell coculture of ATP-depleted MPT cells with M2 macrophages results in increased cell numbers compared with coculture with M1 macrophages or MPT cells alone (n = 3, P < 0.01 for M2 versus M1 and M2 versus control; P = not significant for M1 versus control). (B) Mice were subjected to unilateral I/R and contralateral nephrectomy followed 48 and 72 hours later by injection of LV or LC. Quantitation of F4/80 and/or MR expressing cells/400× field in the outer medulla on day 5 after injury. n = 3, **P < 0.01 versus LV. (C and D) Proliferating epithelial cells on day 5 after injury were detected by Ki-67 immunostaining (C, 1000×) and quantified/400× field in the outer medulla (D, n = 3, ***P < 0.001). (E) BUN determination shows less improvement in GFR at 5 and 7 days after injury in the LC-treated group (***P < 0.001 versus LV at days 5 and 7). (F) Histology on day 5 after I/R of kidneys from mice treated on days 2 and 3 with LC or LV shows that the majority of injured tubules in LV-treated animals are undergoing repair with increasing numbers of cells/tubule (yellow arrows). In contrast, many tubules from LC-treated mice continue to have small numbers of highly simplified cells lining the basement membrane (green arrows). Original magnification: ×400.

Comment in

References

    1. Solez K, Morel-Maroger L, Sraer JD: The morphology of “acute tubular necrosis” in man: Analysis of 57 renal biopsies and a comparison with the glycerol model. Medicine (Baltimore) 58: 362–376, 1979 - PubMed
    1. Bonventre JV: Pathophysiology of acute kidney injury: Roles of potential inhibitors of inflammation. Contrib Nephrol 156: 39–46, 2007 - PubMed
    1. Ibrahim S, Jacobs F, Zukin Y, Enriquez D, Holt D, Baldwin W, III, Sanfilippo F, Ratner LE: Immunohistochemical manifestations of unilateral kidney ischemia. Clin Transplant 10: 646–652, 1996 - PubMed
    1. Ysebaert DK, De Greef KE, De Beuf A, Van Rompay AR, Vercauteren S, Persy VP, De Broe ME: T cells as mediators in renal ischemia/reperfusion injury. Kidney Int 66: 491–496, 2004 - PubMed
    1. Beck-Schimmer B, Oertli B, Pasch T, Wuthrich RP: Hyaluronan induces monocyte chemoattractant protein-1 expression in renal tubular epithelial cells. J Am Soc Nephrol 9: 2283–2290, 1998 - PubMed

Publication types