. 2011 Jun;300(6):C1466-78.
doi: 10.1152/ajpcell.00325.2010. Epub 2011 Feb 2.

BAX supports the mitochondrial network, promoting bioenergetics in nonapoptotic cells

Affiliations

BAX supports the mitochondrial network, promoting bioenergetics in nonapoptotic cells

Rebecca J Boohaker et al. Am J Physiol Cell Physiol. 2011 Jun.

Abstract

The dual functionality of the tumor suppressor BAX is implied by the nonapoptotic functions of other members of the BCL-2 family. To explore this, mitochondrial metabolism was examined in BAX-deficient HCT-116 cells as well as primary hepatocytes from BAX-deficient mice. Although mitochondrial density and mitochondrial DNA content were the same in BAX-containing and BAX-deficient cells, MitoTracker staining patterns differed, suggesting the existence of BAX-dependent functional differences in mitochondrial physiology. Oxygen consumption and cellular ATP levels were reduced in BAX-deficient cells, while glycolysis was increased. These results suggested that cells lacking BAX have a deficiency in the ability to generate ATP through cellular respiration. This conclusion was supported by detection of reduced citrate synthase activity in BAX-deficient cells. In nonapoptotic cells, a portion of BAX associated with mitochondria and a sequestered, protease-resistant form was detected. Inhibition of BAX with small interfering RNAs reduced intracellular ATP content in BAX-containing cells. Expression of either full-length or COOH-terminal-truncated BAX in BAX-deficient cells rescued ATP synthesis and oxygen consumption and reduced glycolytic activity, suggesting that this metabolic function of BAX was not dependent upon its COOH-terminal helix. Expression of BCL-2 in BAX-containing cells resulted in a subsequent loss of ATP measured, implying that, even under nonapoptotic conditions, an antagonistic interaction exists between the two proteins. These findings infer that a basal amount of BAX is necessary to maintain energy production via aerobic respiration.


Figures
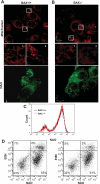
Fig. 1.
Fig. 1.
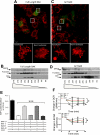
Reduced metabolic activity in BAX-deficient cells is not related to mitochondrial content or loss of viability. BAX+/+ HCT-116 cells (A) and BAX−/− HCT-116 cells (B) were cultured on MatTek 24-well glass-bottom plates coated with laminin to 70–80% confluence. The cells were treated with MitoTracker Red 580 or nonyl acridine orange (NAO) before imaging as described in materials and methods. Live cell images were obtained with the UltraView (PerkinElmer) spinning disk confocal system. The stand was a Zeiss AxioObserver Z.1 with a Plan-Apochromat ×63/1.4 Oil differential interference contrast (DIC) objective with a resolution of 0.124 μm. Postacquisition processing was done with Velocity software (PerkinElmer). Images are representative of 3 replicates per condition. Insets, ×10 magnification of the 2 highlighted areas in each field. C and D: to assess mitochondrial density (C) and viability (D), 500,000 cells/sample were stained with NAO (C) or NAO and ethidium bromide (EtBr) (D) for 10 min. Fluorescence output was read using the FL1 and FL3 channels on a C6 flow cytometer (Accuri). Each experiment was performed in triplicate for each cell line variant. Representative data are shown. Data plotted in histogram and dot plots were analyzed with FCSExpress (DeNovo) software.
Fig. 2.
Fig. 2.
Deficiency of BAX results in reduced intracellular ATP and oxygen consumption. BAX+/+ HCT-116 cells (A) and BAX−/− HCT-116 cells (B) were cultured on MatTek 24-well glass-bottom plates coated with laminin to 70–80% confluence. Cells were treated with carbonyl cyanide p-trifluoromethoxyphenylhydrazone (FCCP) in McCoy's complete medium for 2 h before imaging. Live cell images were obtained with the UltraView (PerkinElmer) spinning disk confocal system. The stand was a Zeiss AxioObserver Z.1 with a Plan-Apochromat ×63/1.4 Oil DIC objective with a resolution of 0.124 μm. Insets, ×10 magnification of the 2 highlighted areas in each field. Postacquisition processing was done with Velocity software (PerkinElmer). Images are representative of 3 separate experiments with 2 replicates per condition. C: calculation of MitoTracker fluorescence intensity was done with Velocity software by averaging the mean intensity of the pixels in each fluorescent cell. D: ATP concentration was assessed by measuring the activity of luciferase as relative luminescence units (RLU). E: oxygen consumption rate (OCR) and extracellular acidification rate (ECAR) data obtained from the Seahorse XF24 Analyzer were calculated based on the oxygen consumption and acidification rates of 40,000 cells/well. Values were pooled from 3 separate experiments and normalized to changes from the initial rate, n = 9. F: oxygen consumption in both BAX+/+ and BAX−/− cells was measured over time as a function of increased fluorescence. Fluorescence, oxygen biosensor, and ATP data are representative of n = 6. The values for the ATP, OCR, and ECAR assays were normalized to cell number per well, and statistics were done by 1-way ANOVA with Dunnett's posttest analysis. *P < 0.05, **P < 0.01, ***P < 0.001.
Fig. 3.
Fig. 3.
BAX associates with mitochondria in nonapoptotic cells, resulting in reduced citrate synthesis activity. A: BAX+/+ HCT-116 cells were fixed and stained with the indicated fluorochrome-conjugated antibody as described in materials and methods. Confocal microscopy of cells shows endogenous BAX in green and the mitochondrial protein heat shock protein (HSP)60 in red, and in the merged field yellow regions indicate colocalization of BAX with HSP60. Images were acquired with LSM 510 using a ×100x/1.4 Oil DIC objective and are representative of 10 different images scanned from 3 separate experiments. B: enriched mitochondrial lysates of membrane-bound proteins were prepared from BAX+/+ and BAX−/− HCT-116 cells and subjected to differential ultracentrifugation as described in materials and methods. Gradient fractions collected were analyzed by SDS-PAGE, and membranes were immunoblotted for the presence of BAX, prohibitin (mitochondria), and GRP78 [endoplasmic reticulum (ER)]. Each blot shown is representative of 3 independent experiments. C: Western blot analysis of mitochondria isolated from BAX+/+ cells shows the effects of proteinase K digestion on mitochondrial membrane (MM) proteins over time. The extent of the digestion was calculated based on the % change in densitometry between the treated and untreated samples. D: assessment of citrate synthase activity was determined by the rate of formation of thionitrobenzoic acid (TNB) as described in materials and methods. The rate of activity is shown as μmol·ml−1·min−1. Background levels of citrate synthase activity in spontaneously ruptured mitochondria are included as controls. Data encompass 2 separate experiments for a total of n = 4/sample. Statistics were calculated by unpaired Student's t-test. *P < 0.05.
Fig. 4.
Fig. 4.
Inhibition of BAX with small interfering RNAs (siRNAs) replicates conditions of decreased intracellular ATP that occur upon BAX deficiency. BAX+/+ HCT-116 or lung cancer cells (LC) were seeded at a density of 200,000 cells/well in 6-well plates. After 24 h, BAX SMARTpool siRNA (Dharmacon) or nontargeting siRNA was delivered with the Accell reagent (Dharmacon). Cells were analyzed 72 h later. Control cells received the Accell reagent alone. No significant differences were previously observed between Accell reagent alone and Accell reagent with nontargeting siRNA. A: cells treated with Accell reagent alone or Accell reagent with BAX siRNA were lysed for Western blot analysis of BAX. B: densitometry readings, indicative of fold changes in BAX expression, are shown. Images are representative of triplicate experiments. Calculations are based on multiple samples (n = 4). Samples were normalized to cells without BAX siRNA. C: for ATP assay, cells were counted and plated at a density of 4,000 cells/well. Treatments included Accell reagent alone and Accell reagent with nontargeting siRNA (NTsiRNA) or BAX siRNA (siRNA). ATP assays were done in triplicate. Statistical analysis was performed with 1-way ANOVA test for equal variances. *P < 0.05, **P < 0.01.
Fig. 5.
Fig. 5.
Liver hepatocytes from BAX-deficient mice have reduced metabolic activity, resulting in decreased ATP and oxygen consumption. A: sections of the caudate lobe of the liver from BAX knockout (KO) and C57BL/6 mice were stained with MitoTracker Red or NAO. B: isolated hepatocytes from these mice were stained with NAO and measured by flow cytometry to determine mitochondrial content. Data are representative of 3 replicates, and n = 2 for each group. C: oxygen consumption of 50,000 isolated hepatocytes per well was measured over 24 h. Data are representative of 2 experiments each with 46 replicates/group. D: ATP content was measured in isolated hepatocytes. Luminescence was normalized to 5,000 cells per well, and each of 3 experiments consisted of 42 replicates per condition. E: citrate synthase activity was examined in isolated mitochondria by measuring the absorbance of TNB over time. ATP and citrate synthase assay analysis was done by 1-way ANOVA with Dunnett's posttest analysis. *P < 0.05, ***P < 0.001.
Fig. 6.
Fig. 6.
Expression of full-length BAX restores mitochondrial association and ATP production in BAX-deficient cells. BAX−/− HCT-116 cells were transfected with a ProteoTuner bicistronic vector expressing either full-length BAX (BAX-FL; A, B) or COOH-terminal-truncated BAX (BAX-ΔCT; C, D) and green fluorescent protein (GFP). A and C: cells were grown on MatTek plates as described in materials and methods and transiently transfected (efficiency 60–70%). Shield was added to induce expression. Transfected cells were imaged based on GFP expression, and MitoTracker Red was used for mitochondria visualization. Live cell images were obtained with the UltraView (PerkinElmer) spinning disk confocal system. The stand was a Zeiss AxioObserver Z.1 with a Plan-Apochromat ×63/1.4 Oil DIC objective with a resolution of 0.124 μm. Insets were acquired at ×10 magnification. Postacquisition processing was done with Velocity software (PerkinElmer). B and D: BAX−/− HCT-116 cells were transfected with either BAX-FL or BAX-ΔCT as described above. Mitochondrial enriched lysates were subjected to differential ultracentrifugation and SDS-PAGE as described in materials and methods. Membranes were probed with antibodies for BAX, prohibitin (mitochondria), and GRP78 (ER). Images are representative of 3 independent experiments. E: BAX+/+ HCT-116 cells, BAX−/− HCT-116 cells, and BAX−/− HCT-116 cells transiently transfected with BAX-FL or BAX-ΔCT (ΔC) were treated with and without FCCP and analyzed for changes in ATP levels as described in materials and methods. F: BAX+/+ HCT-116 cells, BAX−/− HCT-116 cells, and BAX−/− HCT-116 cells, transiently transfected with BAX-FL (FL) or BAX-ΔCT (ΔCT or DCT) were analyzed for changes in OCR and ECAR as described in materials and methods. One-way ANOVA was used for statistical analysis. Microscopy and ATP data are representative of 2 experiments each with 3 replicates. OCR and ECAR data are representative of 2 experiments with a total of 6 replicates. Statistical results for OCR and ECAR assays: *P < 0.05 for BAX−/− vs. BAX-FL and BAX−/− vs. BAX-ΔCT; for ATP assay: ***P < 0.001.
Fig. 7.
Fig. 7.
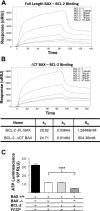
Interaction of BAX with BCL-2 inhibits the production of ATP in nonapoptotic cells. SPR analysis of the binding of BAX-FL (A) or BAX-ΔCT (B) recombinant proteins with BCL-2 was done by amine-coupling BAX to the sensor chip and then flowing BCL-2 over the immobilized BAX proteins. Response is measured in micro-refractive index units (μRIU), and the equilibrium constants (KD) for each BAX construct were calculated from the observed association and dissociation constants (ka and kd). C: BAX+/+ HCT-116 cells, BAX−/− HCT-116 cells, and BAX−/− HCT-116 cells transiently transfected with BAX-FL or BAX-ΔCT (for 18 h) were treated with and without FCCP and analyzed for changes in ATP levels as described in materials and methods. One-way ANOVA was used for statistical analysis. ***P < 0.001.

References

    1. Brooks C, Wei Q, Feng L, Dong G, Tao Y, Mei L, Xie ZJ, Dong Z. Bak regulates mitochondrial morphology and pathology during apoptosis by interacting with mitofusins. Proc Natl Acad Sci USA 104: 11649–11654, 2007 - PMC - PubMed
    1. Cartron PF, Oliver L, Martin S, Moreau C, LeCabellec MT, Jezequel P, Meflah K, Vallette FM. The expression of a new variant of the pro-apoptotic molecule Bax, Baxpsi, is correlated with an increased survival of glioblastoma multiforme patients. Hum Mol Genet 11: 675–687, 2002 - PubMed
    1. Chao DT, Korsmeyer SJ. BCL-2 family: regulators of cell death. Annu Rev Immunol 16: 395–419, 1998 - PubMed
    1. Chittenden T, Flemington C, Houghton AB, Ebb RG, Gallo GJ, Elangovan B, Chinnadurai G, Lutz RJ. A conserved domain in Bak, distinct from BH1 and BH2, mediates cell death and protein binding functions. EMBO J 14: 5589–5596, 1995 - PMC - PubMed
    1. Danial NN, Gramm CF, Scorrano L, Zhang CY, Krauss S, Ranger AM, Datta SR, Greenberg ME, Licklider LJ, Lowell BB, Gygi SP, Korsmeyer SJ. BAD and glucokinase reside in a mitochondrial complex that integrates glycolysis and apoptosis. Nature 424: 952–956, 2003 - PubMed

Publication types

Substances

LinkOut - more resources