. 2010 Dec;2(1-4):23-60.
doi: 10.1007/s12566-010-0015-9. Epub 2010 Aug 21.

Advances in structure elucidation of small molecules using mass spectrometry

Affiliations

Advances in structure elucidation of small molecules using mass spectrometry

Tobias Kind et al. Bioanal Rev. 2010 Dec.

Abstract

The structural elucidation of small molecules using mass spectrometry plays an important role in modern life sciences and bioanalytical approaches. This review covers different soft and hard ionization techniques and figures of merit for modern mass spectrometers, such as mass resolving power, mass accuracy, isotopic abundance accuracy, accurate mass multiple-stage MS(n) capability, as well as hybrid mass spectrometric and orthogonal chromatographic approaches. The latter part discusses mass spectral data handling strategies, which includes background and noise subtraction, adduct formation and detection, charge state determination, accurate mass measurements, elemental composition determinations, and complex data-dependent setups with ion maps and ion trees. The importance of mass spectral library search algorithms for tandem mass spectra and multiple-stage MS(n) mass spectra as well as mass spectral tree libraries that combine multiple-stage mass spectra are outlined. The successive chapter discusses mass spectral fragmentation pathways, biotransformation reactions and drug metabolism studies, the mass spectral simulation and generation of in silico mass spectra, expert systems for mass spectral interpretation, and the use of computational chemistry to explain gas-phase phenomena. A single chapter discusses data handling for hyphenated approaches including mass spectral deconvolution for clean mass spectra, cheminformatics approaches and structure retention relationships, and retention index predictions for gas and liquid chromatography. The last section reviews the current state of electronic data sharing of mass spectra and discusses the importance of software development for the advancement of structure elucidation of small molecules. ELECTRONIC SUPPLEMENTARY MATERIAL: The online version of this article (doi:10.1007/s12566-010-0015-9) contains supplementary material, which is available to authorized users.


Conflict of interest statement

The authors declare no competing interests.

Figures

Fig. 1
Fig. 1
Chip-based nanoelectrospray allows for sensitive and contamination-free mass spectral infusions (photo by Tobias Kind/FiehnLab)
Fig. 2
Fig. 2
Nanoelectrospray emitter array for enhanced sensitivity of electrospray ionization mass spectrometry (reproduced with permission from Keqi Tang and Richard D. Smith/Pacific Northwest National Laboratory)
Fig. 3
Fig. 3
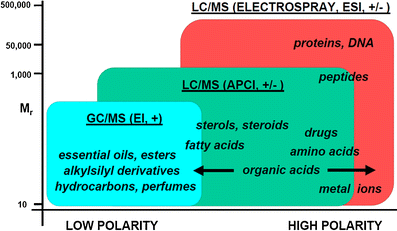
Coverage of molecule classes with different ionization methods (reproduced with permission from Oxford University Press [55])
Fig. 4
Fig. 4
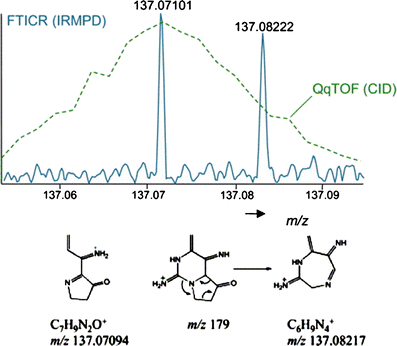
The importance of mass resolving power showing a high-resolution FT-ICR-MS spectrum with lower resolution Q-TOF mass spectrum. Only the high-resolution instrument can resolve peaks with 0.0112 Da difference (reproduced with the permission from Ref. [63])
Fig. 5
Fig. 5
Charge state deconvolution with the freely available software Decon2LS (reproduced with permission from Ref. [136])
Fig. 6
Fig. 6
A mass error of up to 5 ppm is the penalty if the electron mass is not accurately included in accurate mass calculations. The lower red line marks 0.3 ppm mass accuracy, which can be reached by FT-ICR-MS
Fig. 7
Fig. 7
The molecular formula space below 2,000 Da (elements CHNSOP) covers more than eight billion elemental compositions and can be reduced to 600 million highly probable molecular formulas using the Seven Golden Rules [81]
Fig. 8
Fig. 8
Fragmentation pathway of paclitaxel and sum formulae for fragments from MS/MS and MS3 experiments calculated with the SmartFormula3D algorithm (reproduced with permission from Ilmari Krebs, Bruker Daltonik GmbH, Bremen [187])
Fig. 9
Fig. 9
A total ion map of tandem mass spectra from cobalamin (vitamin B12) created by a linear ion trap mass spectrometer and visualized by the Thermo Xcalibur software. For all precursor ions in the mass range between m/z 300 and 1,376, one MS/MS spectrum was acquired
Fig. 10
Fig. 10
An automatic data-dependent ion tree experiment with multiple-stage MSn spectra of selected precursor ions of reserpine acquired on a linear ion trap mass spectrometer. The information rich ion tree represents the ultimate mass spectral fingerprint of a molecule
Fig. 11
Fig. 11
A spectral tree diagram from MassFrontier representing multiple-stage MSn spectra, in-source CID spectra or zoom spectra. Any stage can be searched and is logically connected with different product ion spectra (reproduced with permission from Robert Mistrik/HighChem Ltd)
Fig. 12
Fig. 12
A mass spectral fragmentation pathway database containing 30,936 fragmentation mechanisms. The mass spectrometry community never enthusiastically endorsed digital data sharing. Therefore, most of the spectra and reaction data had to be captured from old paper publications (reproduced with permission from Robert Mistrik/HighChem Ltd)
Fig. 13
Fig. 13
An experimental phospholipid spectrum and computer generated MS/MS spectrum. Mass spectral libraries of theoretical in silico spectra can be generated from large structure databases (source: Tobias Kind/FiehnLab)
Fig. 14
Fig. 14
Peak picking and mass spectral deconvolution. The program can automatically detect peaks under the baseline (case A). Overlapping (non-resolved) peaks can be detected, and clean mass spectra are extracted (case B) (source: Tobias Kind/FiehnLab created with MassFrontier)
Fig. 15
Fig. 15
Capturing high-resolution mass spectral data from paper publications is an error-prone process. The final machine readable structure usually does not represent the original spectrum (hamburger-to-cow algorithm). New digital data-sharing principles need to be set in place (source: Tobias Kind/FiehnLab)

References

    1. Brunnée C. The ideal mass analyzer: fact or fiction? Int J Mass Spectrom Ion Processes. 1987;76(2):125–237.
    1. Gelpí E. From large analogical instruments to small digital black boxes: 40 years of progress in mass spectrometry and its role in proteomics. Part I 1965–1984. J Mass Spectrom. 2008;43(4):419–435. doi: 10.1002/jms.1403. - DOI - PubMed
    1. Gelpí E. From large analogical instruments to small digital black boxes: 40 years of progress in mass spectrometry and its role in proteomics. Part II 1985–2000. J Mass Spectrom. 2009;44(8):1137–1161. doi: 10.1002/jms.1621. - DOI - PubMed
    1. Makarov A. Electrostatic axially harmonic orbital trapping: a high-performance technique of mass analysis. Anal Chem. 2000;72(6):1156–1162. doi: 10.1021/ac991131p. - DOI - PubMed
    1. Perry RH, Cooks RG, Noll RJ. Orbitrap mass spectrometry: instrumentation, ion motion and applications. Mass Spectrom Rev. 2008;27(6):661–699. doi: 10.1002/mas.20186. - DOI - PubMed

LinkOut - more resources