. 2010 Oct;77(10):940-52.
doi: 10.1002/cyto.a.20955. Epub 2010 Aug 18.

Hyperthermia alters the interaction of proteins of the Mre11 complex in irradiated cells

Affiliations

Hyperthermia alters the interaction of proteins of the Mre11 complex in irradiated cells

Bogdan I Gerashchenko et al. Cytometry A. 2010 Oct.

Abstract

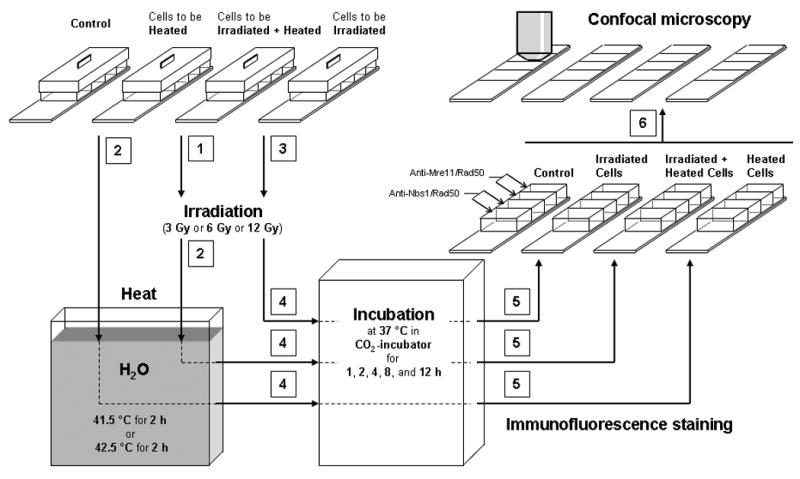
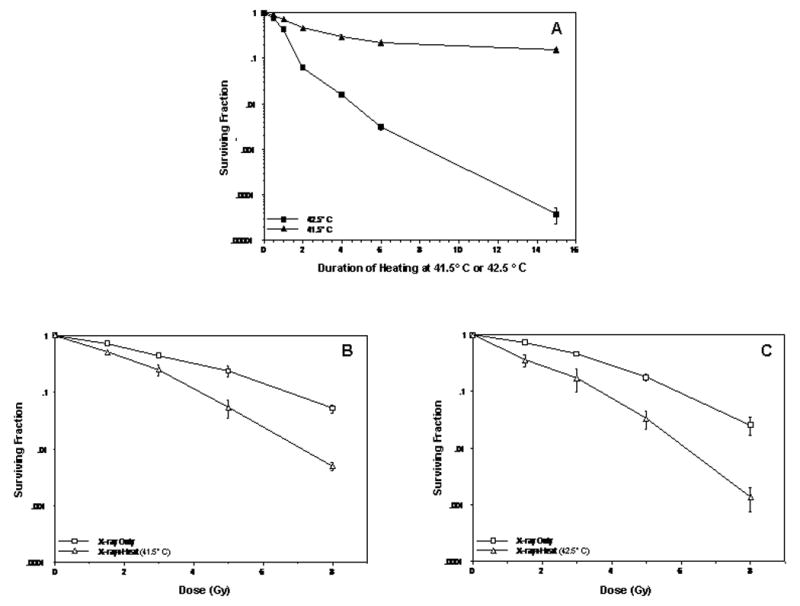
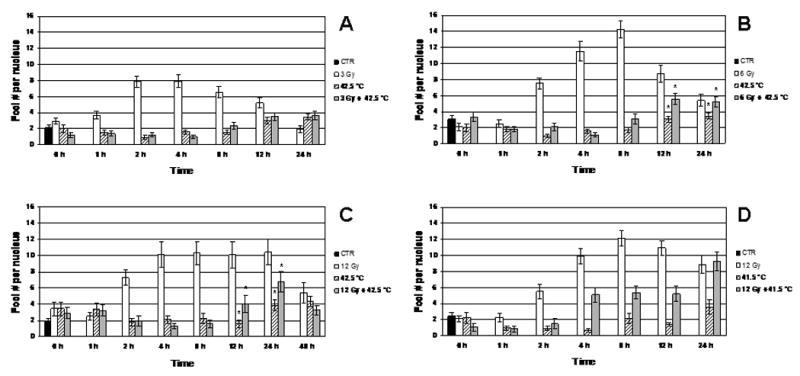
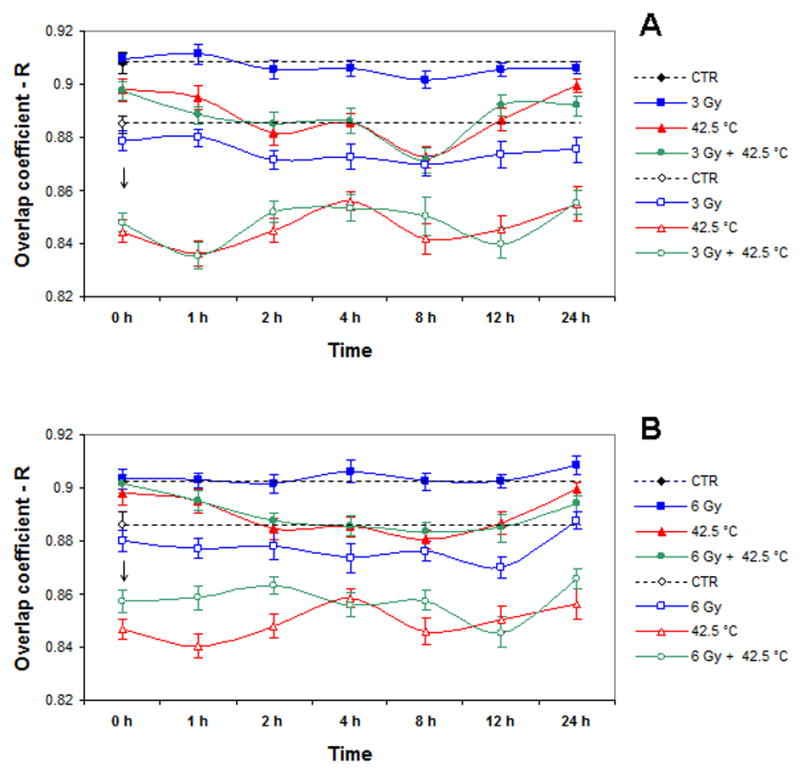
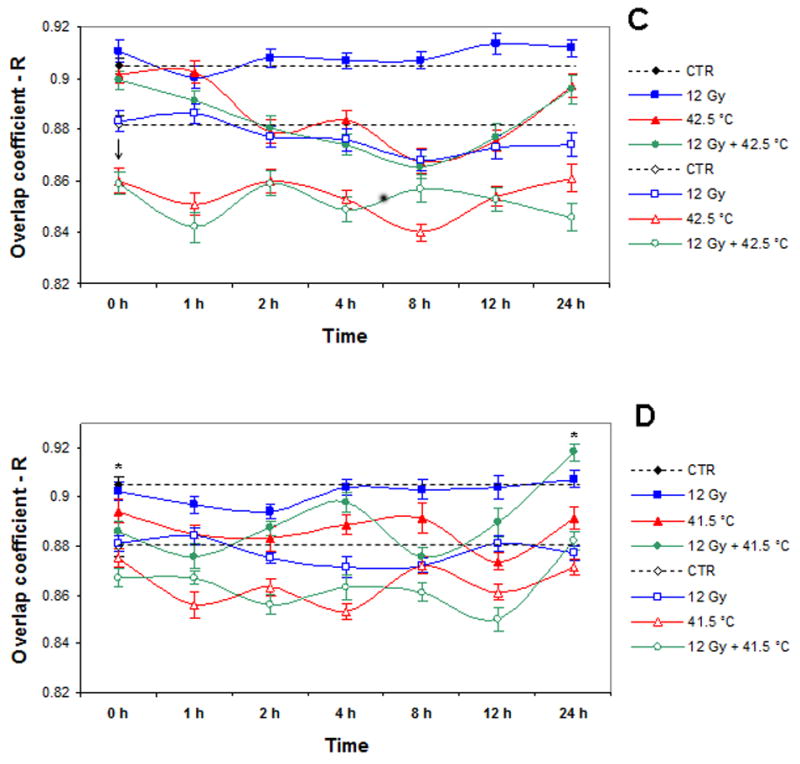
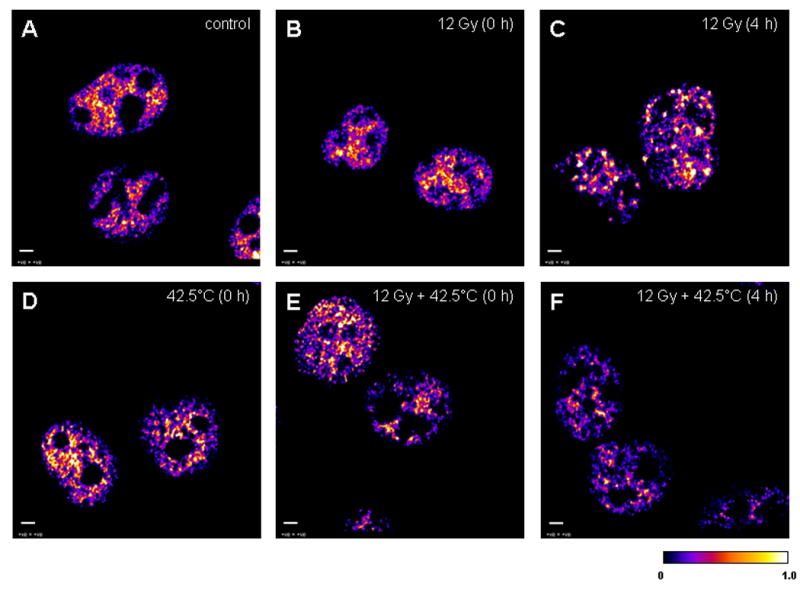
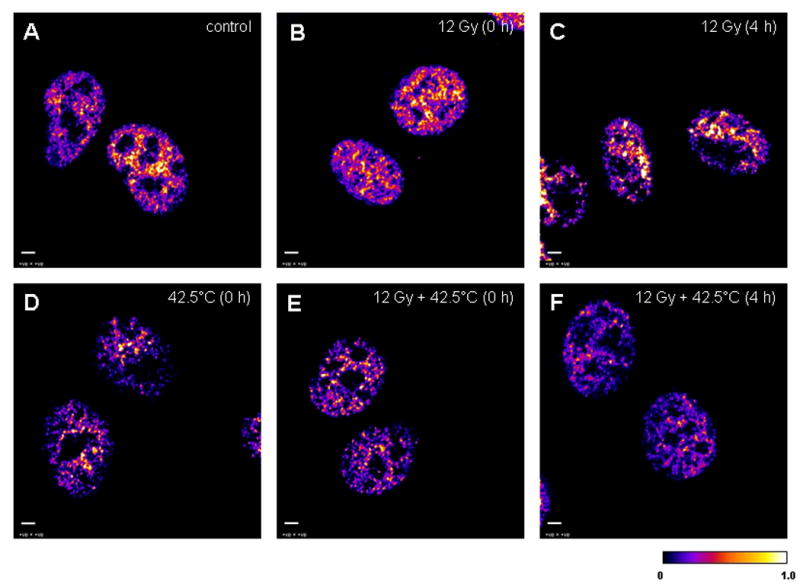
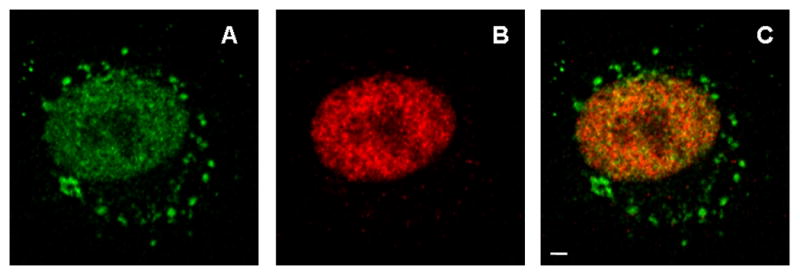
Radiosensitization of mammalian cells by heat is believed to involve the inhibition of repair of DNA double-strand breaks (DSBs). The Mre11 complex (composed of Mre11, Rad50, and Nbs1) is involved in DSB repair and forms foci at sites of radiation-induced DSBs. Heat induces the translocation of a significant amount of Mre11, Rad50, and Nbs1 from the nucleus to the cytoplasm, but little is known about how heat affects the integrity of the proteins still remaining in nuclei, or alters kinetics of formation/disappearance of DNA repair foci in heated, irradiated cells. Here, we show that hyperthermia alters the interaction between proteins of the Mre11 complex in irradiated human melanoma cells and inhibits the formation of repair foci. At various times after X-irradiation and/or heating (2 h at 41.5 or 42.5 °C), the cells were fixed and stained for Mre11, Rad50, and Nbs1. Colocalization of proteins and formation and disappearance of nuclear foci in heated and/or irradiated cells, determined using confocal microscopy, were compared. In heated, irradiated cells, focus formation was inhibited for 2-8 h, and colocalization of the proteins of the Mre11 complex was reduced for 12-24 h post-treatment. Colocalization was recovered in irradiated cells within 24 h after heating at 41.5 °C, but was inhibited longer after heating at 42.5 °C. The decreased colocalization in heated, irradiated cells suggests that there is a decrease in protein interaction, and Mre11 complexes in nuclei disassemble after heating. Such changes could be involved, at least in part, in heat radiosensitization and inhibition of DSB repair. Also, the kinetics of disassembly and reassembly of Mre11 complexes appears to be dependent upon treatment temperature.


Figures

Figure 1
Figure 1
Schematic representation of the sequence of procedures (sequence indicated by numbers) used to treat cells (irradiation, hyperthermia, irradiation + hyperthermia) and prepare them for analysis. Control (unheated, unirradiated) cells were kept in CO2-incubator at 37 °C, while heating of cells (unirradiated and irradiated) was done in a water bath for 2 h at 41.5°C or 42.5°C.
Figure 2
Figure 2
Effect of 41.5°C or 42.5°C thermal treatments on unirradiated or irradiated human U-1 melanoma cells. (A) Clonogenic survival of cells after heating for 0.5, 1, 2, 4, 6, or 15 h at 41.5° C or 42.5° C. (B) Comparison of cell survival after irradiation with various doses of X-rays (0–8 Gy) and thermal treatment at 41.5°C for 2 h or at 42.5°C for 2 h (C). Surviving fractions of cells that were heated for 2 h at 41.5°C or 42.5°C (shown in panel A) were normalized to the surviving fraction of unheated, unirradiated cells (shown in panels B and C). Standard error of the mean for 2-3 experiments is denoted by error bars.
Figure 3
Figure 3
A: Dynamics of Mre11/Rad50 focus formation in the nuclei of unheated 3 Gy-irradiated, 42.5°C-heated unirradiated, and 42.5°C-heated 3 Gy-irradiated cells (four independent experiments). B: Dynamics of Mre11/Rad50 focus formation in the nuclei of unheated 6 Gy-irradiated, 42.5°C-heated unirradiated, and 42.5°C-heated 6 Gy-irradiated cells (four independent experiments). C: Dynamics of Mre11/Rad50 focus formation in the nuclei of unheated 12 Gy-irradiated, 42.5°C-heated unirradiated, and 42.5°C-heated 12 Gy-irradiated cells (three independent experiments). D: Dynamics of Mre11/Rad50 focus formation in the nuclei of unheated 12 Gy-irradiated, 41.5°C-heated unirradiated, and 41.5°C-heated 12 Gy-irradiated cells (three independent experiments). Vertical axis shows the average number of foci per nucleus (F). Horizontal axis shows the post-treatment time at 37° C, in hours. Note that at 0 h post-treatment, F values for heated, irradiated cells and for cells that were only irradiated or heated (A, B, C, D) insignificantly differ from F values for control cells (P > 0.05). Asterisks (*) show significant differences (P < 0.05) in F values between 42.5°C-heated unirradiated cells and 42.5°C-heated cells irradiated with 6 Gy or 12 Gy at 12 and 24 h post-treatment (B, C). Data presented are the mean ± standard error of the mean.
Figure 4
Figure 4
A: Dynamics of changes in Mre11/Rad50 or Nbs1/Rad50 co-localization in unheated 3 Gy-irradiated, 42.5°C-heated unirradiated, and 42.5°C-heated 3 Gy-irradiated cells (four independent experiments). B: Dynamics of changes in Mre11/Rad50 or Nbs1/Rad50 co-localization in unheated 6 Gy-irradiated, 42.5°C-heated unirradiated, and 42.5°C-heated 6 Gy-irradiated cells (four independent experiments). C: Dynamics of changes in Mre11/Rad50 or Nbs1/Rad50 co-localization in unheated 12 Gy-irradiated, 42.5°C-heated unirradiated, and 42.5°C-heated 12 Gy-irradiated cells (three independent experiments). D: Dynamics of changes in Mre11/Rad50 or Nbs1/Rad50 co-localization in unheated 12 Gy-irradiated, 41.5°C-heated unirradiated, and 41.5°C-heated 12 Gy-irradiated cells (three independent experiments). Closed symbols show the results for Mre11/Rad50 co-localization. Open symbols show the results for Nbs1/Rad50 co-localization. Vertical axis shows the overlap coefficient according to Manders (R). Horizontal axis shows the post-treatment time at 37° C, in hours. For Mre11/Rad50 co-localization, at 0 h post-treatment, except 41.5°C-heated 12 Gy-irradiated cells (D), all other variously treated cells (A, B, C, D) showed insignificant fluctuations in R values compared to R values of control cells (P > 0.05). For Nbs1/Rad50 co-localization, at 0 h post-treatment, except 41.5°C-heated unirradiated cells (D), all other variously treated cells (A, B, C, D) showed a significant drop in R values compared to R values exhibited by control cells (P < 0.05). Asterisks (*) show a significant difference (P < 0.05) in R values between control cells and 41.5°C-heated 12 Gy-irradiated cells at 24 h post-treatment (D). Data presented are the mean ± standard error of the mean.
Figure 4
Figure 4
A: Dynamics of changes in Mre11/Rad50 or Nbs1/Rad50 co-localization in unheated 3 Gy-irradiated, 42.5°C-heated unirradiated, and 42.5°C-heated 3 Gy-irradiated cells (four independent experiments). B: Dynamics of changes in Mre11/Rad50 or Nbs1/Rad50 co-localization in unheated 6 Gy-irradiated, 42.5°C-heated unirradiated, and 42.5°C-heated 6 Gy-irradiated cells (four independent experiments). C: Dynamics of changes in Mre11/Rad50 or Nbs1/Rad50 co-localization in unheated 12 Gy-irradiated, 42.5°C-heated unirradiated, and 42.5°C-heated 12 Gy-irradiated cells (three independent experiments). D: Dynamics of changes in Mre11/Rad50 or Nbs1/Rad50 co-localization in unheated 12 Gy-irradiated, 41.5°C-heated unirradiated, and 41.5°C-heated 12 Gy-irradiated cells (three independent experiments). Closed symbols show the results for Mre11/Rad50 co-localization. Open symbols show the results for Nbs1/Rad50 co-localization. Vertical axis shows the overlap coefficient according to Manders (R). Horizontal axis shows the post-treatment time at 37° C, in hours. For Mre11/Rad50 co-localization, at 0 h post-treatment, except 41.5°C-heated 12 Gy-irradiated cells (D), all other variously treated cells (A, B, C, D) showed insignificant fluctuations in R values compared to R values of control cells (P > 0.05). For Nbs1/Rad50 co-localization, at 0 h post-treatment, except 41.5°C-heated unirradiated cells (D), all other variously treated cells (A, B, C, D) showed a significant drop in R values compared to R values exhibited by control cells (P < 0.05). Asterisks (*) show a significant difference (P < 0.05) in R values between control cells and 41.5°C-heated 12 Gy-irradiated cells at 24 h post-treatment (D). Data presented are the mean ± standard error of the mean.
Figure 5
Figure 5
The 32-bit middle plane images of positive PDM values (that represent the best correlated pixels) derived from image correlation analysis between stained Mre11 (green) and Rad50 (red) in the nuclei of unheated unirradiated (control) cells and unheated 12 Gy-irradiated, 42.5°C-heated unirradiated, and 42.5°C-heated 12 Gy-irradiated at 0 and 4 h post-treatment. A: the nuclei of unheated unirradiated control cells (denoted as “control”). B: the nuclei of unheated 12 Gy-irradiated cells at 0 h post-irradiation (denoted as “12 Gy (0 h)”). C: the nuclei of unheated 12 Gy-irradiated cells at 4 h post-irradiation (denoted as “12 Gy (4 h)”). D: the nuclei of 42.5°C-heated unirradiated cells at 0 h post-treatment (denoted as “42.5°C (0 h)”). E: the nuclei of 42.5°C-heated 12 Gy-irradiated cells at 0 h post-treatment (denoted as “12 Gy + 42.5°C (0 h)”). F: the nuclei of 42.5°C-heated 12 Gy-irradiated cells at 4 h post-treatment (denoted as “12 Gy + 42.5°C (4 h)”). A similar pattern of Mre11/Rad50 co-localization in the nuclei of control (A) and unheated 12 Gy-irradiated cells at 0 h post-irradiation (B) was observed, probably because cells were kept on ice during irradiation. Calibration bar shows the quantitative distribution of co-localized proteins. Scale bars = 3 μm.
Figure 6
Figure 6
The 32-bit middle plane images of positive PDM values (that represent the best correlated pixels) derived from image correlation analysis between stained Nbs1 (green) and Rad50 (red) in the nuclei of unheated unirradiated (control) cells and unheated 12 Gy-irradiated, 42.5°C-heated unirradiated, and 42.5°C-heated 12 Gy-irradiated at 0 h and 4 h post-treatment. A: the nuclei of unheated unirradiated control cells (denoted as “control”). B: the nuclei of unheated 12 Gy-irradiated cells at 0 h post-irradiation (denoted as “12 Gy (0 h)”). C: the nuclei of unheated 12 Gy-irradiated cells at 4 h post-irradiation (denoted as “12 Gy (4 h)”). D: the nuclei of 42.5°C-heated unirradiated cells at 0 h post-treatment (denoted as “42.5°C (0 h)”). E: the nuclei of 42.5°C-heated 12 Gy-irradiated cells at 0 h post-treatment (denoted as “12 Gy + 42.5°C (0 h)”). F: the nuclei of 42.5°C-heated 12 Gy-irradiated cells at 4 h post-treatment (denoted as “12 Gy + 42.5°C (4 h)”). A similar pattern of Nbs1/Rad50 co-localization in the nuclei of control (A) and unheated 12 Gy-irradiated cells at 0 h post-irradiation (B) was observed probably because cells were kept on ice during irradiation. Calibration bar shows the quantitative distribution of co-localized proteins. Scale bars = 3 μm.
Figure 7
Figure 7
Mid-plane confocal images of Nbs1 (A), Rad50 (B), and merged Nbs1 and Rad50 (C) immunofluorescence in a representative nucleus of one of the 42.5°C-heated unirradiated cells at 0 h post-treatment. A significant portion of Nbs1 is seen in the cytoplasm, perhaps representing aggregates of Nbs1 molecules or aggregates of Nbs1 with other molecules. Scale bar = 3 μm.

Similar articles

Cited by

References

    1. Ben-Hur E, Elkind MM, Bronk BV. Thermally enhanced radioresponse of cultured Chinese hamster cells: inhibition of repair of sublethal damage and enhancement of lethal damage. Radiat Res. 1974;58:38–51. - PubMed
    1. Dewey WC, Hopwood LE, Sapareto LA, Gerweck LE. Cellular responses to combinations of hyperthermia and radiation. Radiology. 1977;123:463–474. - PubMed
    1. Lepock JR, Cheng KH, Al-Qysi H, Kruuv J. Thermotropic lipid and protein transitions in Chinese hamster lung cell membranes: relationship to hyperthermic cell killing. Can J Biochem. 1983;61:421–427. - PubMed
    1. Lepock JR, Frey HE, Rodahl AM, Kruuv J. Thermal analysis of CHL V79 cells using differential scanning calorimetry: implications for hyperthermic cell killing and the heat shock response. J Cell Physiol. 1988;137:14–24. - PubMed
    1. Freeman ML, Borrelli MJ, Meredith MJ, Lepock JR. On the path to the heat shock response: destabilization and formation of partially folded protein intermediates, a consequence of protein thiol modification. Free Radic Biol Med. 1999;26:737–745. - PubMed

Publication types