. 2011 Apr;97(1):84-95.
doi: 10.1002/jbm.b.31789. Epub 2011 Feb 2.

Optically based-indentation technique for acute rat brain tissue slices and thin biomaterials

Affiliations

Optically based-indentation technique for acute rat brain tissue slices and thin biomaterials

S J Lee et al. J Biomed Mater Res B Appl Biomater. 2011 Apr.

Abstract

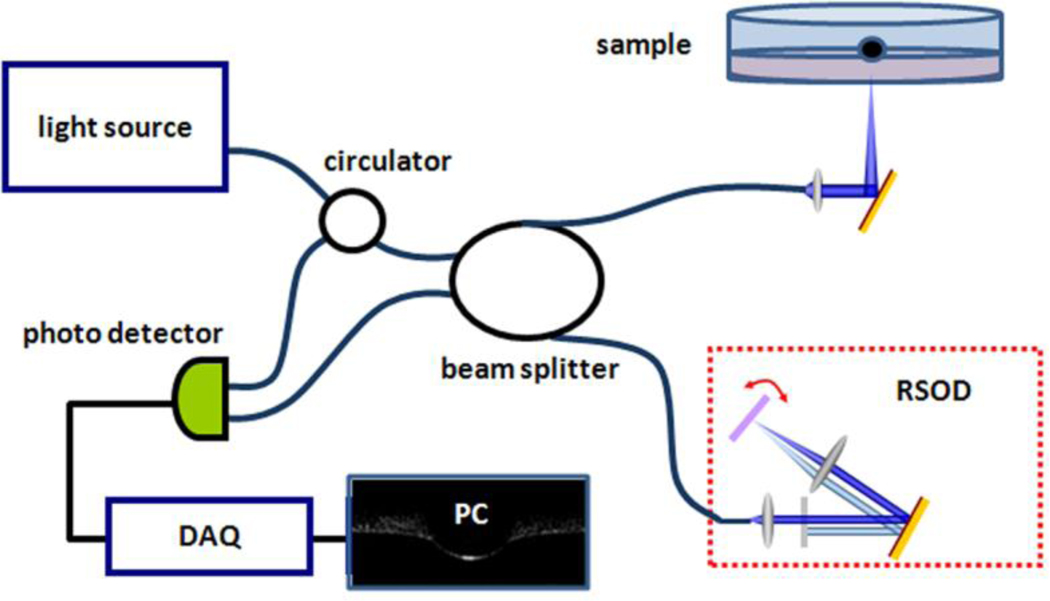
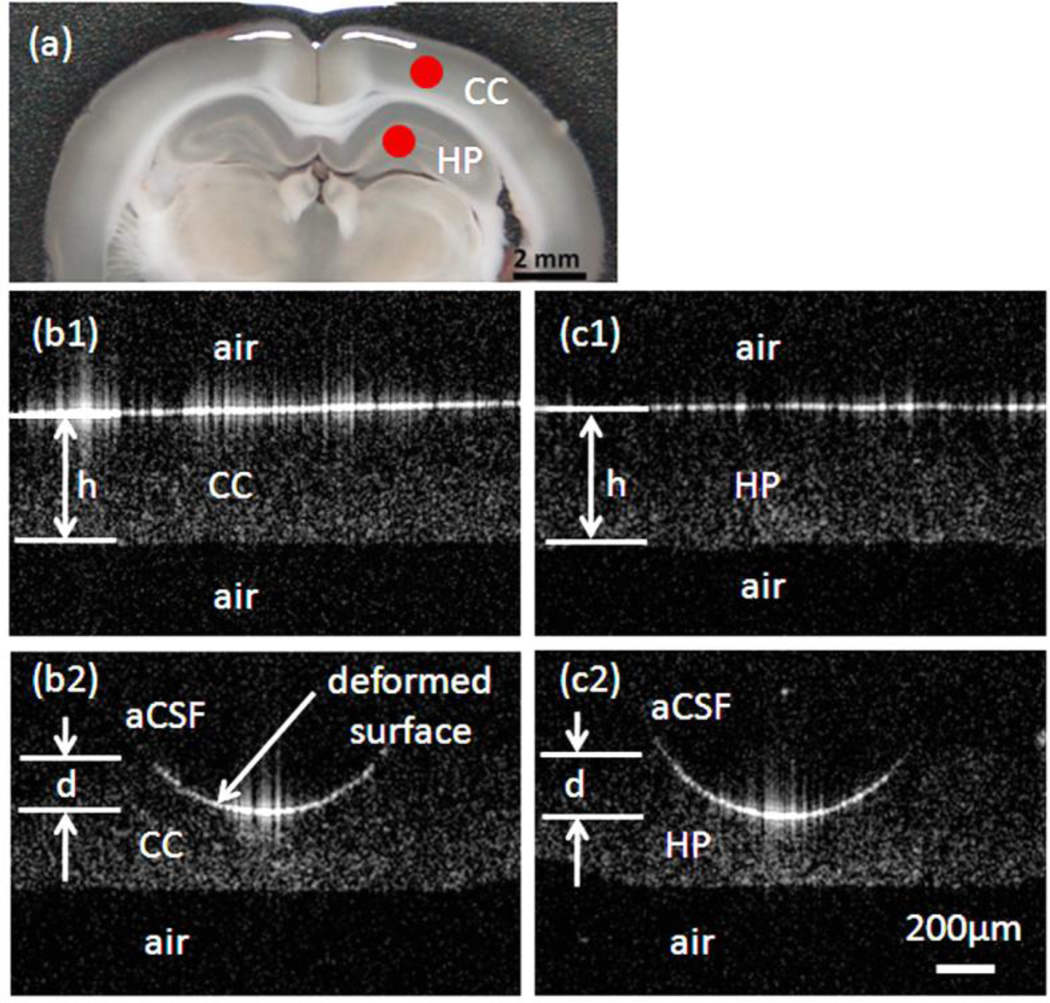
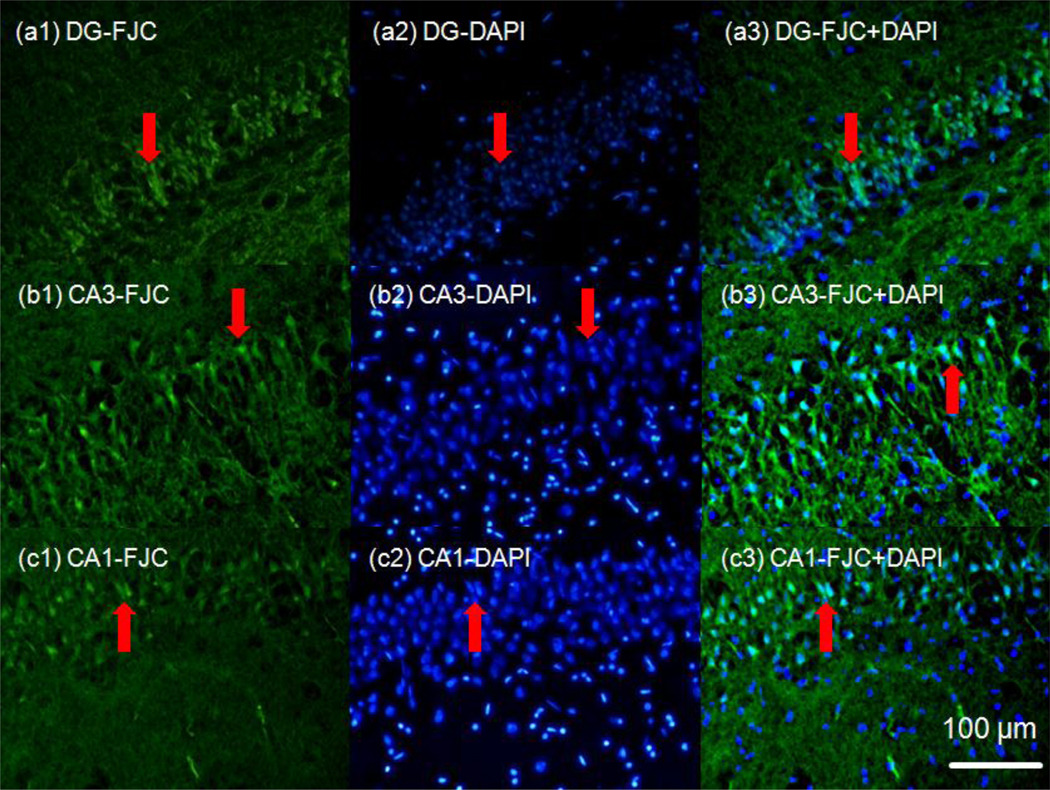
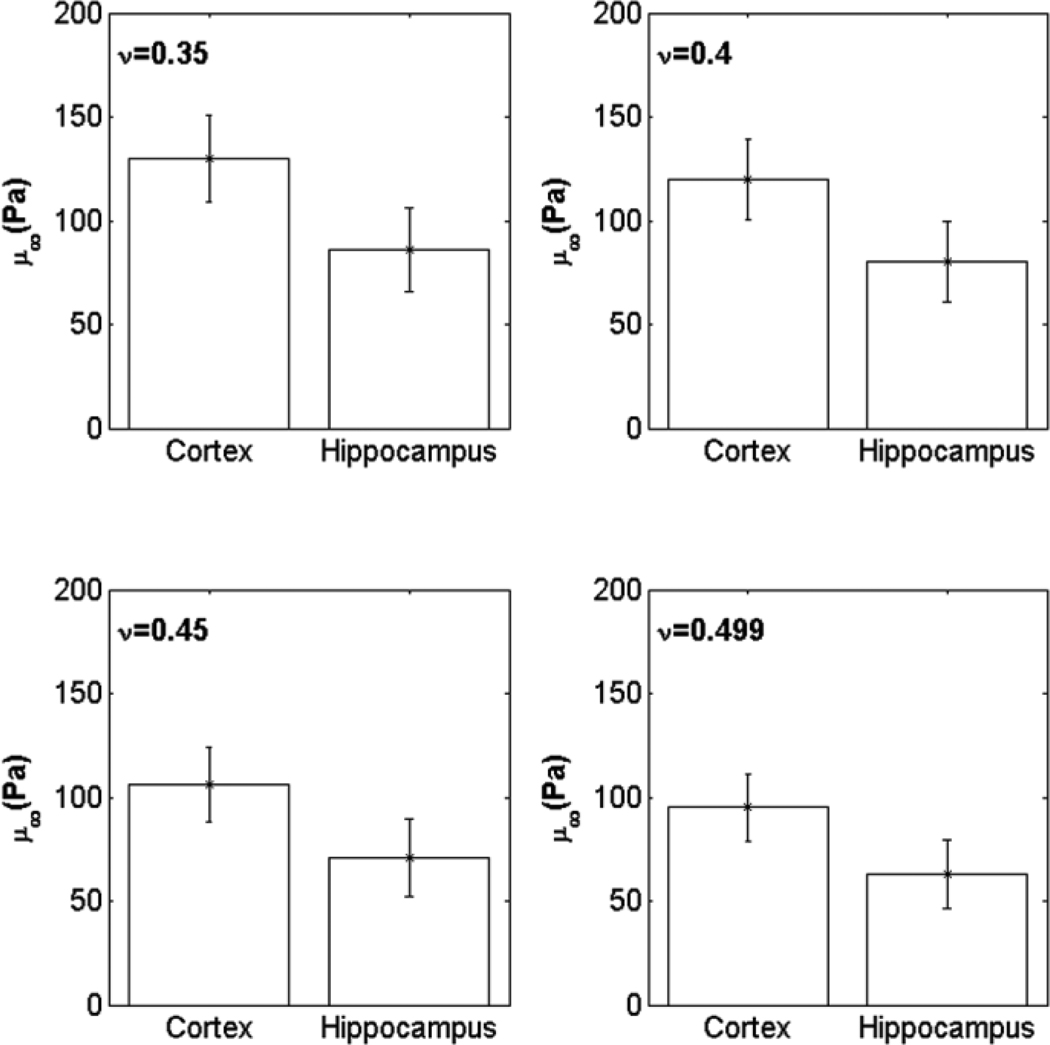
Currently, micro-indentation testing of soft biological materials is limited in its capability to test over long time scales due to accumulated instrumental drift errors. As a result, there is a paucity of measures for mechanical properties such as the equilibrium modulus. In this study, indentation combined with optical coherence tomography (OCT) was used for mechanical testing of thin tissue slices. OCT was used to measure the surface deformation profiles after placing spherical beads onto submerged test samples. Agarose-based hydrogels at low-concentrations (w/v, 0.3-0.6%) and acute rat brain tissue slices were tested using this technique over a 30-min time window. To establish that tissue slices maintained cell viability, allowable testing times were determined by measuring neuronal death or degeneration as a function of incubation time with Fluor-Jade C (FJC) staining. Since large deformations at equilibrium were measured, displacements of surface beads were compared with finite element elastic contact simulations to predict the equilibrium modulus, μ(∞) . Values of μ(∞) for the low-concentration hydrogels ranged from 0.07 to 1.8 kPa, and μ(∞) for acute rat brain tissue slices was 0.13 ± 0.04 kPa for the cortex and 0.09 ± 0.015 kPa for the hippocampus (for Poisson ratio = 0.35). This indentation technique offers a localized, real-time, and high resolution method for long-time scale mechanical testing of very soft materials. This test method may also be adapted for viscoelasticity, for testing of different tissues and biomaterials, and for analyzing changes in internal structures with loading.


Figures

Figure 1
Figure 1
Schematic of the OCT -based indentation system.
Figure 2
Figure 2
OCT images of the cerebral cortex (CC) region in rat brain tissue slices at varying perfusion times used to measure changes in tissue thickness. A 300 µm thick slice of the cerebral cortex at (a) 0 min, (b) 30 min, (c) 60 min and (d) 90 min.
Figure 3
Figure 3
OCT images of bead indentation of (a) 0.25%, (b) 0.3%, (c) 0.4% and (d) 0.5% (w/v) concentration agarose hydrogels. Hydrogels were indented using spherical tungsten carbide beads (OD=1.17 mm). d is the deformation depth.
Figure 4
Figure 4
Representative rat brain tissue slice images used for indentation analysis: (a) acute rat brain tissue slice. Red dots indicate points of indentation; OCT cross-sectional images taken before indentation testing for cerebral cortex (b1) and hippocampus (c1). During indentation testing (t = 30 min) of the cerebral cortex region (b2) and hippocampus (c2) with a spherical (OD= 1 mm) stainless steel bead. Slices were submerged in oxygenated aCSF. h is the initial tissue thickness; d is deformation depth; and CC and HP correspond to the cerebral cortex and hippocampus label, respectively.
Figure 5
Figure 5
Axially symmetric FE mesh of spherical indentation. l = 4 mm, h=4 mm and R=0.585 mm for the hydrogel study, l= 1.5 mm, h= 0.4 mm and R= 0.5 mm for rat brain tissue slices.
Figure 6
Figure 6
Viability testing of acute rat brain tissue slices. Hippocampal regions (DG: dentate gyrus, CA3 and CA1) were tested over 2 hour intervals (a- 0 hour, b- 2 hours, c- 4 hours, d- 6 hours and e-10 hours incubation time). Fluorescent images show bright green regions (red arrows) corresponding to degenerating neurons (FJC-positive). Extensive degeneration throughout the hippocampus was observed after 6 hours incubation.
Figure 7
Figure 7
Superimposed images of DAPI (blue) and FJC (green) fluorescent staining taken after a 6 hour incubation period. DAPI and FJC images were overlaid to confirm that FJC staining coincided spatially with neuronal cell bodies. DAPI binds to DNA and stains the nuclei inside cell bodies blue.
Figure 8
Figure 8
Indentation depths for various low-concentration agarose hydrogels. Depths of submerged spherical tungsten carbide beads were measured after 30 min (OD = 1.17 mm, FSS = 119 µN). Box plots show the upper and lower 25th percentile of indentation depths, mean value (+), and median (red line). Error bars show ± 1.5 interquartile from upper and lower hinges. Slice thickness = 4 mm; sample size n=5 at each concentration. (***) Significant difference in indentation depths between concentrations was tested by Tukey-Kramer test for p<0.05. 0.25, 0.3, 0.35, 0.4, and 0.5% hydrogel samples show significant differences in indentation depths from each other (p<0.0004). (*) 0.5 and 0.6 % hydrogels show a statistical difference using t-test (p<0.020).
Figure 9
Figure 9
Estimated μ in low-concentration agarose hydrogels for varying Poisson’s ratios. Indentation depths from constant force indentation were compared to FE model simulations to estimate μ (a–d). Modulus was fit to the power law (μ= a(Cw)n, a and n are fitting parameters) with concentration (e). for n =0.35, a=12937 and n=3.49, for n =0.40, a=12024 and n=3.49, for n =0.45, a=10999 and n=3.47, and for n =0.499, a=10395 and n=3.50. Indentation depths were averaged from 5 samples. Bars correspond to differences in μ calculated from ±1SD in depth.
Figure 10
Figure 10
Measured indentation depths within the cerebral cortex and hippocampus. Five rats were tested with three slices taken from each brain. Submerged slices were indented using stainless steel beads (t = 30 min, OD = 1 mm, FSS = 37 µN). The box plot shows the upper and lower 25th percentile of indentation depths, mean value (+), and median (red line). Error bars show minimum and maximum depths. Slice sample thickness = 400 µm; sample size n=5. A significant difference in indentation depths between the cortex and hippocampus was measured (p<0.0084).
Figure 11
Figure 11
Estimated μ in the cerebral cortex and hippocampus for varying Poisson’s ratio (ν). μ was estimated by comparing with FE simulations. The standard deviation (SD) of μ was calculated based on the upper and the lower SD values for measures of d. Bars show ±1SD.

References

    1. Chen X, Sarntinoranont M. Biphasic finite element model of solute transport for direct infusion into nervous tissue. Annals of Biomedical Engineering. 2007;35:2145–2158. - PubMed
    1. Nagashima T, Tamaki N, Matsumoto S, Horwitz B, Seguchi Y. Biomechanics of Hydrocephalus: A New Theoretical Model. Neurosurgery. 1987;21:898–904. - PubMed
    1. Taylor Z, Miller K. Reassessment of brain elasticity for analysis of biomechanisms of hydrocephalus. J of Biomechanics. 2004;37:1263–1269. - PubMed
    1. Ebenstein DM, Kuo A, Rodrigo JJ, Reddi AH, Ries M, Pruitt L. A nanoindentation technique for functional evaluation of cartilage repair tissue. J. of Materials Research. 2004;19(1):273–281.
    1. Ebenstein DM, Pruitt LA. Nanoindentation of soft hydrated materials for application to vascular tissues. J. of Biomedical Materials Research Part A. 2004;69A(2):222–232. - PubMed

Publication types