

Substrate specificity of protein tyrosine phosphatases 1B, RPTPα, SHP-1, and SHP-2
- PMID: 21291263
- PMCID: PMC3074353
- DOI: 10.1021/bi1014453
Substrate specificity of protein tyrosine phosphatases 1B, RPTPα, SHP-1, and SHP-2
Abstract
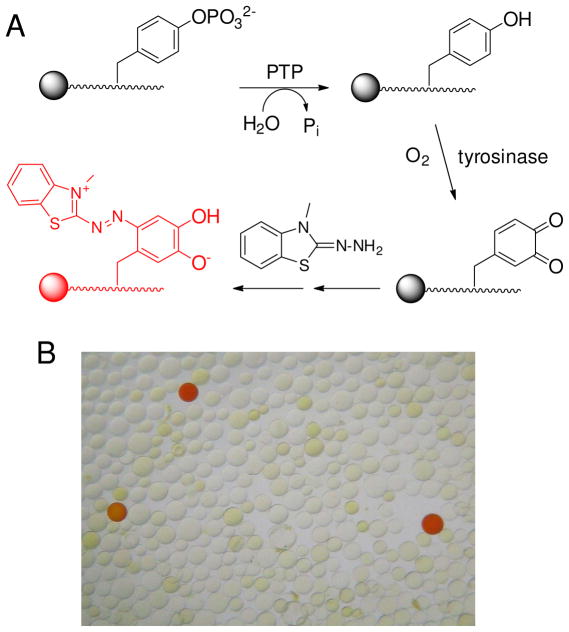
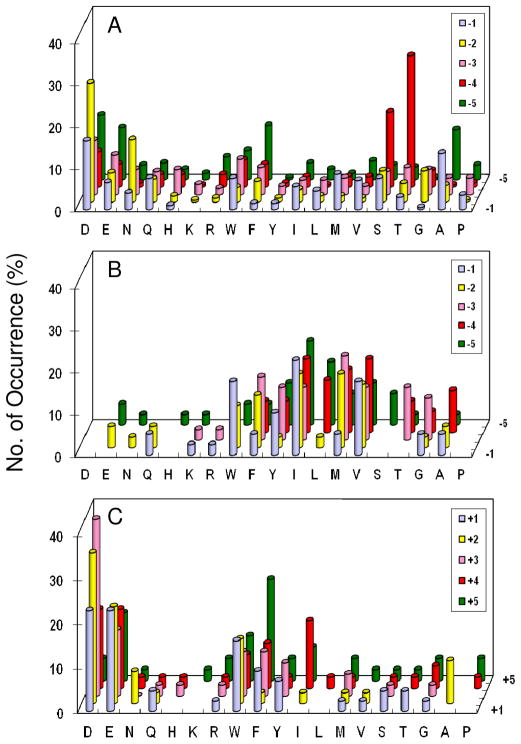
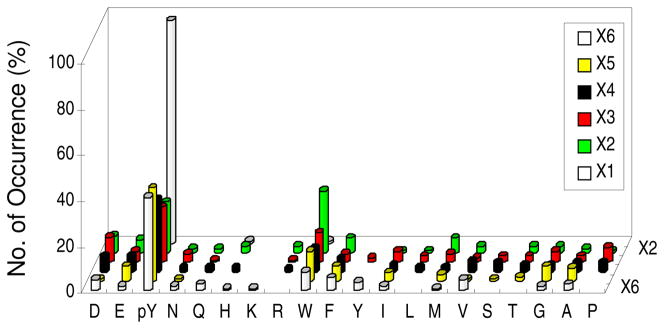
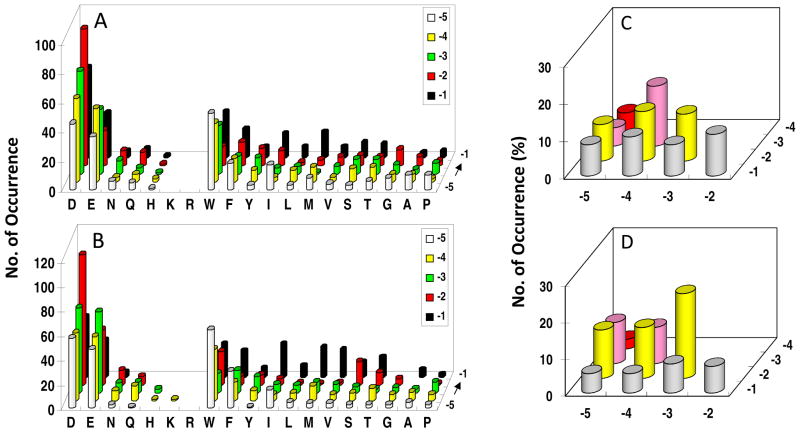
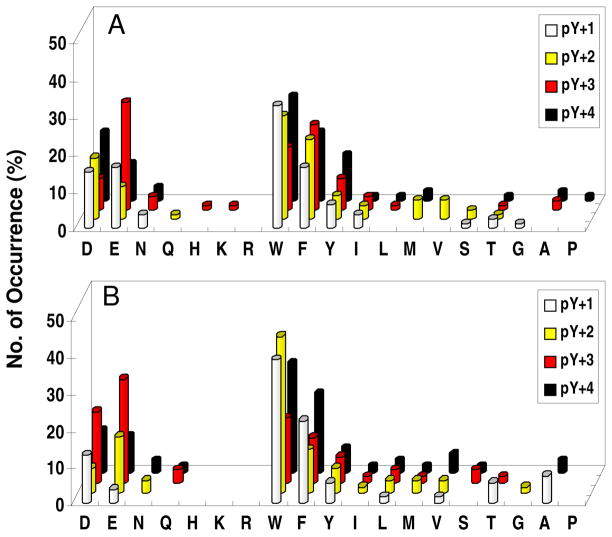
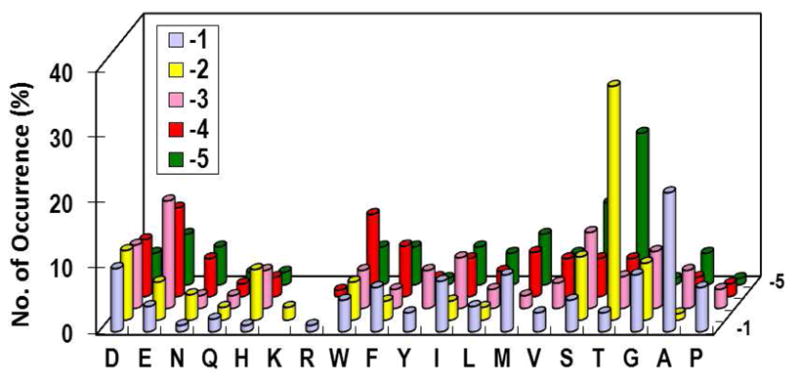
We determined the substrate specificities of the protein tyrosine phosphatases (PTPs) PTP1B, RPTPα, SHP-1, and SHP-2 by on-bead screening of combinatorial peptide libraries and solution-phase kinetic analysis of individually synthesized phosphotyrosyl (pY) peptides. These PTPs exhibit different levels of sequence specificity and catalytic efficiency. The catalytic domain of RPTPα has very weak sequence specificity and is approximately 2 orders of magnitude less active than the other three PTPs. The PTP1B catalytic domain has modest preference for acidic residues on both sides of pY, is highly active toward multiply phosphorylated peptides, but disfavors basic residues at any position, a Gly at the pY-1 position, or a Pro at the pY+1 position. By contrast, SHP-1 and SHP-2 share similar but much narrower substrate specificities, with a strong preference for acidic and aromatic hydrophobic amino acids on both sides of the pY residue. An efficient SHP-1/2 substrate generally contains two or more acidic residues on the N-terminal side and one or more acidic residues on the C-terminal side of pY but no basic residues. Subtle differences exist between SHP-1 and SHP-2 in that SHP-1 has a stronger preference for acidic residues at the pY-1 and pY+1 positions and the two SHPs prefer acidic residues at different positions N-terminal to pY. A survey of the known protein substrates of PTP1B, SHP-1, and SHP-2 shows an excellent agreement between the in vivo dephosphorylation pattern and the in vitro specificity profiles derived from library screening. These results suggest that different PTPs have distinct sequence specificity profiles and the intrinsic activity/specificity of the PTP domain is an important determinant of the enzyme's in vivo substrate specificity.
Figures
Similar articles
-
Diverse levels of sequence selectivity and catalytic efficiency of protein-tyrosine phosphatases.Biochemistry. 2014 Jan 21;53(2):397-412. doi: 10.1021/bi401223r. Epub 2014 Jan 7. Biochemistry. 2014. PMID: 24359314 Free PMC article.
-
Screening combinatorial libraries by mass spectrometry. 2. Identification of optimal substrates of protein tyrosine phosphatase SHP-1.Biochemistry. 2002 May 14;41(19):6202-10. doi: 10.1021/bi025591f. Biochemistry. 2002. PMID: 11994017
-
Sequence specificity of SHP-1 and SHP-2 Src homology 2 domains. Critical roles of residues beyond the pY+3 position.J Biol Chem. 2006 Jul 21;281(29):20271-82. doi: 10.1074/jbc.M601047200. Epub 2006 May 15. J Biol Chem. 2006. PMID: 16702225
-
A SHPing tale: perspectives on the regulation of SHP-1 and SHP-2 tyrosine phosphatases by the C-terminal tail.Cell Signal. 2005 Nov;17(11):1323-32. doi: 10.1016/j.cellsig.2005.05.016. Cell Signal. 2005. PMID: 16084691 Review.
-
SHP-1 and SHP-2 in T cells: two phosphatases functioning at many levels.Immunol Rev. 2009 Mar;228(1):342-59. doi: 10.1111/j.1600-065X.2008.00760.x. Immunol Rev. 2009. PMID: 19290938 Free PMC article. Review.
Cited by
-
Specificity profiling of protein phosphatases toward phosphoseryl and phosphothreonyl peptides.J Am Chem Soc. 2013 Jul 3;135(26):9760-7. doi: 10.1021/ja401692t. Epub 2013 Jun 20. J Am Chem Soc. 2013. PMID: 23758517 Free PMC article.
-
Tyrosine phosphatase activity is restricted by basic charge substituting mutation of substrates.Sci Rep. 2022 Sep 5;12(1):15095. doi: 10.1038/s41598-022-19133-4. Sci Rep. 2022. PMID: 36064958 Free PMC article.
-
Identification of PP1-Gadd34 substrates involved in the unfolded protein response using K-BIPS, a method for phosphatase substrate identification.Mol Omics. 2018 Apr 16;14(2):121-133. doi: 10.1039/c7mo00064b. Mol Omics. 2018. PMID: 29623310 Free PMC article.
-
Antibody:CD47 ratio regulates macrophage phagocytosis through competitive receptor phosphorylation.Cell Rep. 2021 Aug 24;36(8):109587. doi: 10.1016/j.celrep.2021.109587. Cell Rep. 2021. PMID: 34433055 Free PMC article.
-
CD22L Conjugation to Insulin Attenuates Insulin-Specific B Cell Activation.Bioconjug Chem. 2023 Nov 15;34(11):2077-2088. doi: 10.1021/acs.bioconjchem.3c00391. Epub 2023 Oct 26. Bioconjug Chem. 2023. PMID: 37883211 Free PMC article.
References
-
- Alonso A, Sasin J, Bottini N, Friedberg I, Osterman A, Godzik A, Hunter T, Dixon J, Mustelin T. Protein tyrosine phosphatases in the human genome. Cell. 2004;117:699–711. - PubMed
-
- Tonks NK, Neel BG. Combinatorial control of the specificity of protein tyrosine phosphatases. Curr Opin Cell Biol. 2001;13:182–195. - PubMed
-
- Frangioni JV, Beahm PH, Shifrin V, Jost CA, Neel BG. The nontransmembrane tyrosine phosphatase PTP1B localizes to the endoplasmic reticulum via its 35 amino acid C-terminal sequence. Cell. 1992;68:545–560. - PubMed
-
- Elchelby M, Payette P, Michaliszyn E, Cromlish W, Collins S, Lee Loy A, Normandin D, Cheng A, Himms-Hagen J, Chan CC, Ramanchandran C, Gresser MJ, Tremblay ML, Kennedy BP. Increased insulin sensitivity and obesity resistance in mice lacking the protein phosphatase-1B gene. Science. 1999;283:1544–1548. - PubMed
-
- Julien SG, Dube N, Read M, Penney J, Paquet M, Han YX, Kennedy BP, Muller WJ, Tremblay ML. Protein tyrosine phosphatase 1B deficiency or inhibition delays Erb2-induced mammary tumorigenesis and protects from lung metastasis. Nat Genet. 2007;39:339–346. - PubMed
Publication types
MeSH terms
Substances
Grants and funding
LinkOut - more resources
Full Text Sources
Other Literature Sources
Molecular Biology Databases
Miscellaneous
