

The Japanese mutant Aβ (ΔE22-Aβ(1-39)) forms fibrils instantaneously, with low-thioflavin T fluorescence: seeding of wild-type Aβ(1-40) into atypical fibrils by ΔE22-Aβ(1-39)
- PMID: 21291268
- PMCID: PMC3631511
- DOI: 10.1021/bi1016217
The Japanese mutant Aβ (ΔE22-Aβ(1-39)) forms fibrils instantaneously, with low-thioflavin T fluorescence: seeding of wild-type Aβ(1-40) into atypical fibrils by ΔE22-Aβ(1-39)
Abstract
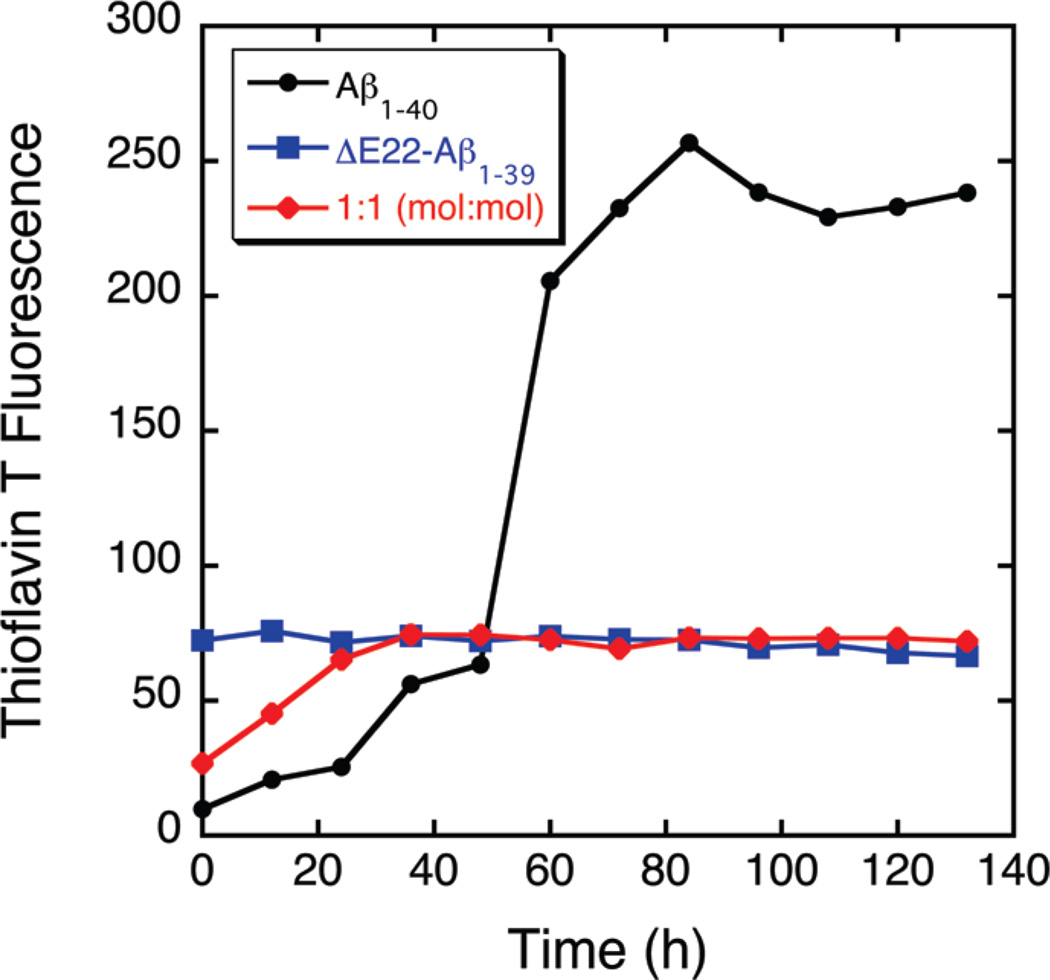
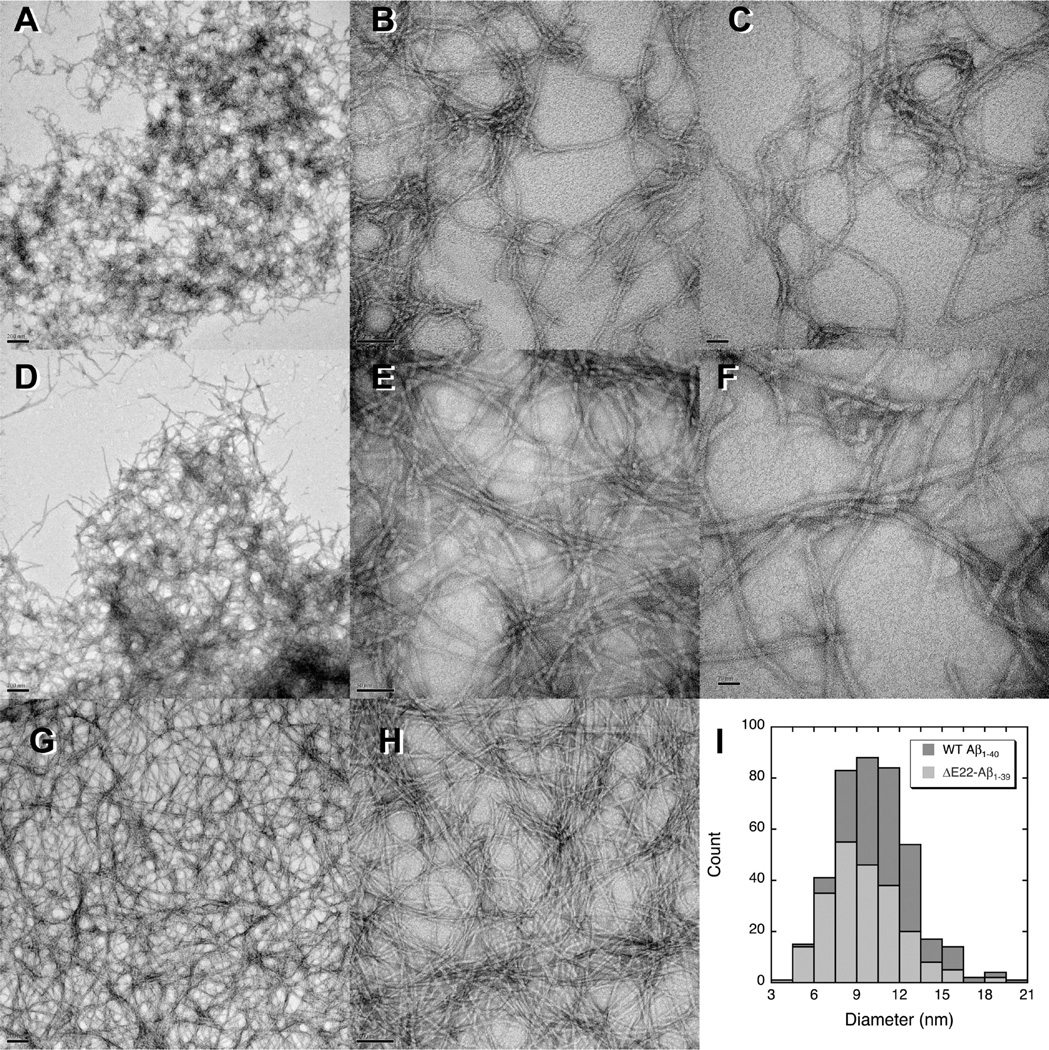
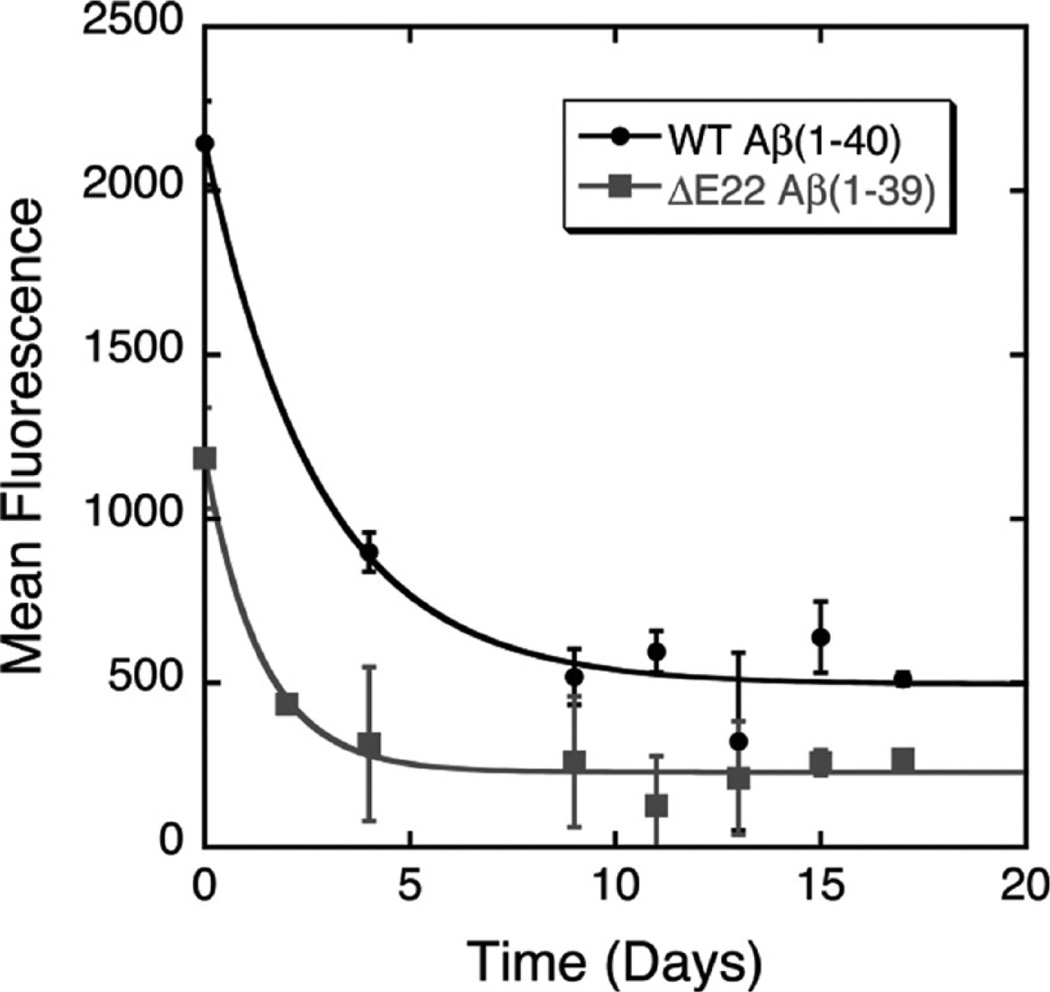
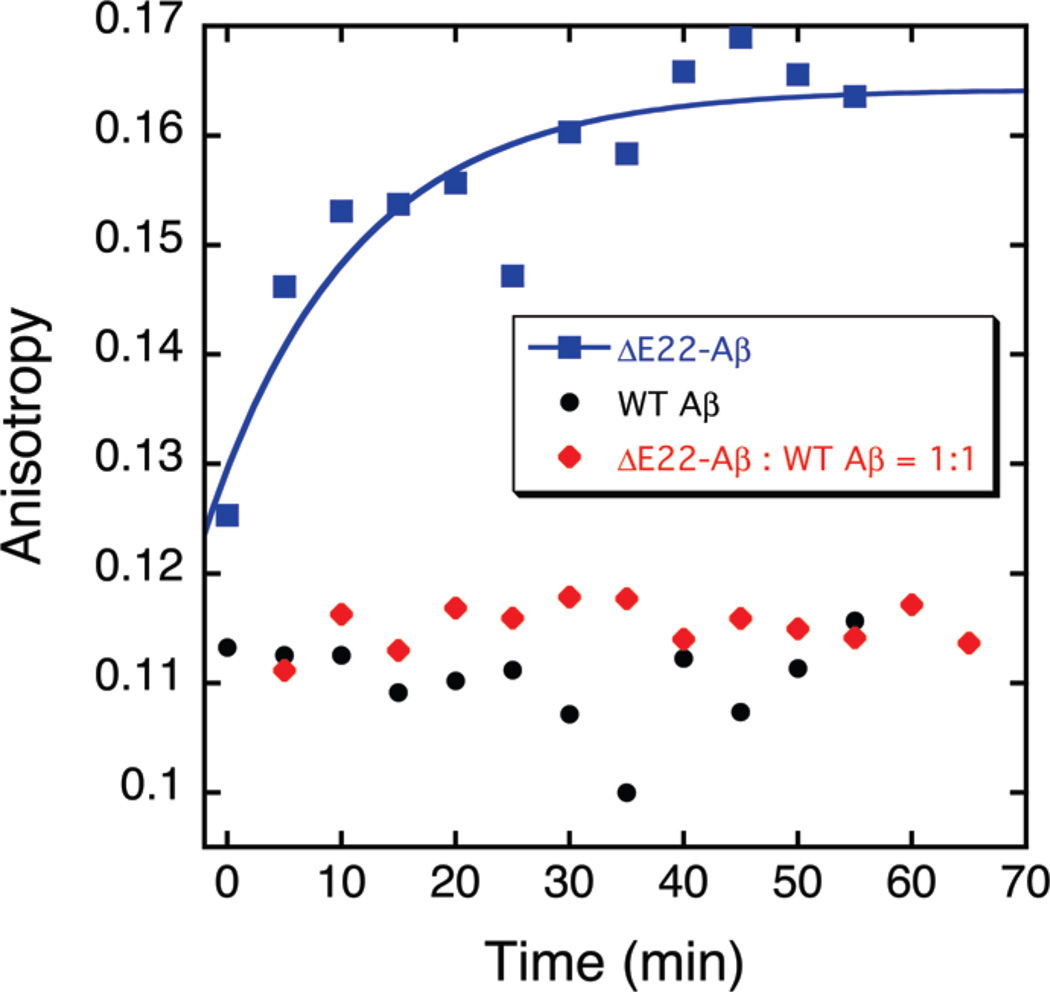
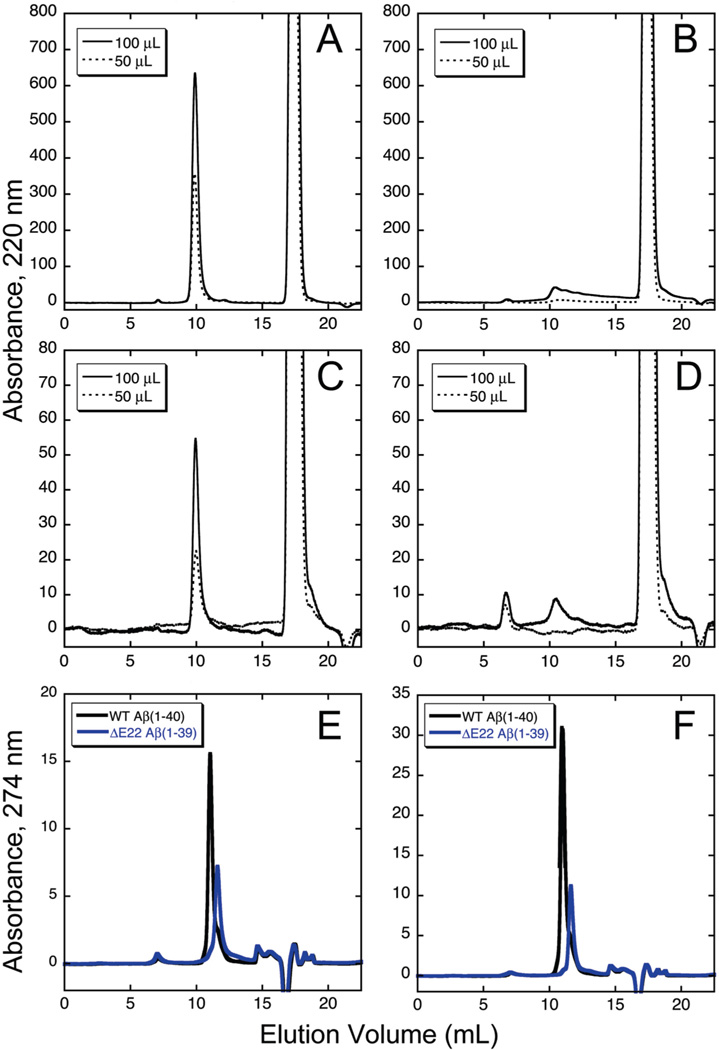
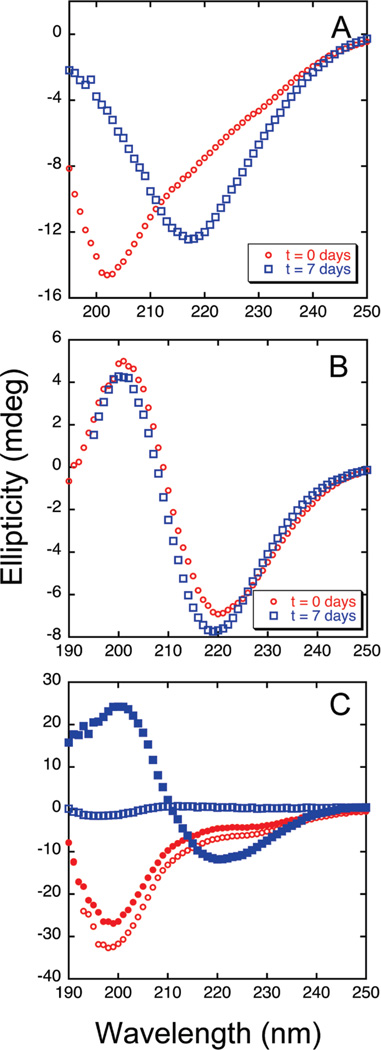
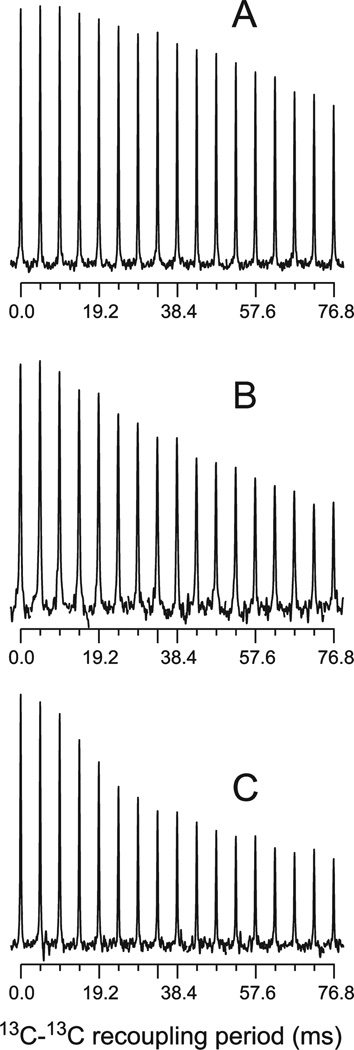
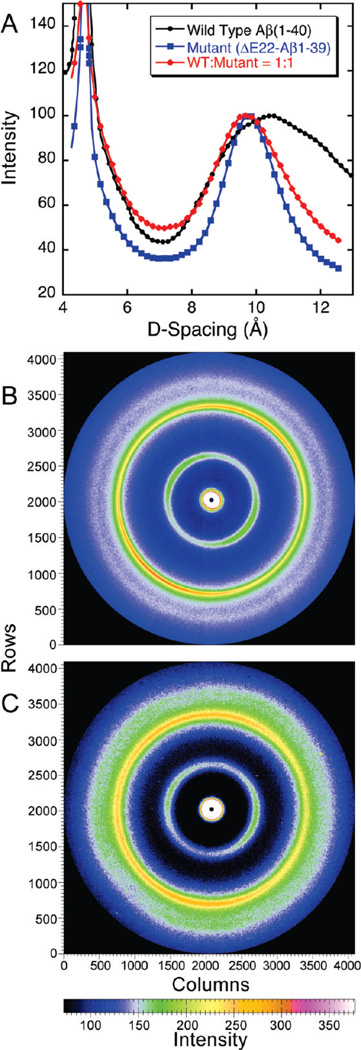
The ΔE693 (Japanese) mutation of the β-amyloid precursor protein leads to production of ΔE22-Aβ peptides such as ΔE22-Aβ(1-39). Despite reports that these peptides do not form fibrils, here we show that, on the contrary, the peptide forms fibrils essentially instantaneously. The fibrils are typical amyloid fibrils in all respects except that they cause only low levels of thioflavin T (ThT) fluorescence, which, however, develops with no lag phase. The fibrils bind ThT, but with a lower affinity and a smaller number of binding sites than wild-type (WT) Aβ(1-40). Fluorescence depolarization confirms extremely rapid aggregation of ΔE22-Aβ(1-39). Size exclusion chromatography (SEC) indicates very low concentrations of soluble monomer and oligomer, but only in the presence of some organic solvent, e.g., 2% (v/v) DMSO. The critical concentration is approximately 1 order of magnitude lower for ΔE22-Aβ(1-39) than for WT Aβ(1-40). Several lines of evidence point to an altered structure for ΔE22-Aβ(1-39) compared to that of WT Aβ(1-40) fibrils. In addition to differences in ThT binding and fluorescence, PITHIRDS-CT solid-state nuclear magnetic resonance (NMR) measurements of ΔE22-Aβ(1-39) are not compatible with the parallel in-register β-sheet generally observed for WT Aβ(1-40) fibrils. X-ray fibril diffraction showed different D spacings: 4.7 and 10.4 Å for WT Aβ(1-40) and 4.7 and 9.6 Å for ΔE22-Aβ(1-39). Equimolar mixtures of ΔE22-Aβ(1-39) and WT Aβ(1-40) also produced fibrils extremely rapidly, and by the criteria of ThT fluorescence and electron microscopic appearance, they were the same as fibrils made from pure ΔE22-Aβ(1-39). X-ray diffraction of fibrils formed from 1:1 molar mixtures of ΔE22-Aβ(1-39) and WT Aβ(1-40) showed the same D spacings as fibrils of the pure mutant peptide, not the wild-type peptide. These findings are consistent with extremely rapid nucleation by ΔE22-Aβ(1-39), followed by fibril extension by WT Aβ(1-40), and "conversion" of the wild-type peptide to a structure similar to that of the mutant peptide, in a manner reminiscent of the prion conversion phenomenon.
Figures

Similar articles
-
Familial Alzheimer's disease Osaka mutant (ΔE22) β-barrels suggest an explanation for the different Aβ1-40/42 preferred conformational states observed by experiment.J Phys Chem B. 2013 Oct 3;117(39):11518-29. doi: 10.1021/jp405389n. Epub 2013 Sep 13. J Phys Chem B. 2013. PMID: 24000923 Free PMC article.
-
Structural dynamics of the ΔE22 (Osaka) familial Alzheimer's disease-linked amyloid β-protein.Amyloid. 2011 Sep;18(3):98-107. doi: 10.3109/13506129.2011.580399. Epub 2011 Jun 13. Amyloid. 2011. PMID: 21668291 Free PMC article.
-
Evidence for novel beta-sheet structures in Iowa mutant beta-amyloid fibrils.Biochemistry. 2009 Jul 7;48(26):6072-84. doi: 10.1021/bi9002666. Biochemistry. 2009. PMID: 19358576 Free PMC article.
-
Solid-state NMR as a method to reveal structure and membrane-interaction of amyloidogenic proteins and peptides.Biochim Biophys Acta. 2007 Aug;1768(8):1900-12. doi: 10.1016/j.bbamem.2007.03.025. Epub 2007 Apr 5. Biochim Biophys Acta. 2007. PMID: 17524351 Review.
-
New Mechanism of Amyloid Fibril Formation.Curr Protein Pept Sci. 2019;20(6):630-640. doi: 10.2174/1389203720666190125160937. Curr Protein Pept Sci. 2019. PMID: 30686252 Review.
Cited by
-
Aβ and Tau Prions Causing Alzheimer's Disease.Methods Mol Biol. 2023;2561:293-337. doi: 10.1007/978-1-0716-2655-9_16. Methods Mol Biol. 2023. PMID: 36399277
-
Out-of-Register Aβ42 Assemblies as Models for Neurotoxic Oligomers and Fibrils.J Chem Theory Comput. 2018 Feb 13;14(2):1099-1110. doi: 10.1021/acs.jctc.7b01106. Epub 2018 Jan 31. J Chem Theory Comput. 2018. PMID: 29357242 Free PMC article.
-
X-ray micro-diffraction studies on biological samples at the BioCAT Beamline 18-ID at the Advanced Photon Source.J Synchrotron Radiat. 2014 Sep;21(Pt 5):1200-5. doi: 10.1107/S1600577514012259. Epub 2014 Aug 8. J Synchrotron Radiat. 2014. PMID: 25178013 Free PMC article.
-
The dye SYPRO orange binds to amylin amyloid fibrils but not pre-fibrillar intermediates.Protein Sci. 2016 Oct;25(10):1834-40. doi: 10.1002/pro.2992. Epub 2016 Aug 23. Protein Sci. 2016. PMID: 27479186 Free PMC article.
-
Familial Alzheimer's Disease-Related Mutations Differentially Alter Stability of Amyloid-Beta Aggregates.J Phys Chem Lett. 2023 Feb 16;14(6):1427-1435. doi: 10.1021/acs.jpclett.2c03729. Epub 2023 Feb 3. J Phys Chem Lett. 2023. PMID: 36734539 Free PMC article.
References
-
- Levy E, Carman MD, Fernandez-Madrid IJ, Power MD, Lieberburg I, van Duinen SG, Bots GTAM, Luyendijk W, Frangione B. Mutation of the Alzheimer’s disease amyloid gene in hereditary cerebral hemorrhage, Dutch type. Science. 1990;248:1124–1126. - PubMed
-
- Van Broeckhoven C, Haan J, Bakker E, Hardy JA, Van Hul W, Wehnert A, Vegter-Van der Vlis M, Roos RAC. Amyloid β protein precursor gene and hereditary cerebral hemorrhage with amyloidosis (Dutch) Science. 1990;248:1120–1122. - PubMed
-
- Cras P, van Harskamp F, Hendriks L, Ceuterick C, van Duijn CM, Stefanko SZ, Hofman A, Kros JM, Van Broeckhoven C, Martin JJ. Presenile Alzheimer dementia characterized by amyloid angiopathy and large amyloid core type senile plaques in the APP 692Ala → Gly mutation. Acta Neuropathol. 1998;96:253–260. - PubMed
-
- Tagliavini F, Rossi G, Padovani A, Magoni M, Andora G, Sgarzi M, Bizzi A, Savioardo M, Carella F, Morbin M, Giaccone G, Bugiani O. A new bPP mutation related to hereditary cerebral haemorrhage. Alzheimer’s Rep. 1999;2(Suppl.):S28.
-
- Nilsberth C, Westlind-Danielsson A, Eckman CB, Condron MM, Axelman K, Forsell C, Stenh C, Luthman J, Teplow DB, Younkin SG, Näslund J, Lannfelt L. The 'Arctic' APP mutation (E693G) causes Alzheimer’s disease by enhanced Aβ protofibril formation. Nat. Neurosci. 2001;4:887–893. - PubMed
Publication types
MeSH terms
Substances
Grants and funding
LinkOut - more resources
Full Text Sources
