

Characterization of monocyte maturation/differentiation that facilitates their transmigration across the blood-brain barrier and infection by HIV: implications for NeuroAIDS
- PMID: 21292246
- PMCID: PMC4335637
- DOI: 10.1016/j.cellimm.2010.12.004
Characterization of monocyte maturation/differentiation that facilitates their transmigration across the blood-brain barrier and infection by HIV: implications for NeuroAIDS
Abstract
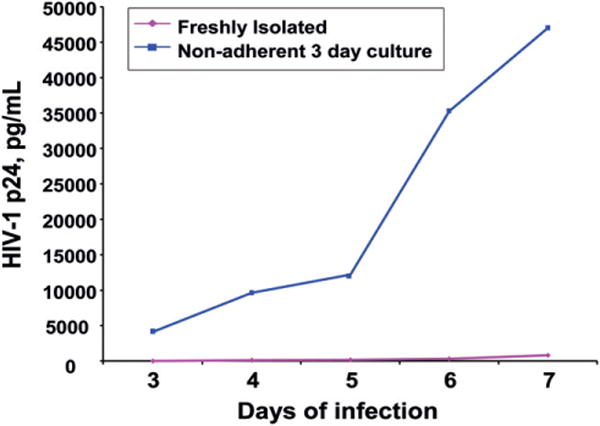
The prevalence of human immunodeficiency virus 1 (HIV) associated neurocognitive disorders resulting from infection of the central nervous system (CNS) by HIV continues to increase despite the success of combination antiretroviral therapy. Although monocytes are known to transport HIV across the blood-brain barrier (BBB) into the CNS, there are few specific markers that identify monocyte subpopulations susceptible to HIV infection and/or capable of infiltrating the CNS. We cultured human peripheral blood monocytes and characterized the expression of the phenotypic markers CD14, CD16, CD11b, Mac387, CD163, CD44v6 and CD166 during monocyte/macrophage (Mo/Mac) maturation/differentiation. We determined that a CD14(+)CD16(+)CD11b(+)Mac387(+) Mo/Mac subpopulation preferentially transmigrates across our in vitro BBB model in response to CCL2. Genes associated with Mo/Mac subpopulations that transmigrate across the BBB and/or are infected by HIV were identified by cDNA microarray analyses. Our findings contribute to the understanding of monocyte maturation, infection and transmigration into the brain during the pathogenesis of NeuroAIDS.
Copyright © 2011 Elsevier Inc. All rights reserved.
Figures


Similar articles
-
Monocytes mediate HIV neuropathogenesis: mechanisms that contribute to HIV associated neurocognitive disorders.Curr HIV Res. 2014;12(2):85-96. doi: 10.2174/1570162x12666140526114526. Curr HIV Res. 2014. PMID: 24862333 Free PMC article. Review.
-
Mechanisms of HIV entry into the CNS: increased sensitivity of HIV infected CD14+CD16+ monocytes to CCL2 and key roles of CCR2, JAM-A, and ALCAM in diapedesis.PLoS One. 2013 Jul 26;8(7):e69270. doi: 10.1371/journal.pone.0069270. Print 2013. PLoS One. 2013. PMID: 23922698 Free PMC article.
-
Mechanisms of CNS Viral Seeding by HIV+ CD14+ CD16+ Monocytes: Establishment and Reseeding of Viral Reservoirs Contributing to HIV-Associated Neurocognitive Disorders.mBio. 2017 Oct 24;8(5):e01280-17. doi: 10.1128/mBio.01280-17. mBio. 2017. PMID: 29066542 Free PMC article.
-
Frontline Science: Buprenorphine decreases CCL2-mediated migration of CD14+ CD16+ monocytes.J Leukoc Biol. 2018 Dec;104(6):1049-1059. doi: 10.1002/JLB.3HI0118-015R. Epub 2018 May 23. J Leukoc Biol. 2018. PMID: 29791013 Free PMC article.
-
Monocyte maturation, HIV susceptibility, and transmigration across the blood brain barrier are critical in HIV neuropathogenesis.J Leukoc Biol. 2012 Mar;91(3):401-15. doi: 10.1189/jlb.0811394. Epub 2012 Jan 6. J Leukoc Biol. 2012. PMID: 22227964 Free PMC article. Review.
Cited by
-
Genetic, transcriptomic, and epigenetic studies of HIV-associated neurocognitive disorder.J Acquir Immune Defic Syndr. 2014 Apr 1;65(4):481-503. doi: 10.1097/QAI.0000000000000069. J Acquir Immune Defic Syndr. 2014. PMID: 24583618 Free PMC article. Review.
-
Monocytes mediate HIV neuropathogenesis: mechanisms that contribute to HIV associated neurocognitive disorders.Curr HIV Res. 2014;12(2):85-96. doi: 10.2174/1570162x12666140526114526. Curr HIV Res. 2014. PMID: 24862333 Free PMC article. Review.
-
Co-receptor signaling in the pathogenesis of neuroHIV.Retrovirology. 2021 Aug 24;18(1):24. doi: 10.1186/s12977-021-00569-x. Retrovirology. 2021. PMID: 34429135 Free PMC article. Review.
-
HIV-1 Tat disrupts blood-brain barrier integrity and increases phagocytic perivascular macrophages and microglia in the dorsal striatum of transgenic mice.Neurosci Lett. 2017 Feb 15;640:136-143. doi: 10.1016/j.neulet.2016.12.073. Epub 2017 Jan 3. Neurosci Lett. 2017. PMID: 28057474 Free PMC article.
-
Buprenorphine reverses neurocognitive impairment in EcoHIV infected mice: A potential therapy for HIV-NCI.Front Immunol. 2022 Oct 7;13:1004985. doi: 10.3389/fimmu.2022.1004985. eCollection 2022. Front Immunol. 2022. PMID: 36275760 Free PMC article.
References
-
- Antinori A, Arendt G, Becker JT, Brew BJ, Byrd DA, Cherner M, Clifford DB, Cinque P, Epstein LG, Goodkin K, Gisslen M, Grant I, Heaton RK, Joseph J, Marder K, Marra CM, McArthur JC, Nunn M, Price RW, Pulliam L, Robertson KR, Sacktor N, Valcour V, Wojna VE. Updated research nosology for HIV-associated neurocognitive disorders. Neurology. 2007;69:1789–1799. - PMC - PubMed
-
- Koenig S, Gendelman HE, Orenstein JM, Dal Canto MC, Pezeshkpour GH, Yungbluth M, Janotta F, Aksamit A, Martin MA, Fauci AS. Detection of AIDS virus in macrophages in brain tissue from AIDS patients with encephalopathy. Science. 1986;233:1089–1093. - PubMed
-
- Speth C, Dierich MP, Sopper S. HIV-infection of the central nervous system: the tightrope walk of innate immunity. Mol Immunol. 2005;42:213–228. - PubMed
Publication types
MeSH terms
Substances
Grants and funding
LinkOut - more resources
Full Text Sources
Other Literature Sources
Research Materials
