. 2011 Apr 1;286(13):11370-81.
doi: 10.1074/jbc.M110.139410. Epub 2011 Feb 3.

P2X7 receptors trigger ATP exocytosis and modify secretory vesicle dynamics in neuroblastoma cells

Affiliations

P2X7 receptors trigger ATP exocytosis and modify secretory vesicle dynamics in neuroblastoma cells

Yolanda Gutiérrez-Martín et al. J Biol Chem. .

Abstract

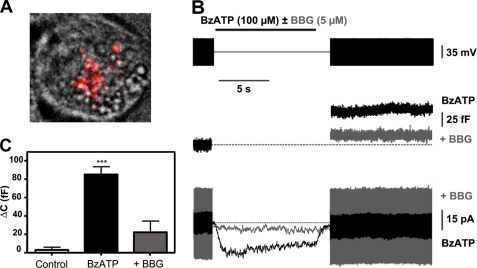
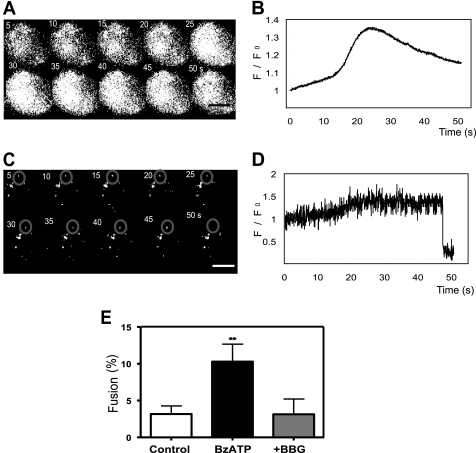
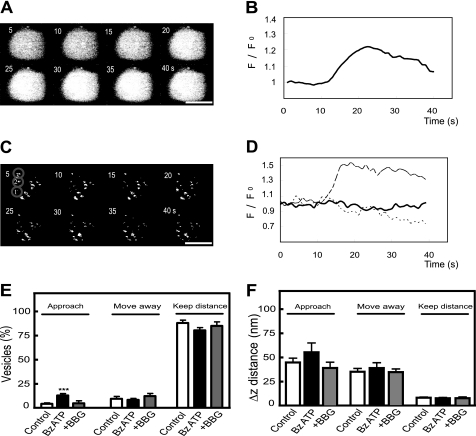
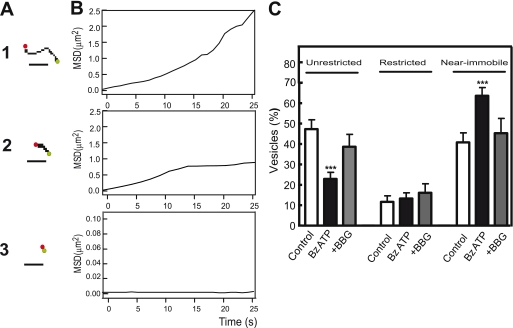
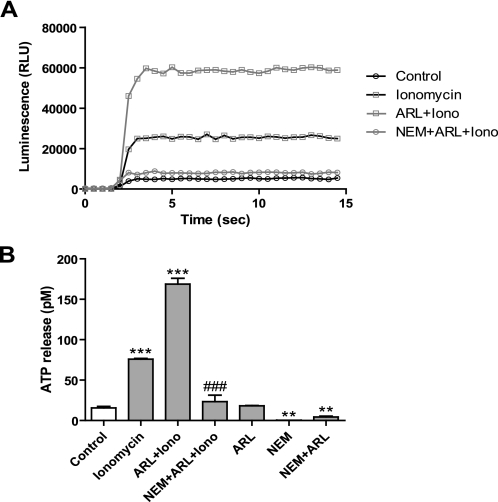
Previously, we reported that purinergic ionotropic P2X7 receptors negatively regulate neurite formation in Neuro-2a (N2a) mouse neuroblastoma cells through a Ca(2+)/calmodulin-dependent kinase II-related mechanism. In the present study we used this cell line to investigate a parallel though faster P2X7 receptor-mediated signaling pathway, namely Ca(2+)-regulated exocytosis. Selective activation of P2X7 receptors evoked exocytosis as assayed by high resolution membrane capacitance measurements. Using dual-wavelength total internal reflection microscopy, we have observed both the increase in near-membrane Ca(2+) concentration and the exocytosis of fluorescently labeled vesicles in response to P2X7 receptor stimulation. Moreover, activation of P2X7 receptors also affects vesicle motion in the vertical and horizontal directions, thus, involving this receptor type in the control of early steps (docking and priming) of the secretory pathway. Immunocytochemical and RT-PCR experiments evidenced that N2a cells express the three neuronal SNAREs as well as vesicular nucleotide and monoamine (VMAT-1 and VMAT-2) transporters. Biochemical measurements indicated that ionomycin induced a significant release of ATP from N2a cells. Finally, P2X7 receptor stimulation and ionomycin increased the incidence of small transient inward currents, reminiscent of postsynaptic quantal events observed at synapses. Small transient inward currents were dependent on extracellular Ca(2+) and were abolished by Brilliant Blue G, suggesting they were mediated by P2X7 receptors. Altogether, these results suggest the existence of a positive feedback mechanism mediated by P2X7 receptor-stimulated exocytotic release of ATP that would act on P2X7 receptors on the same or neighbor cells to further stimulate its own release and negatively control N2a cell differentiation.


Figures

FIGURE 1.
FIGURE 1.
P2X7 receptor stimulation triggers exocytosis from N2a cells. A, superimposed images of an N2a cell loaded with Lysotracker red visualized using bright field and TIRF microscopy are shown. Note the rounded shape of the cell and the granular appearance of its cytoplasm under differential interference contrast optics; the fluorescence image shows Lysotracker red-labeled vesicles located in a ≈200-nm thin layer of cytosol adjacent to the plasma membrane in contact with the glass coverslip (“footprint”). B, a patch clamp recording of whole-cell currents (lower panel) and membrane capacitance changes (middle panel) induced by BzATP (100 μm, 10 s; BzATP) in the absence and the presence of BBG (5 μm; +BBG) in a N2a cell is shown. BBG was administered 3 min before and during BzATP application. Dashed lines indicate membrane capacitance before stimulation and a zero current level, respectively. Current responses to a voltage sine wave (1-Hz, 70-mV peak to peak; black boxes in the voltage protocol shown in the upper panel) were used to estimate membrane capacitance. Vh = −70 mV. C, capacitance changes evoked by BzATP in the absence (BzATP; n = 9 cells) and the presence of BBG (+BBG; n = 5 cells) in N2a cells are shown. The control bar depicts the capacitance response to Locke's superfusion in a different set of cells (n = 5 cells). ***, p < 0.005 with respect to control.
FIGURE 2.
FIGURE 2.
P2X7 receptor stimulation increases submembrane [Ca2+]i and induces LDCV exocytosis from N2a cells. N2a cells were incubated with rhod-2 and quinacrine as described under “Experimental Procedures.” Cells were placed in a superfusion chamber, and fluorescence was excited alternating with 488-nm (to excite quinacrine) and 561-nm light (to excite rhod-2) under total internal reflection fluorescence conditions. Images were taken at 50-ms intervals. Bath perfusion with 100 μm BzATP for 30 s started at t = 0. A, time-lapse series of images at 5-s intervals of rhod-2 fluorescence from the footprint of a N2a cell after superfusion with BzATP is shown. B, shown is the time course of spatially averaged changes in rhod-2 fluorescence from the cell shown in A. C, shown is a time-lapse series of images at 5-s intervals of quinacrine-labeled vesicles from the footprint of the cell shown in A. The gray circle in the upper region of every image denotes a quinacrine-labeled vesicle that is exocytosed between 45 and 50 s after the beginning of BzATP stimulation. D, shown is the time-course of quinacrine fluorescence for the region of interest comprised in the circle defined in C. The rapid loss of the quinacrine signal at t ≈ 47 s is apparent. E, P2X7 receptor activation increases the frequency of LDCV fusions in N2a cells. Frequency of vesicle fusion was estimated by counting the number of quinacrine-labeled granules lost over 50 s after a change in the superfusion medium and expressed as a percentage of total quinacrine spots. Control, Locke's solution (n = 48 cells); BzATP, BzATP 100 μm for 30 s (n = 52 cells); +BBG, BzATP in the presence of BBG 5 μm (n = 20 cells). BBG was administered 5 min before and during BzATP perfusion. Note that the frequency of fusions is significantly (p < 0.01) higher in BzATP-stimulated cells as compared with cells superfused with plain Locke's solution or cells stimulated with BzATP in the presence of BBG. Calibration bar in A and C, 10 μm.
FIGURE 3.
FIGURE 3.
P2X7 receptor stimulation modifies axial movement of LDCVs. Cells were loaded with Lysotracker red and fluo-4 as indicated under “Experimental Procedures,” and TIRFM images were taken at 1-s intervals. A, shown is a time-lapse series of images at 5-s intervals of fluo-4 fluorescence from the footprint of a N2a cell after superfusion with BzATP (100 μm for 30 s; initiated at t = 0). B, shown is the time-course of spatially averaged changes in fluo-4 fluorescence from the cell shown in A. C, shown is a time-lapse series of images at 5-s intervals of a group of Lysotracker red-tagged vesicles from the footprint of the cell shown in A. Changes in vesicle fluorescence over time reflect the movement of the vesicles toward and away from the plasma membrane. Three vesicles representative of different motion behaviors appear encircled and numbered (1, 2, and 3). D, shown is the time-course of changes in fluorescence of the regions of interest comprised in the circles drawn in C. The dashed line reflects the axial movement of vesicle 1 that approaches the plasma membrane, the dotted line reports on vesicle 2 that moves away from the membrane, and the continuous line refers to vesicle 3 that keeps its distance to the membrane. E, P2X7 receptor stimulation increases the fraction of LDCVs approaching the plasma membrane. Relative distribution in non-stimulated N2a cells (Control, 199 vesicles from 42 cells), N2a cells stimulated with 100 μm BzATP (Bz-ATP, 284 vesicles from 57 cells), and N2a cells stimulated with 100 μm BzATP in the presence of 5 μm BBG (+BBG, 95 vesicles from 18 cells) of three groups of LDCVs defined according to their type of movement in the xz plane; left bars, vesicles approaching the membrane; middle bars, vesicles moving away from the plasma membrane; right bars, vesicles keeping their distance to the membrane. BBG was administered 5 min before and during BzATP perfusion. Note that the population of vesicles that gets closer to the membrane in BzATP-stimulated cells is significantly (p < 0.005) larger than in control cells or BzATP-stimulated cells in the presence of BBG. F, Δz distance covered by vesicles within the three different axial movement groups from non-stimulated N2a cells (Control), N2a cells stimulated with 100 μm BzATP (Bz-ATP), and N2a cells stimulated with 100 μm BzATP in the presence of 5 μm BBG (+BBG) is shown. LDCVs analyzed were the same as in E. Calibration bar in A and C, 10 μm.
FIGURE 4.
FIGURE 4.
P2X7 receptor stimulation reduces parallel movement of LDCVs. A, vesicle trajectories in the xy plane are shown. Three types of movement were distinguished on the basis of maximal displacement of the vesicles within a time window of 25 s: unrestricted movement (exemplified by the vesicle in A1), restricted movement (exemplified by the vesicle shown in A2), and near immobility (exemplified by the vesicle shown in A3). Green dots show the initial position in the trajectory, and red dots show the end position. Calibration bar, 1 μm. B, shown are mean square displacements (MSD) at different time intervals from the trajectories shown in A. C, relative distribution in non-stimulated N2a cells (Control, 199 vesicles from 42 cells), N2a cells stimulated with 100 μm BzATP (Bz-ATP, 284 vesicles from 57 cells), and N2a cells stimulated with 100 μm BzATP in the presence of 5 μm BBG (+BBG, 95 vesicles from 18 cells) of LDCV pools defined according to their type of movement in the xy plane; left bars, unrestricted motion; middle bars, restricted motion; right bars, near immobility. Note that the fraction of near immobile vesicles in BzATP-stimulated cells is significantly larger than in control cells, and the fraction of vesicles with unrestricted motion has been comparatively reduced (p < 0.005 in both cases).
FIGURE 5.
FIGURE 5.
N2a cells release ATP by a NEM-sensitive mechanism. A, shown are representative records of luminescence evoked by ATP released into the extracellular medium of N2a cells before (Control) and after ionomycin (10 μm) stimulation in the absence (ionomycin) or presence of the ecto-ATPase inhibitor ARL67156 (100 μm; ARL + Iono) or ARL67156 plus the exocytosis inhibitor NEM (500 μm; NEM + ARL + Iono). Extracellular medium was collected after a 5-min exposure of the cells to each of the different experimental conditions. Luminescence is expressed as relative light units (RLU). B, quantification of ATP release under the different experimental conditions is shown. Each bar represents the mean ± S.E. of the results from three experiments. A calibration curve generated with serial dilutions of an ATP standard was used to convert luminescence units into ATP concentration values. **, p < 0.005; ***, p < 0.001 with respect to control; ###, p < 0.001 compared with ARL67156 + ionomycin.
FIGURE 6.
FIGURE 6.
Detection of small transient inward currents (STICs) in N2a cells. A, upper panel, spontaneous STIC (*) recorded in a N2 cell bathed in a standard (2.5 mm Ca2+)-containing extracellular solution (Control) is shown. Lower panel, shown is a local application of BzATP (100 μm for 10 s) from a patch pipette to the same cell that generated STICs (*) during the BzATP-induced inward current and during washout. B, shown are STICs (*) generated by BzATP in a N2a cell bathed in a 0 Ca2+-containing extracellular solution. C, STICs (*) generated by local application of ionomycin (10 μm for 15 s; Iono) in two different N2a cells bathed in an standard extracellular saline in the absence (upper panel) or presence of BBG (5 μm) (lower panel). Below each asterisk the corresponding STIC is shown at an expanded current and time scale. Vh = −70 mV. D, STICs generated by BzATP application did not differ from those recorded under control conditions. The values for the amplitude, rise time (20–80%), and half-decay time were normalized to the mean parameter values of STICs detected in control conditions. Nine STICs in control conditions and 62 STICs after application of BzATP were included in the analysis (n = 6 cells). E, mean frequency of STICs recorded under different experimental conditions is shown. The first four bars to the left represent the mean frequency of STICs recorded in the standard (2 Ca2+; n = 6 cells) or a Ca2+-free (0 Ca2+; n = 5 cells) extracellular solution before (Ctrl) and after BzATP (BzATP) application; the first three bars from the right represent the mean frequency of STICs recorded in standard (2 Ca2+) extracellular solution before (Ctrl) and after ionomycin application in the absence (Iono; n = 6 cells) and presence of BBG (Iono + BBG; n = 5 cells). *, p < 0.05; **, p < 0.001; ***, p < 0.005 with respect to its corresponding control.

Similar articles

Cited by

References

    1. Burnstock G., Kennedy C. (1985) Gen. Pharmacol. 16, 433–440 - PubMed
    1. von Kügelgen I., Wetter A. (2000) Naunyn-Schmiedebergs Arch. Pharmacol. 362, 310–323 - PubMed
    1. Khakh B. S., Burnstock G., Kennedy C., King B. F., North R. A., Séguéla P., Voigt M., Humphrey P. P. (2001) Pharmacol. Rev. 53, 107–118 - PubMed
    1. North R. A. (2002) Physiol. Rev. 82, 1013–1067 - PubMed
    1. Jarvis M. F., Khakh B. S. (2009) Neuropharmacology 56, 208–215 - PubMed

Publication types

MeSH terms