. 2011 Apr;25(4):575-83.
doi: 10.1210/me.2010-0213. Epub 2011 Feb 3.

Thyroid hormone receptor α and regulation of type 3 deiodinase

Affiliations

Thyroid hormone receptor α and regulation of type 3 deiodinase

Olga Barca-Mayo et al. Mol Endocrinol. 2011 Apr.

Abstract

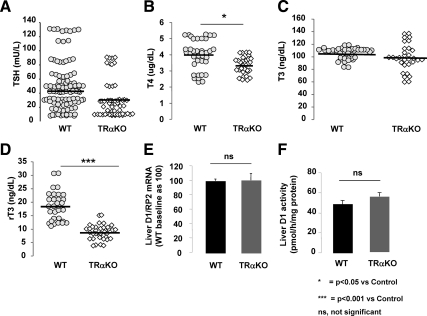
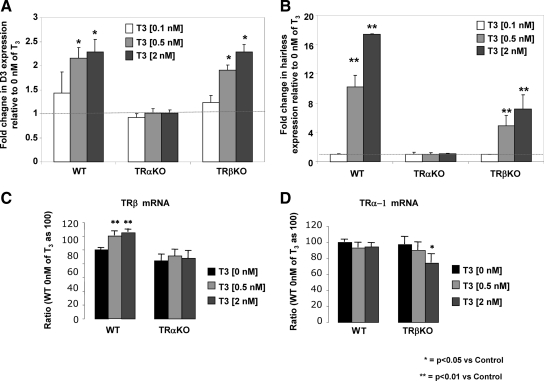
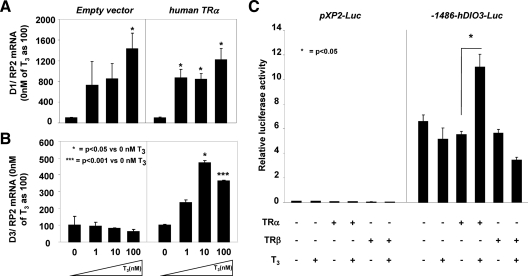
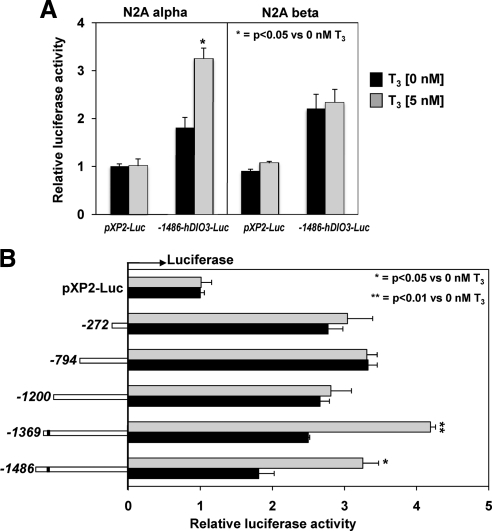
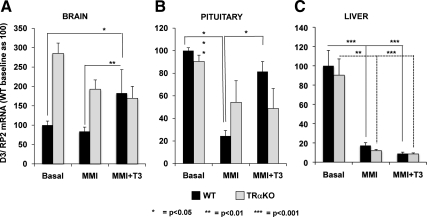
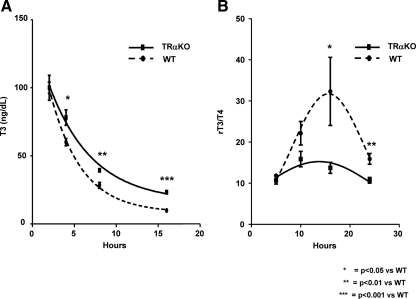
Mice deficient in thyroid hormone receptor α (TRα) display hypersensitivity to thyroid hormone (TH), with normal serum TSH but diminished serum T(4). Our aim was to determine whether altered TH metabolism played a role in this hypersensitivity. TRα knockout (KO) mice have lower levels of rT(3), and lower rT(3)/T(4) ratios compared with wild-type (WT) mice. These alterations could be due to increased type 1 deiodinase (D1) or decreased type 3 deiodinase (D3). No differences in D1 mRNA expression and enzymatic activity were found between WT and TRαKO mice. We observed that T(3) treatment increased D3 mRNA in mouse embryonic fibroblasts obtained from WT or TRβKO mice, but not in those from TRαKO mice. T(3) stimulated the promoter activity of 1.5 kb 5'-flanking region of the human (h) DIO3 promoter in GH3 cells after cotransfection with hTRα but not with hTRβ. Moreover, treatment of GH3 cells with T(3) increased D3 mRNA after overexpression of TRα. The region necessary for the T(3)-TRα stimulation of the hD3 promoter (region -1200 to -1369) was identified by transfection studies in Neuro2A cells that stably overexpress either TRα or TRβ. These results indicate that TRα mediates the up-regulation of D3 by TH in vitro. TRαKO mice display impairment in the regulation of D3 by TH in both brain and pituitary and have reduced clearance rate of TH as a consequence of D3 deregulation. We conclude that the absence of TRα results in decreased clearance of TH by D3 and contributes to the TH hypersensitivity.


Figures

Fig. 1.
Fig. 1.
Serum tests of thyroid function and liver D1 mRNA content and enzymatic activity in TRαKO and WT animals. Serum TSH (A), T4 (B), T3 (C), and rT3 (D) concentrations in TRαKO and WT at baseline. D1 mRNA levels (E) and enzymatic activity (F) in liver of WT (black bars) and TRαKO (gray bars) mice at baseline. Data on D1 are expressed as mean ± sem; n = 7 animals per group. Statistical differences between groups are indicated.
Fig. 2.
Fig. 2.
D3 mRNA levels after T3 treatment of MEFs from TRαKO, TRβKO, and WT mice. Fold change of D3 (A) and hairless (B) mRNA levels in MEFs from the three genotypes after treatment with increasing doses of T3 for 24 h (0.1, 0.5, and 2 nm) in relation to control (MEFs of their respective genotype treated with vehicle). TRβ mRNA levels in MEFs from WT or TRαKO mice (C) and TRα-1 mRNA levels of in MEFs from WT or TRβKO mice (D) after treatment with increasing doses of T3 for 24 h (0.5 and 2 nm) as compared with control (vehicle). The experiment was repeated three times in triplicate. Data are expressed as mean ± sem. Significant differences as compared with control are indicated.
Fig. 3.
Fig. 3.
Overexpression of TRα induces D3 mRNA levels in GH3 cells after T3 treatment. D1 (A) and D3 (B) mRNA levels in pituitary GH3 cells after transfection with the empty pcDNA vector (left panel) or with hTRα plasmid (right panel) and treatment with increasing doses of T3 for 24 h (0, 1, 10, 100 nm). The experiment was repeated twice in triplicate. Data are expressed as mean ± sem. Significant differences between groups are indicated. C, T3-TRα regulation of human DIO3 promoter activity in GH3 cells: −1486 bp of the human DIO3 promoter or pXP2-Luc empty vector and hTRα or TRβ were cotransfected into GH3 cells and analyzed for luciferase activity after T3 treatment as described in Materials and Methods. Bars represent the mean ± sem of three different experiments, each performed in triplicate. Significant differences between groups are indicated.
Fig. 4.
Fig. 4.
T3 response of deletion constructs of the hDIO3 promoter in N2A α and N2A β cells. A, −1486 bp of the hDIO3 promoter-Luc reporter or pXP2-Luc empty vector were transfected into N2A α and N2A β cells and analyzed for luciferase activity after T3 treatment as described in Materials and Methods. Bars represent the mean ± sem of three different experiments, each performed in triplicate. Significant differences between groups are indicated. B, Human DIO3 promoter containing −1486, −1369, −1200, −794, and −272 positions 5′-FR to +72 location at 3′ (just before the native translational start codon) or pXP2-Luc empty vector were transfected into N2A α cells and analyzed for luciferase activity after T3 treatment as described in Materials and Methods. Bars represent the mean ± sem of the three different experiments, each performed in triplicate. Significant differences are indicated. Black bars, T3, 0 nm; shaded bars, T3, 5 nm.
Fig. 5.
Fig. 5.
D3 mRNA levels in brain, pituitary, and liver of TRαKO (gray bars) and WT mice (black bars) after T3 treatment. Mice from the two genotypes were TH-deprived (MMI and potassium perchlorate) and then treated with T3 (MMI and potassium perchlorate + 2 μg of T3/ 100 g BW). D3 mRNA levels in brain (A), pituitary (B), and liver (C) of TRαKO and WT mice at baseline, during hypothyroidism, and after T3 treatment by qPCR. Bars represent the mean ± sem. Significant differences between groups are indicated; n = 7 animals per group.
Fig. 6.
Fig. 6.
Serum T3 concentrations and rT3/T4 ratios after administration of T3 (A) or T4 (B), respectively, in hypothyroid TRαKO and WT mice. A, Serum T3 concentrations at different times after the administration of 2 μg of T3 /100 g BW. Blood was obtained at the indicated times after the last ip dose of T3. T3 serum levels were represented in relation to the first point of the curve (2 h). Data are expressed as mean ± sem. Differences between groups are indicated. B, Serum rT3/T4 ratios at different times after the administration of 10 mg of T4 /100 g BW. Blood was obtained at the indicated times after the last ip dose of T4. Mean values ± sem are depicted. Differences between groups are indicated; n = 7 animals per group.

Similar articles

Cited by

References

    1. Hodin RA, Lazar MA, Chin WW. 1990. Differential and tissue-specific regulation of the multiple rat c-erbA messenger RNA species by thyroid hormone. J Clin Invest 85:101–105 - PMC - PubMed
    1. Chassande O, Fraichard A, Gauthier K, Flamant F, Legrand C, Savatier P, Laudet V, Samarut J. 1997. Identification of transcripts initiated from an internal promoter in the c-erbA α locus that encode inhibitors of retinoic acid receptor-α and triiodothyronine receptor activities. Mol Endocrinol 11:1278–1290 - PubMed
    1. Lazar MA, Hodin RA, Chin WW. 1989. Human carboxyl-terminal variant of α-type c-erbA inhibits trans-activation by thyroid hormone receptors without binding thyroid hormone. Proc Natl Acad Sci USA 86:7771–7774 - PMC - PubMed
    1. Burgos-Trinidad M, Koenig RJ. 1999. Dominant negative activity of thyroid hormone receptor variant α2 and interaction with nuclear corepressors. Mol Cell Endocrinol 149:107–114 - PubMed
    1. Tagami T, Kopp P, Johnson W, Arseven OK, Jameson JL. 1998. The thyroid hormone receptor variant α2 is a weak antagonist because it is deficient in interactions with nuclear receptor corepressors. Endocrinology 139:2535–2544 - PubMed

Publication types