. 2011 Mar;25(3):516-28.
doi: 10.1210/me.2010-0373. Epub 2011 Feb 3.

The IGF pathway regulates ERα through a S6K1-dependent mechanism in breast cancer cells

Affiliations

The IGF pathway regulates ERα through a S6K1-dependent mechanism in breast cancer cells

Marc A Becker et al. Mol Endocrinol. 2011 Mar.

Abstract

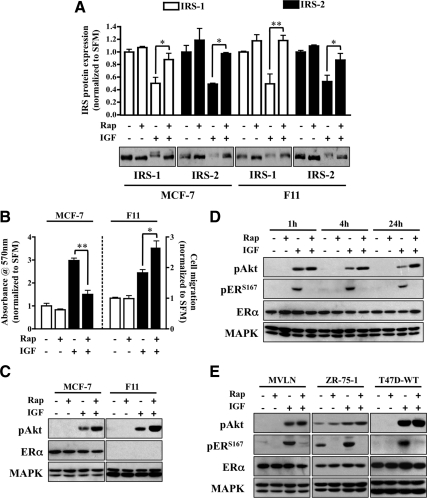
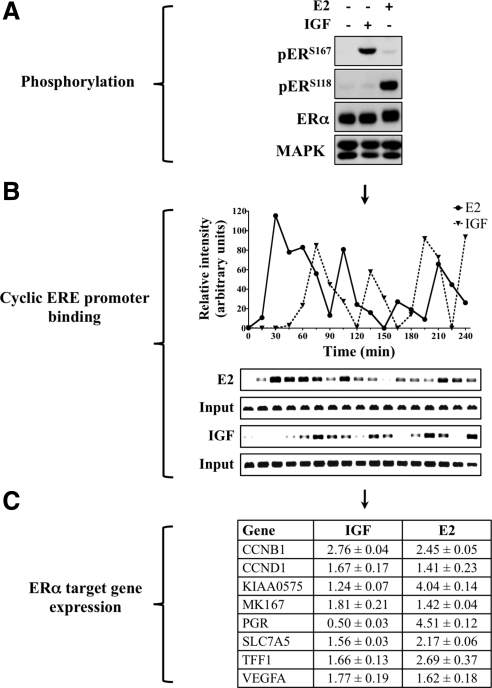
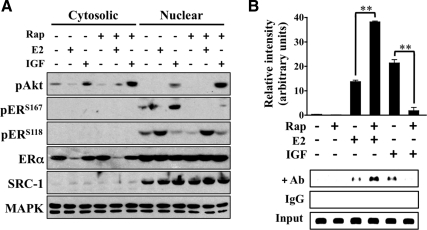
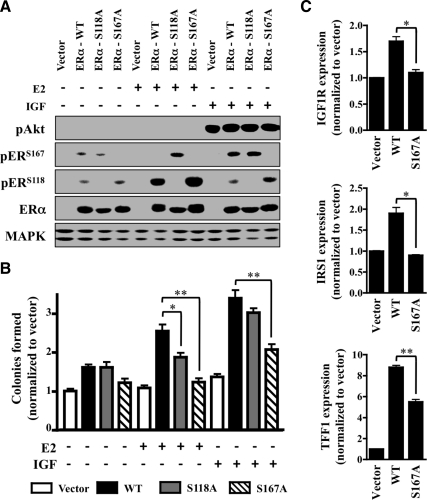
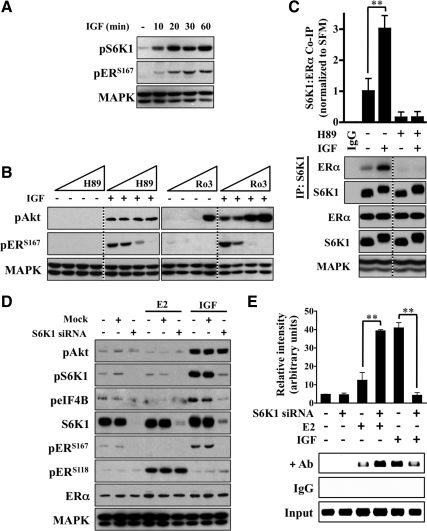
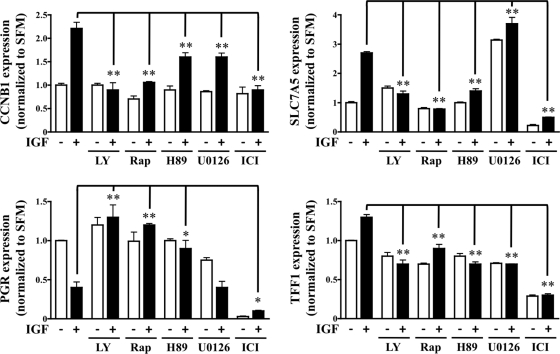
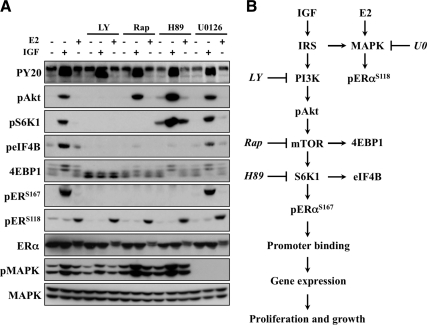
The IGF pathway stimulates malignant behavior of breast cancer cells. Herein we identify the mammalian target of rapamycin (mTOR)/S6 kinase 1 (S6K1) axis as a critical component of IGF and estrogen receptor (ER)α cross talk. The insulin receptor substrate (IRS) adaptor molecules function downstream of IGF-I receptor and dictate a specific biological response, in which IRS-1 drives proliferation and IRS-2 is linked to motility. Although rapamycin-induced mTOR inhibition has been shown to block IGF-induced IRS degradation, we reveal differential effects on motility (up-regulation) and proliferation (down-regulation). Because a positive correlation between IRS-1 and ERα expression is thought to play a central role in the IGF growth response, we investigated the potential role of ERα as a downstream mTOR target. Small molecule inhibition and targeted knockdown of S6K1 blocked the IGF-induced ERα(S167) phosphorylation and did not influence ligand-dependent ERα(S118) phosphorylation. Inhibition of S6K1 kinase activity consequently ablated IGF-stimulated S6K1/ERα association, estrogen response element promoter binding and ERα target gene transcription. Moreover, site-specific ERα(S167) mutation reduced ERα target gene transcription and blocked IGF-induced colony formation. These findings support a novel link between the IGF pathway and ERα, in which the translation factor S6K1 affects transcription of ERα-regulated genes.


Figures

Fig. 1.
Fig. 1.
Rapamycin blocks IGF-induced proliferation and ERα phosphorylation. A, MCF-7 and MDA-231BO (F11) cells were serum starved overnight and pretreated with rapamycin (Rap; 10 nm) for 30 min before IGF stimulation (4 h). Lysates were collected and resolved by SDS-PAGE for immunoblot analysis against the proteins of interest. The graph represents IRS protein levels as fold change of treated vs. nontreated control. B, Monolayer proliferation was measured by MTT assay in MCF-7 cells (left axis), and motility was determined by transwell Boyden chamber in F11 cells (right axis) in response to rapamycin and IGF treatment. The graph is presented as fold change response vs. nontreated control. C, After rapamycin pretreatment, MCF-7 (left panel) and F11 (right panel) cells were exposed to IGF (1 h) and immunoblot analysis performed. D, MCF-7 cells were serum starved overnight, pretreated with rapamycin for 30 min, and treated with IGF for the indicated time points. Lysates were resolved by SDS-PAGE and immunoblotted against the proteins of interest. E, Western blot analysis of MVLN, ZR-75-1, and T47D cells exposed to IGF (1 h) was performed after 30 min of rapamycin pretreatment. Error bars represent sd on all graphs. The MAPK (anti-MAPK) served as a loading control for immunoblot experiments, and all results are representative of at least three independent replicates.
Fig. 2.
Fig. 2.
IGF evokes an estrogen-like response. A, MCF-7 cells were cultured in estrogen-depleted conditions for 3 d, serum starved overnight, treated with IGF or E2 (1 h), and immunoblot analysis performed. B, ChIP was performed after IGF or E2 exposure. Protein/chromatin complexes were collected every 15 min, ERα-bound DNA fragments isolated, and the pS2 ERE amplified by PCR. The graph is a measure of relative intensity. C, After 24 h of IGF or E2 exposure, mRNA was isolated and RT-qPCR performed. Target gene expression was normalized to RPLP0 gene expression and is presented as fold change of treatment vs. serum-free conditions with sd included. All results are representative of at least three independent replicates.
Fig. 3.
Fig. 3.
Rapamycin inhibits nuclear ERα activity. A, MCF-7 cells were cultured in the absence of hormone for 3 d, serum starved overnight, and pretreated with rapamycin (Rap) for 30 min before IGF or E2 (1 h) exposure. Nuclear and cytosolic extracts were isolated by fractionation, resolved by SDS-PAGE, and immunoblotted against the indicated proteins. Steroid receptor coactivator (SRC)-1 (anti-SRC-1) and MAPK (anti-MAPK) were used as nuclear and total lysate loading controls. B, ChIP was performed on cells pretreated with rapamycin for 30 min before IGF or E2 treatment (4 h). For ChIP assays, IgG and input lanes were included for each sample to control for nonspecificity and ensure equal DNA loading. The graph is a measure of relative intensity in which black bars indicate IGF treatment and error bars represent sd. All results are representative of at least three independent replicates.
Fig. 4.
Fig. 4.
ERαS167 mediates IGF-induced phosphorylation, transcription, and growth. A, ERα-negative C4-12 cells were transiently transfected (48 h) with empty vector (Vector), ERα-WT, point-mutated ERαS118A (S118A), or ERαS167A (S167A) and serum starved overnight. Cells were then exposed to IGF or E2 (1 h) and immunoblotted against the proteins of interest. ERα (anti-ERα) was used to ensure equal transfection rates, and MAPK (anti-MAPK) served as a loading control. B, C4-12 cells were transfected with empty vector (Vector), ERα-WT or a mutant form of ERα (ERα-S118A or ERα-S167A), and anchorage-independent growth in response to IGF or E2 was assessed by soft agar assay. Colony-forming ability was expressed as fold change over vector-transfected cells. C, IGF1R, IRS1, and TFF1 gene expression of C4-12 cells transfected with empty vector, ERα-WT, or ERα-S167A was measured by RT-qPCR. Target gene expression was normalized to RPLP0 gene expression and presented as fold change over vector-transfected control. All error bars depict sd and all results are representative of at least three independent replicates.
Fig. 5.
Fig. 5.
IGF regulates ERα through S6K1. A, MCF-7 cells were exposed to IGF for the indicated time points and Western blot analysis performed. B, Beginning at 1 nm, cells were exposed to logarithmic dose increases of H89 or Ro31-8220 for 30 min before IGF exposure (1 h) and immunoblot analysis performed. C, Cells were pretreated with H89 for 30 min before IGF (4 h), and the association between S6K1 and ERα was measured by coimmunoprecipitation analysis. The graph represents the amount of immunoprecipitated ERα in IGF treated relative to nontreated. A nonspecific IgG control and total S6K1 and ERα levels are presented as loading controls. D, Cells were transiently transfected with either mock control or S6K1-targeting siRNA, treated with IGF or E2(1 h), and assessed for knockdown efficiency by immunoblot analysis. E, ChIP of the pS2 ERE was performed after S6K1 knockdown and exposure to IGF and E2 (4 h). The graph is a measure of relative intensity, and error bars represent sd. The MAPK (anti-MAPK) served as a loading control for immunoblot experiments, and all results are representative of at least three independent replicates.
Fig. 6.
Fig. 6.
S6K1 axis facilitates IGF/ERα cross talk through target gene transcription. MCF-7 cells were pretreated with LY294002 (LY; 10 μm), rapamycin (Rap; 10 nm), H89 (10 μm), U0126 (10 μm), or ICI 182780 (ICI; 1 μm) for 30 min before IGF (black bars) exposure. After 24 h of IGF exposure, mRNA was isolated and RT-qPCR performed. Target gene expression was normalized to RPLP0 gene expression and is presented as fold change of treatment vs. serum-free conditions. Error bars represent sd, and all results are representative of at least three independent replicates.
Fig. 7.
Fig. 7.
IGF phosphorylates ERα via the mTOR/S6K1 axis. A, MCF-7 cells were cultured under hormone-free conditions for 3 d before overnight serum starvation. Cells were pretreated with LY294002 (LY; 10 μm), rapamycin (Rap; 10 nm), H89 (10 μm), or U0126 (10 μm) for 30 min before IGF or E2 (1 h) exposure and subjected to immunoblot analysis. MAPK (anti-MAPK) served as a loading control for all experiments, and results are representative of at least three independent replicates. B, Model of proposed pathway.

Similar articles

Cited by

References

    1. Kiang DT, Frenning DH, Goldman AI, Ascensao VF, Kennedy BJ. 1978. Estrogen receptors and responses to chemotherapy and hormonal therapy in advanced breast cancer. N Engl J Med 299:1330–1334 - PubMed
    1. Ward HW. 1973. Anti-oestrogen therapy for breast cancer: a trial of tamoxifen at two dose levels. Br Med J 1:13–14 - PMC - PubMed
    1. Knight WA, Livingston RB, Gregory EJ, McGuire WL. 1977. Estrogen receptor as an independent prognostic factor for early recurrence in breast cancer. Cancer Res 37:4669–4671 - PubMed
    1. Mohamood AS, Gyles P, Balan KV, Hollis VW, Eckberg WR, Asseffa A, Han Z, Wyche JH, Anderson WA. 1997. Estrogen receptor, growth factor receptor and protooncogene protein activities and possible signal transduction cross talk in estrogen dependent and independent breast cancer cell lines. J Submicrosc Cytol Pathol 29:1–17 - PubMed
    1. Arpino G, Wiechmann L, Osborne CK, Schiff R. 2008. Cross talk between the estrogen receptor and the HER tyrosine kinase receptor family: molecular mechanism and clinical implications for endocrine therapy resistance. Endocr Rev 29:217–233 - PMC - PubMed

Publication types

MeSH terms

Substances