. 2011 Feb;121(2):769-83.
doi: 10.1172/JCI45096.

α3(V) collagen is critical for glucose homeostasis in mice due to effects in pancreatic islets and peripheral tissues

Affiliations

α3(V) collagen is critical for glucose homeostasis in mice due to effects in pancreatic islets and peripheral tissues

Guorui Huang et al. J Clin Invest. 2011 Feb.

Abstract

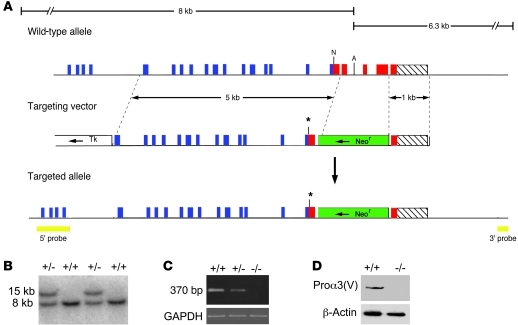
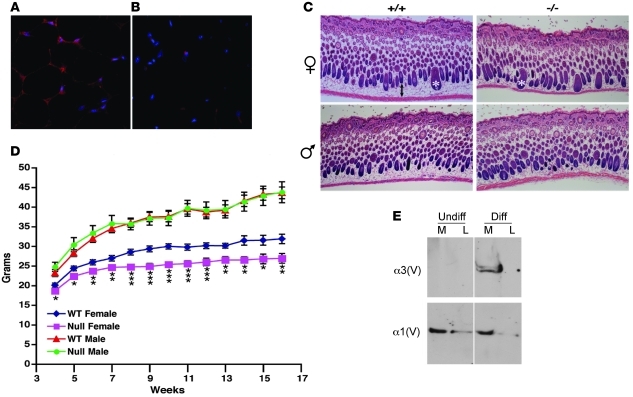
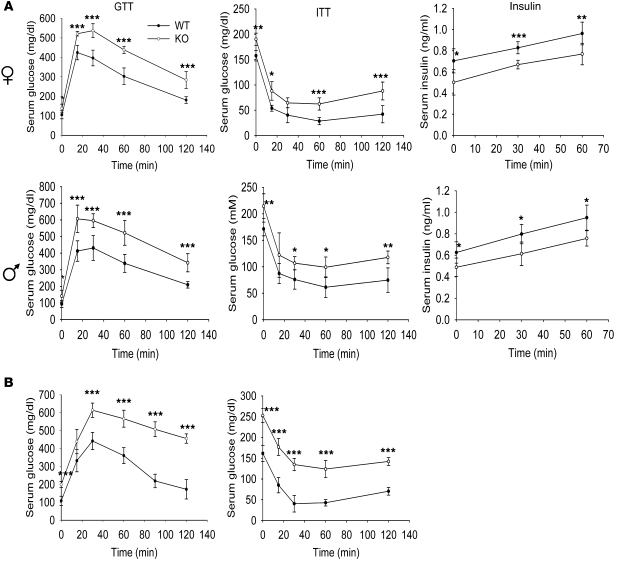
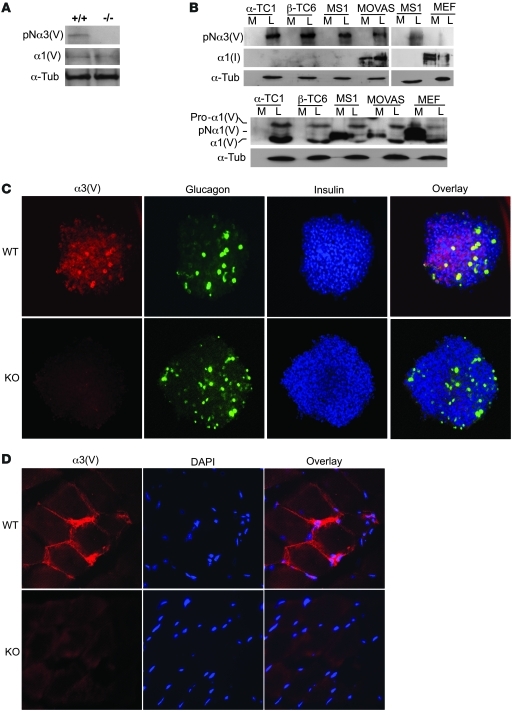
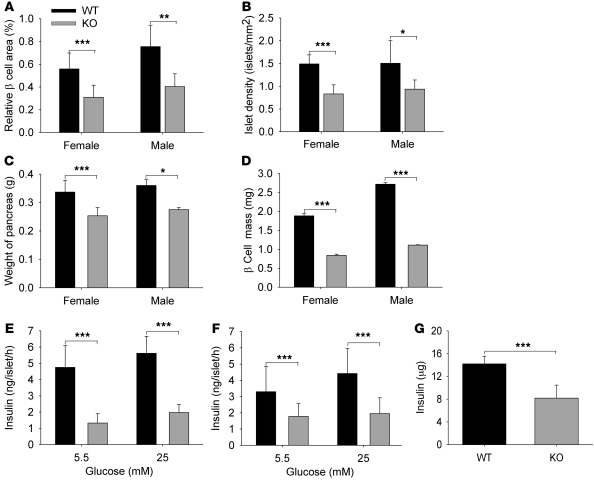
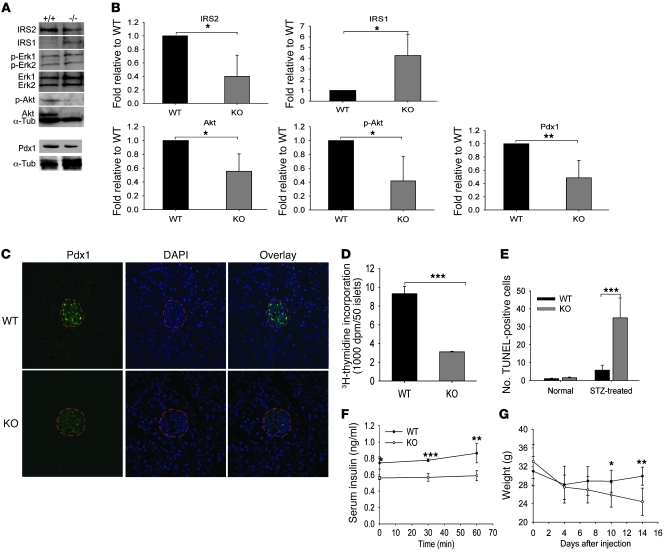
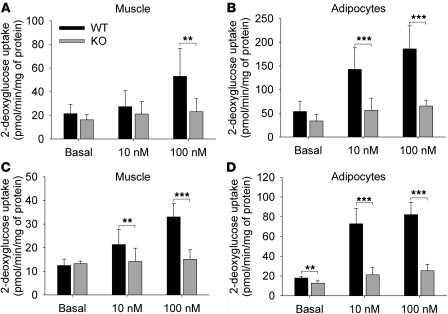
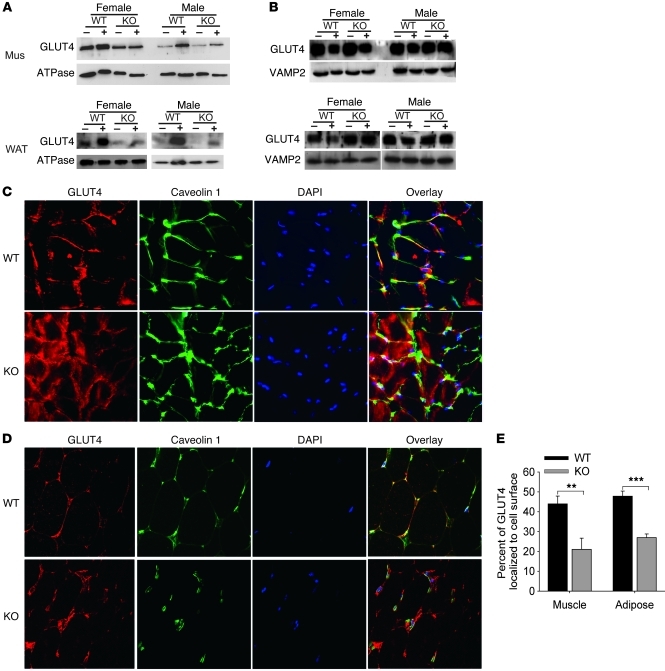
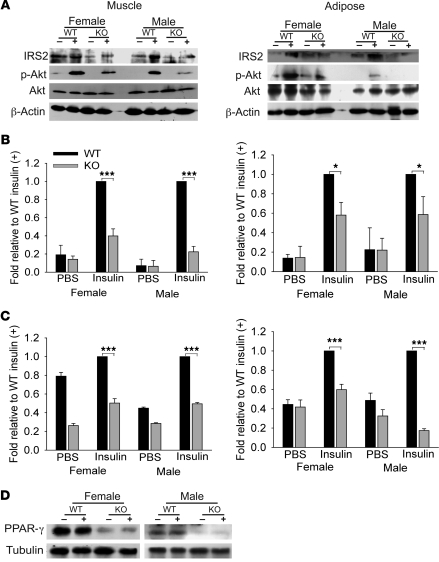
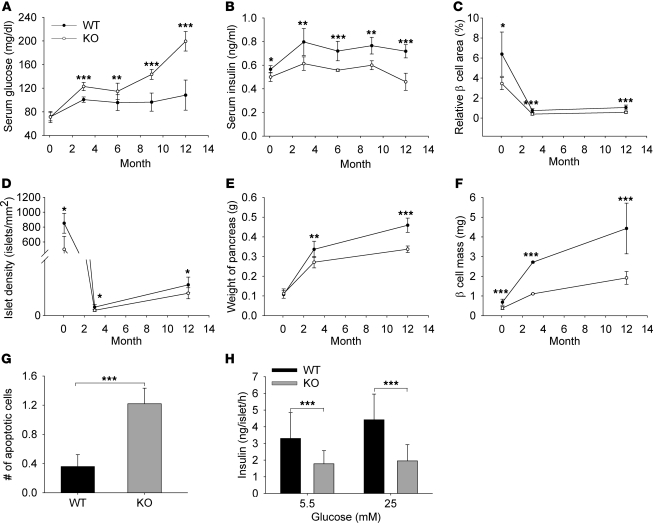
Collagen V, broadly expressed as α1(V)2 α2(V) heterotrimers that regulate collagen fibril geometry and strength, also occurs in some tissues, such as white adipose tissue (WAT), pancreatic islets, and skeletal muscle, as the poorly characterized α1(V) α2(V) α3(V) heterotrimer. Here, we investigate the role of α3(V) collagen chains by generating mice with a null allele of the α3(V) gene Col5a3 (Col5a3–/– mice). Female Col5a3–/– mice had reduced dermal fat and were resistant to high-fat diet–induced weight gain. Male and female mutant mice were glucose intolerant, insulin-resistant, and hyperglycemic, and these metabolic defects worsened with age. Col5a3–/– mice demonstrated decreased numbers of pancreatic islets, which were more susceptible to streptozotocin-induced apoptosis, and islets isolated from mutant mice displayed blunted glucose-stimulated insulin secretion. Moreover, Col5a3–/– WAT and skeletal muscle were defective in glucose uptake and mobilization of intracellular GLUT4 glucose transporter to the plasma membrane in response to insulin. Our results underscore the emerging view of the importance of ECM to the microenvironments that inform proper development/functioning of specialized cells, such as adipocytes, β cells, and skeletal muscle.


Figures

Figure 1
Figure 1. Targeted disruption of Col5a3.
(A) Structure of the targeting vector and Col5a3 locus, before and after homologous recombination. Horizontal arrows mark directions of transcription of neor and tk cassettes. Blue, red, and hatched boxes represent COL1, C-propeptide, and 3′-UTR exons, respectively. The green boxes represent the Neor cassette; the yellow boxes represent 5′ and 3′ external probes. The asterisks mark the site of a premature stop codon engineered via blunt-end ligation of a NarI site. A, AflII; N, NarI. (B) Southern blot of AflII-restricted genomic DNA from wild-type and correctly targeted ES cell clones hybridized to the 5′ probe. (C) RT-PCR analysis of total RNA from 15.5-dpc embryos detected a 370-bp amplimer corresponding to wild-type Col5a3 RNA in wild-type (+/+) samples that was diminished in Col5a3+/– (+/–) samples and absent in Col5a3–/– (–/–) samples. Amplification of a GAPDH product was a loading control. (D) Immunoblotting of 15.5-dpc embryo homogenates detects pro-α3(V) chains in wild-type but not Col5a3–/– samples. Reprobing with anti–β-actin antibody controlled for protein loading.
Figure 2
Figure 2. WAT α3(V) expression and effects of Col5a3 ablation.
α3(V) chains are detectable in (A) wild-type but not (B) Col5a3–/– inguinal fat pads stained with DAPI (blue) and anti-α3(V) antibodies (red). Red spots in Col5a3–/– tissue are nonspecific secondary antibody deposits, also observed in controls performed without primary antibody (data not shown). (C) H&E-stained dorsal skin sections from 10-day-old mice show significantly reduced (P < 0.00005) thickness of the adipocyte-rich hypodermal layer of Col5a3–/– females (36.6 ± 6 μm, n = 6) compared with that of wild-type females (88.2 ± 11.5 μm, n = 5), with a trend toward reduced thickness of the hypodermal layer of Col5a3–/– males (41.8 ± 5.9 μm, n = 10) compared with that of wild-type males (51.1 ± 13.9 μm, n = 5) that did not achieve significance (P < 0.11). Thicknesses are in mean ± SD. A 2-headed arrow denotes the hypodermal layer of wild-type female skin. Asterisks mark 2 hair follicles. Original magnification, ×5 (A and B); ×40 (C). (D) Three-week-old wild-type (males, n = 15; females, n = 13) or Col5a3–/– (males and females each, n = 10) mice were maintained for 13 weeks on a high-fat diet and weighed each week. Average weights/week are in grams. Data are presented as mean ± SEM. *P < 0.05; **P < 0.01; ***P < 0.001. (E) Immunoblots are of cell layer (L) or media (M) samples from cells before (Undiff) or after (Diff) induced adipocytic differentiation. Blots were probed with anti-α3(V) or anti-α1(V) antibodies. For each blot, the thin vertical line indicates where data were spliced together from noncontiguous lanes. In each case, lanes were from the same blot, and thus represent samples run on the same gel, at the same time.
Figure 3
Figure 3. Col5a3–/– mice have impaired glucose tolerance and insulin sensitivity and are hypoinsulinemic.
(A) Serum glucose levels are shown in mg/dl for 3-month-old female and male wild-type and Col5a3–/– (KO) mice (n = 6 for each combination of gender and genotype) after glucose administration for glucose tolerance tests (GTTs) or after insulin administration for insulin tolerance tests (ITTs). Areas under glucose tolerance test glucose curves for wild-type and Col5a3–/– females were 22,428 and 34,074 mg/dl per 120 minutes, respectively, demonstrating a significant (P < 0.001) 1.52-fold difference. Areas under the glucose tolerance test glucose curves for wild-type and Col5a3–/– males were 25,884 and 36,882 mg/dl per 120 minutes, respectively, demonstrating a significant (P < 0.002) 1.42-fold difference. Plasma insulin levels (insulin) were measured for aliquots of glucose tolerance test samples from 0, 30, and 60 minutes time points. (B) Glucose tolerance test and insulin tolerance test glucose levels are shown in mg/dl for 1-year-old wild-type (n = 12) and Col5a3–/– (n = 10) mice (genders were not tested separately for these assays). Areas under glucose tolerance test glucose curves for wild-type and Col5a3–/– mice were 19,926 and 38,772 mg/dl per 120 minutes, respectively, demonstrating a significant (P < 0.0002) 1.95-fold difference. Data are presented as mean ± SEM. *P < 0.05; **P < 0.01; ***P < 0.001.
Figure 4
Figure 4. Immortalized islet cell types produce and pancreatic islets and skeletal muscle contain α3(V) chains.
Immunoblots of (A) isolated pancreatic islet extracts or of (B) media and cell layer extracts of various cell lines were stained with anti-α3(V) or anti-α1(V) antibodies or with anti–α-tubulin (α-Tub) antibody, as a loading control. (C) Immunofluorescent staining with anti-α3(V), anti-glucagon, and anti-insulin antibodies is shown for isolated and fixed islets. Overlay panels show areas of colocalization for α3(V) and glucagon (yellow) or for α3(V) and insulin (purple). (D) Immunofluorescent staining shows that skeletal muscle counterstained with DAPI contains readily detectable α3(V) chains. Col5a3–/– muscle and islets did not exhibit α3(V) staining, demonstrating specificity of the signal and the null nature of the targeted Col5a3 allele. Original magnification, ×20 (C); ×40 (D).
Figure 5
Figure 5. Col5a3–/– mice have reduced β cell relative area, numbers of pancreatic islets, β cell mass, and β cell function.
Eight- to twelve-week-old Col5a3–/– mice had highly significant decreases (A) in β cell area relative to total pancreas area, (B) in absolute numbers of pancreatic islets (islet density), (C) in pancreas weight, and, consequently, (D) in β cell mass (fractional cross-sectional area of β cells × pancreas weight) (n = 6–8 mice, per combination of gender and genotype). Islets isolated from (E) female or (F) male Col5a3–/– and wild-type pancreases (7–8 mice for each combination of genotype and gender) were incubated in the presence of 5.5 or 25 mM glucose, followed by ELISA quantification of insulin secretion. Eighteen islets were assayed per mouse (3 islets per tube, 3 tubes per each concentration of glucose, so that each assay was performed in triplicate). (G) ELISA was also used to quantify whole pancreas insulin content. Data are presented as mean ± SEM. *P < 0.05; **P < 0.01; ***P < 0.001.
Figure 6
Figure 6. Aberrations in Col5a3–/– islet insulin/IGF-1 signaling pathway components and Pdx1 levels, and increased susceptibility to STZ.
(A) Representative immunoblots are shown of extracts of isolated islets stained with IRS2, IRS1, phospho-Erk1/Erk2 (p-Erk1, p-Erk2), Erk1/Erk2, phospho-Akt (p-Akt), Pdx1, and α-tubulin antibodies. The latter was a loading control. All blots are from the same SDS-PAGE gel, with the exception of the blot for Pdx1 and an associated α-tubulin control. (B) Immunoblots for IRS2, IRS1, phospho-Akt, Akt, and Pdx1 were repeated 3 times, from 3 independent preps of isolated islets (from different mice). Films were scanned, and results were quantified using NIH ImageJ software. In each histogram, results are normalized to wild-type values, and Col5a3–/– values are given ± SEM. (C) Immunofluorescent staining for Pdx1 in pancreas sections from 12-week-old wild-type and Col5a3–/– mice. Sections were counterstained with DAPI, and islets are outlined in red. Original magnification, ×10. (D) A comparison is shown of 3H-thymidine incorporation in response to serum-induced proliferation in wild-type and Col5a3–/– islets. (E) An approximately 7-fold increase in apoptosis was observed in islets of Col5a3–/– pancreases compared with that in wild-type pancreases from STZ-treated mice. Numbers are of TUNEL-positive cells/mm2 of total insulin-positive area in pancreas sections. Differences are shown in (F) plasma insulin levels and (G) body weight between STZ-treated Col5a3–/– and wild-type mice. Data are presented as mean ± SEM. *P < 0.05; **P < 0.01; ***P < 0.001.
Figure 7
Figure 7. Deficient insulin-stimulated glucose uptake in Col5a3–/– skeletal muscle and adipocytes.
(A and C) Strips of soleus muscle and (B and D) adipocytes isolated from epididymal fat pads were incubated in the absence (basal) or presence of 10 or 100 nM insulin, prior to incubation in the presence of 2-deoxy-D-[2,6-3H]glucose and 1 mM 2-deoxyglucose and subsequent ascertainment of uptake. Tissues were from (A and B) 10- to 12-week-old or (C and D) 1-year-old mice. Muscle and adipocyte assays were repeated 8 and 7 times, respectively, in each case, using samples from different mice. Uptake values are shown ± SEM. **P < 0.01; ***P < 0.001.
Figure 8
Figure 8. Immunoblot and immunofluorescence analysis of insulin-stimulated GLUT4 translocation to plasma membranes in skeletal muscle and WAT.
Immunoblots are shown of (A) plasma membrane proteins or (B) intracellular membrane proteins isolated from skeletal muscle (mus) or WAT of wild-type or Col5a3–/– mice that had been injected with either PBS (–) or insulin (+). Staining with antibodies to (A) Na+/K+ ATPase or (B) VAMP2 was performed to provide loading controls and plasma membrane–specific and intracellular membrane–specific protein markers, respectively. These experiments were repeated twice, with reproducible results. Frozen sections of (C) soleus muscle or (D) epididymal fat pads from wild-type or Col5a3–/– mice were stained with antibody to GLUT4 and plasma membrane marker caveolin 1. Sections were counterstained with DAPI. Overlay panels show areas of colocalization (yellow) for GLUT4 and caveolin 1. Original magnification, ×40 (C); ×20 (D). (E) Immunofluorescent results from C and D were quantitated, as described in Methods, to show the percentage of GLUT4 in tissues colocalized at cell surfaces with caveolin 1. Data are presented as mean ± SEM. **P < 0.01; ***P < 0.001.
Figure 9
Figure 9. Aberrations in insulin/IGF-1 signaling components and PPAR-γ levels in Col5a3–/– peripheral tissues.
(A) Representative immunoblots are shown of soleus muscle and epididymal fat pad extracts from wild-type and Col5a3–/– mice that had been injected with PBS (–) or insulin (+). Blots were stained with antibodies to IRS2, Akt, or phospho-Akt (Ser 473). Blots were also stained with anti–β-actin as a loading control. (B and C) Immunoblots were repeated 3 times, from 3 independent tissue preps (from different mice). Films were scanned, and results were quantified for (B) phospho-Akt and (C) IRS2, using NIH ImageJ software. In each histogram, results are normalized for values of insulin-treated wild-type mice, and Col5a3–/– values are given ± SEM. *P < 0.05; ***P < 0.001. (D) An immunoblot shows markedly decreased PPAR-γ levels in adipose of Col5a3–/– mice injected with PBS (–) or insulin (+).
Figure 10
Figure 10. Effects of increasing age on the Col5a3–/– phenotype.
(A) Fasting glucose and (B) insulin levels were determined for 2-day-old and for 3-, 6-, 9-, and 12-month-old Col5a3–/– and wild-type mice. (C) Relative β cell area, (D) numbers of islets (islet density), (E) weight of pancreas, and (F) β cell mass are compared between Col5a3–/– and wild-type mice at 2 days, 3 months, and 1 year of age. (G) Numbers of lysotracker-positive (apoptotic) cells per islet and (H) levels of insulin secreted by isolated islets in response to 5.5 or 25 mM glucose are compared for 1-year-old Col5a3–/– and wild-type mice. Data are presented as mean ± SEM. *P < 0.05; **P < 0.01; ***P < 0.001.

Similar articles

Cited by

References

    1. Fichard A, Kleman JP, Ruggiero F. Another look at collagen V and XI molecules. Matrix Biol. 1995;14(7):515–531. doi: 10.1016/S0945-053X(05)80001-0. - DOI - PubMed
    1. Birk DE, Fitch JM, Babiarz JP, Doane KJ, Linsenmayer TF. Collagen fibrillogenesis in vitro: interaction of types I and V collagen regulates fibril diameter. J Cell Sci. 1990;95(pt 4):649–657. - PubMed
    1. Toriello HV, et al. A translocation interrupts the COL5A1 gene in a patient with Ehlers-Danlos syndrome and hypomelanosis of Ito. Nat Genet. 1996;13(3):361–365. - PubMed
    1. Richards AJ, Martin S, Nicholls AC, Harrison JB, Pope FM, Burrows NP. A single base mutation in COL5A2 causes Ehlers-Danlos syndrome type II. . J Med Genet. 1998;35(10):846–848. doi: 10.1136/jmg.35.10.846. - DOI - PMC - PubMed
    1. Abedin MZ, Ayad S, Weiss JB. Isolation and native characterization of cysteine-rich collagens from bovine placental tissues and uterus and their relationship to types IV and V collagens. Biosci Rep. 1982;2(7):493–502. doi: 10.1007/BF01115247. - DOI - PubMed

Publication types