

First-line antiretroviral therapy after single-dose nevirapine exposure in South Africa: a cost-effectiveness analysis of the OCTANE trial
- PMID: 21293199
- PMCID: PMC3068908
- DOI: 10.1097/QAD.0b013e3283428cbe
First-line antiretroviral therapy after single-dose nevirapine exposure in South Africa: a cost-effectiveness analysis of the OCTANE trial
Abstract
Background: The OCTANE trial reports superior outcomes of lopinavir/ritonavir vs. nevirapine-based antiretroviral therapy (ART) among women previously exposed to single-dose nevirapine to prevent mother-to-child HIV transmission. However, lopinavir/ritonavir is 12 times costlier than nevirapine.
Methods: We used a computer model, with OCTANE and local data, to simulate HIV-infected, single-dose nevirapine-exposed women in South Africa. Outcomes of three alternative ART sequences were projected: no ART (for comparison), first-line nevirapine, and first-line lopinavir/ritonavir. OCTANE data included mean age (31 years) and CD4 cell count (135/μl); median time since single-dose nevirapine (17 months); and 24-week viral suppression efficacy for first-line ART (nevirapine: 85%, lopinavir/ritonavir: 97%). Outcomes included life expectancy, per-person costs (2008 US$), and incremental cost-effectiveness ratios.
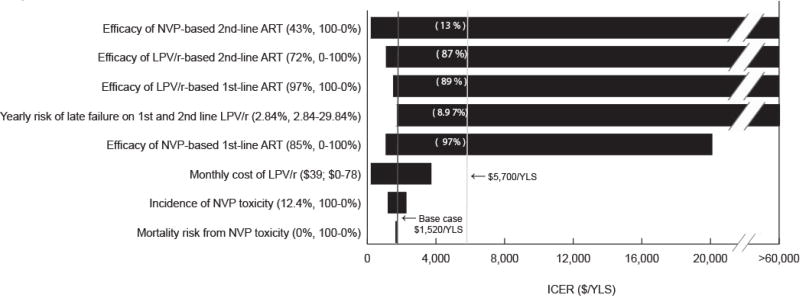
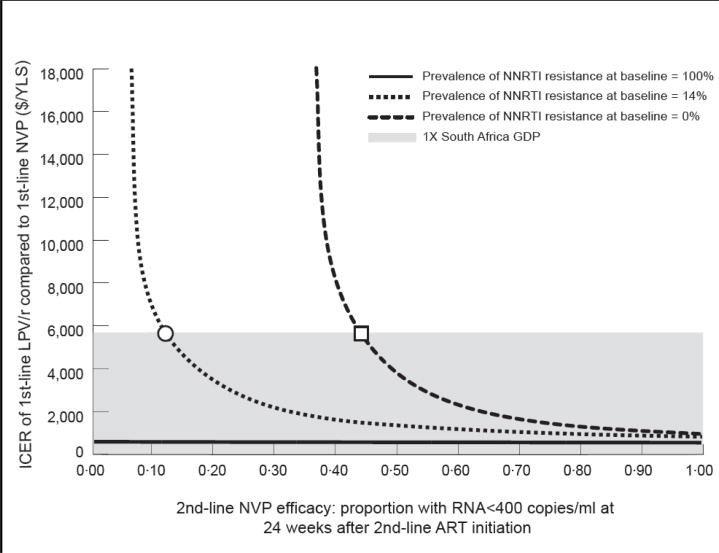
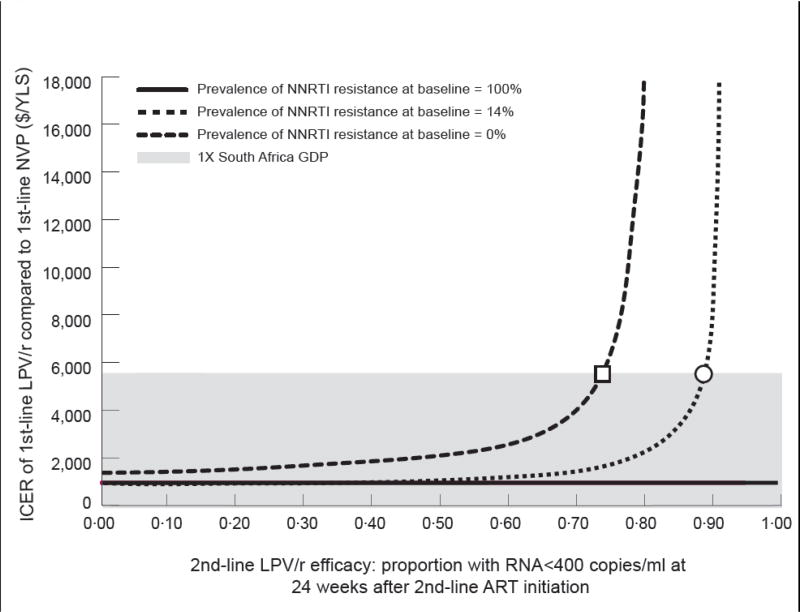
Results: With no ART, projected life expectancy was 1.6 years and per-person cost was $2980. First-line nevirapine increased life expectancy (15.2 years) and cost ($13 990; cost-effectiveness ratio: $810/year of life saved versus no ART). First-line lopinavir/ritonavir further increased life expectancy to 16.3 years and cost to $15 630 (cost-effectiveness ratio: $1520/year of life saved versus first-line nevirapine). First-line lopinavir/ritonavir cost-effectiveness was sensitive to prevalence of nevirapine-resistant virus at ART initiation, time from single-dose nevirapine exposure to ART initiation (6-12, 12-24, or >24 months), second-line ART efficacies, and outcomes after 24 weeks on ART.
Conclusions: First-line lopinavir/ritonavir-based ART is very cost-effective in single-dose nevirapine-exposed, South African women similar to OCTANE participants. Lopinavir/ritonavir should be initiated in women with known nevirapine resistance or single-dose nevirapine exposure less than 12 months prior, or in whom such information is unknown.
Conflict of interest statement
Conflicts of interest: Michael Hughes is a paid member of Data and Safety Monitoring Boards for the following manufacturers of antiretroviral therapy: Boehringer Ingelheim, Pfizer, Tibotec. James McIntyre has received speaker’s honoraria from Abbott Pharmaceuticals, and research funding, travel grants and speaker’s honoraria from Boehringer Ingelheim and Glaxo SmithKline. All other authors have no conflicts of interest to disclose.
Figures
References
-
- Guay LA, Musoke P, Fleming T, et al. Intrapartum and neonatal single-dose nevirapine compared with zidovudine for prevention of mother-to-child transmission of HIV-1 in Kampala, Uganda: HIVNET 012 randomised trial. Lancet. 1999;354:795–802. - PubMed
-
- World Health Organization. Towards universal access: Scaling up priority HIV/AIDS interventions in the health sector. Progress Report. 2009. [Accessed July 1, 2010]. http://www.who.int/hiv/pub/tuapr_2009_en.pdf.
-
- South Africa National Department of Health. Clinical Guidelines: PMTCT (Prevention of Mother-to-Child Transmission) 2010. [Accessed October 27, 2010]. http://www.doh.gov.za/docs/factsheets/guidelines/pmtct.pdf.
-
- World Health Organization. Towards universal access: Scaling up priority HIV/AIDS interventions in the health sector. Progress Report. 2010. [Accessed October 27, 2010]. http://www.who.int/hiv/pub/2010progressreport/report/en/index.html.
-
- Lockman S, Shapiro RL, Smeaton LM, et al. Response to antiretroviral therapy after a single, peripartum dose of nevirapine. N Engl J Med. 2007;356:135–47. - PubMed
Publication types
MeSH terms
Substances
Grants and funding
- UM1 AI069424/AI/NIAID NIH HHS/United States
- UM1 AI068632/AI/NIAID NIH HHS/United States
- K24 AI056933/AI/NIAID NIH HHS/United States
- U19 AI53217/AI/NIAID NIH HHS/United States
- UM1 AI069453/AI/NIAID NIH HHS/United States
- U01 AI069518/AI/NIAID NIH HHS/United States
- R01 AI 69453/AI/NIAID NIH HHS/United States
- K01 AI078754/AI/NIAID NIH HHS/United States
- R01 AI058736/AI/NIAID NIH HHS/United States
- P30 AI060354/AI/NIAID NIH HHS/United States
- U01 AI069436/AI/NIAID NIH HHS/United States
- UM1 AI069501/AI/NIAID NIH HHS/United States
- U01 AI68634/AI/NIAID NIH HHS/United States
- AI-069501/AI/NIAID NIH HHS/United States
- 5U01AI069455-03/AI/NIAID NIH HHS/United States
- U01 AI069453/AI/NIAID NIH HHS/United States
- U01AI069436/AI/NIAID NIH HHS/United States
- 5 U01 AI069518/AI/NIAID NIH HHS/United States
- U01 AI069463/AI/NIAID NIH HHS/United States
- P30 AI 60354/AI/NIAID NIH HHS/United States
- R01 HD044391/HD/NICHD NIH HHS/United States
- UM1 AI068634/AI/NIAID NIH HHS/United States
- U01 AI069501/AI/NIAID NIH HHS/United States
- 3U01AI32775-13S5/AI/NIAID NIH HHS/United States
- UM1 AI069518/AI/NIAID NIH HHS/United States
- K24 AI56933/AI/NIAID NIH HHS/United States
- K24 AI062476/AI/NIAID NIH HHS/United States
- U19 AI053217/AI/NIAID NIH HHS/United States
- U01 AI032775/AI/NIAID NIH HHS/United States
- U01 AI068636/AI/NIAID NIH HHS/United States
- U01 AI69463-03/AI/NIAID NIH HHS/United States
- 5U01AI069456-03/AI/NIAID NIH HHS/United States
- U01 AI069455/AI/NIAID NIH HHS/United States
- U01 AI069424/AI/NIAID NIH HHS/United States
- AI69453/AI/NIAID NIH HHS/United States
- U01 AI069456/AI/NIAID NIH HHS/United States
- U01 AI068634/AI/NIAID NIH HHS/United States
- UM1 AI068636/AI/NIAID NIH HHS/United States
LinkOut - more resources
Full Text Sources
Medical
Research Materials
