

Assaying stem cell mechanobiology on microfabricated elastomeric substrates with geometrically modulated rigidity
- PMID: 21293460
- PMCID: PMC7183577
- DOI: 10.1038/nprot.2010.189
Assaying stem cell mechanobiology on microfabricated elastomeric substrates with geometrically modulated rigidity
Abstract
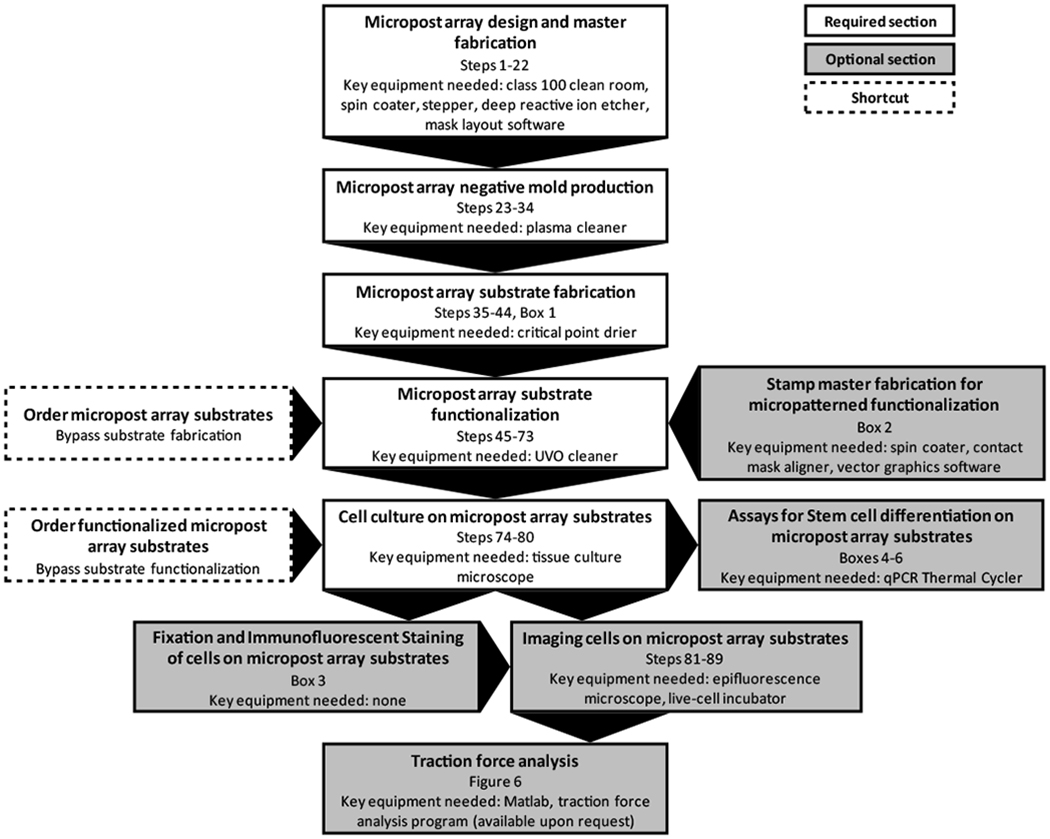
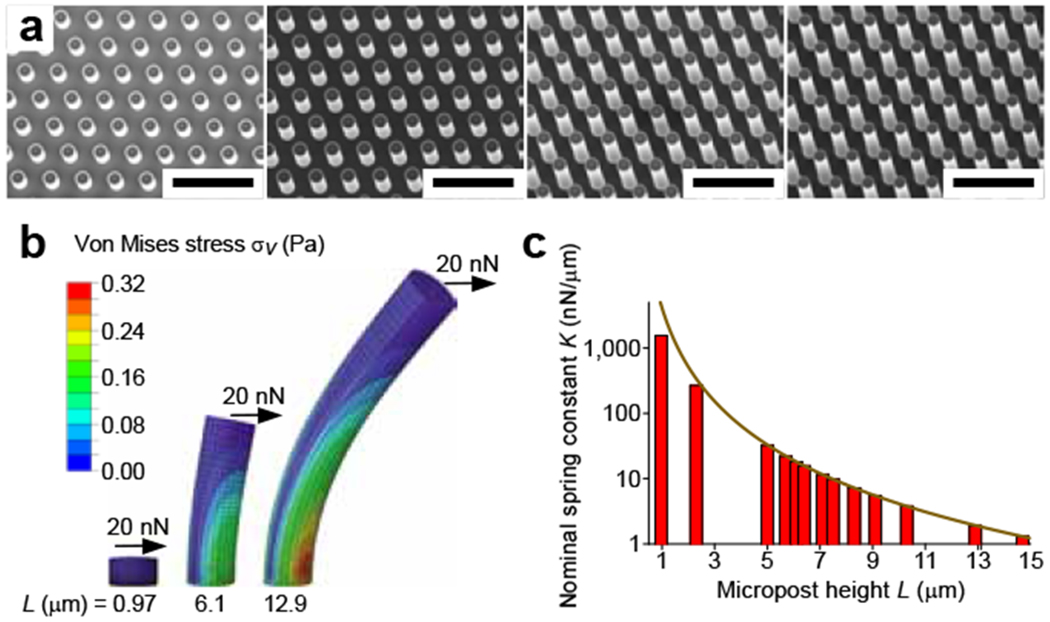
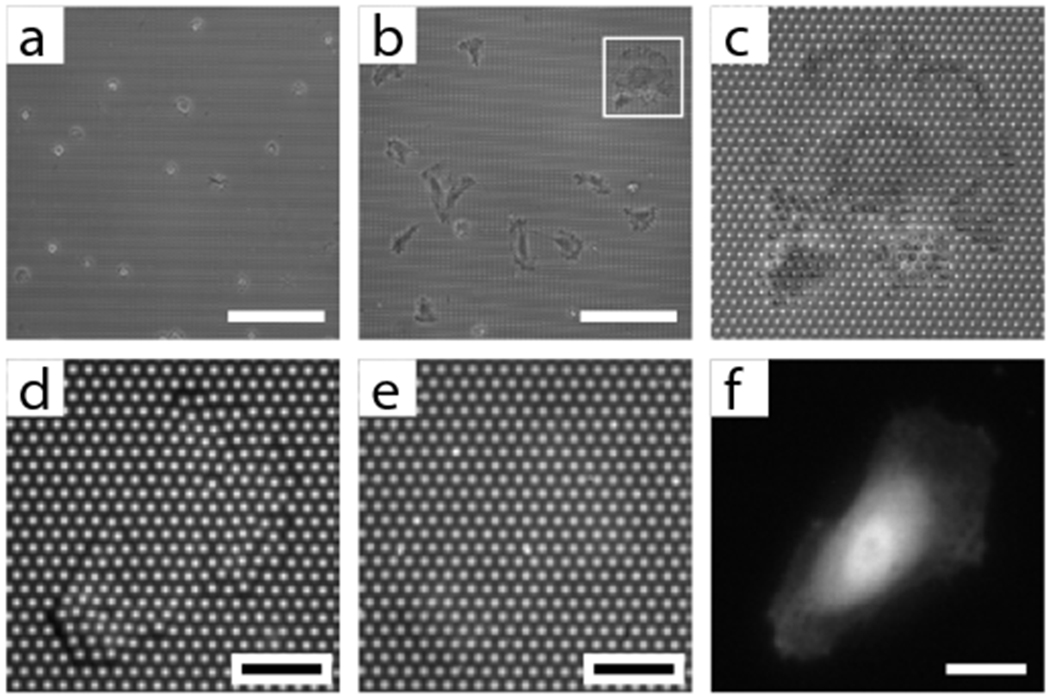
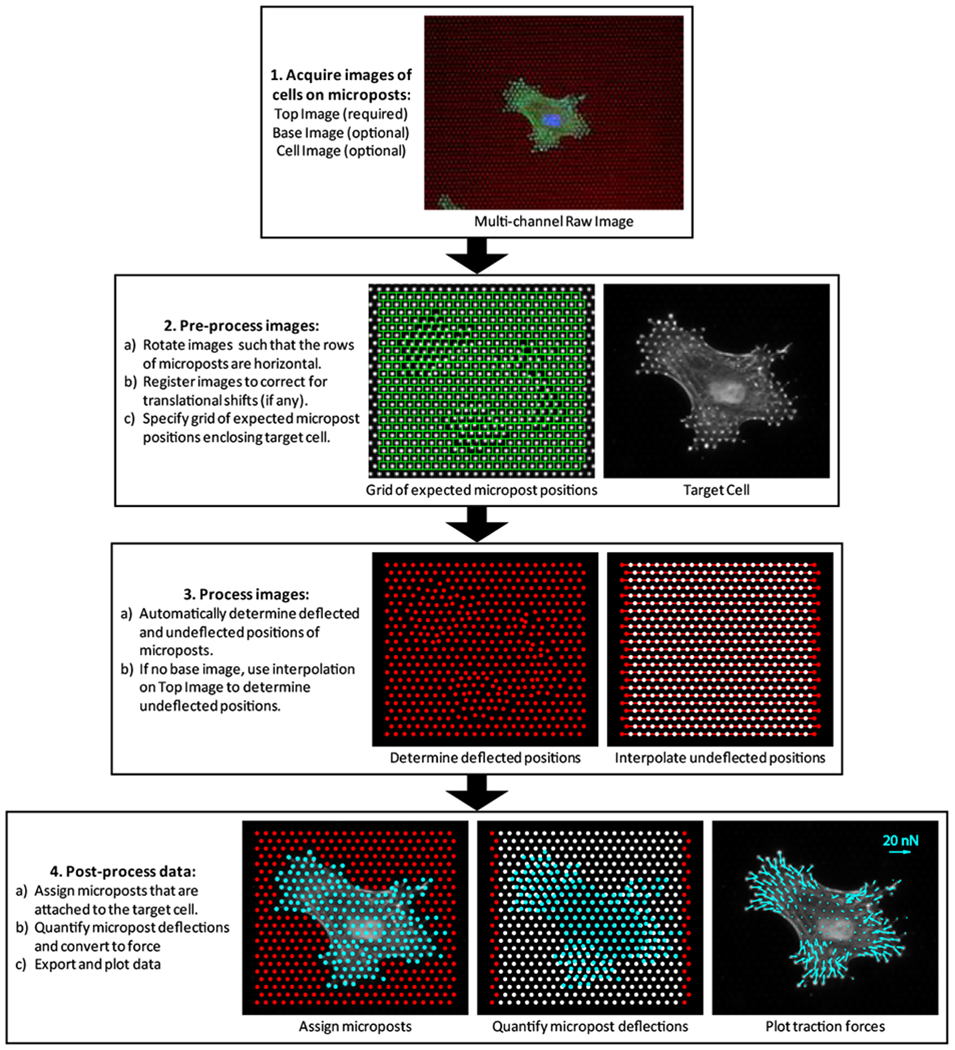
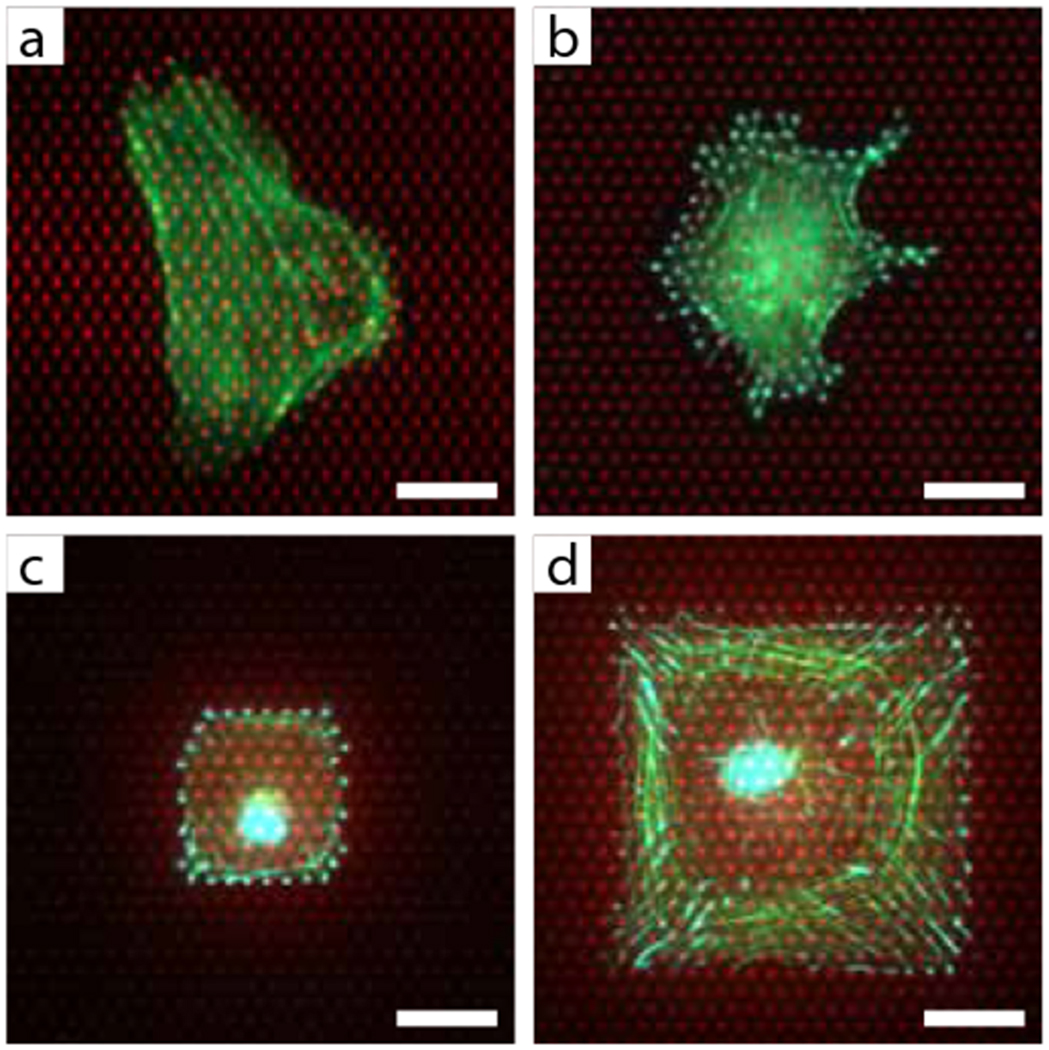
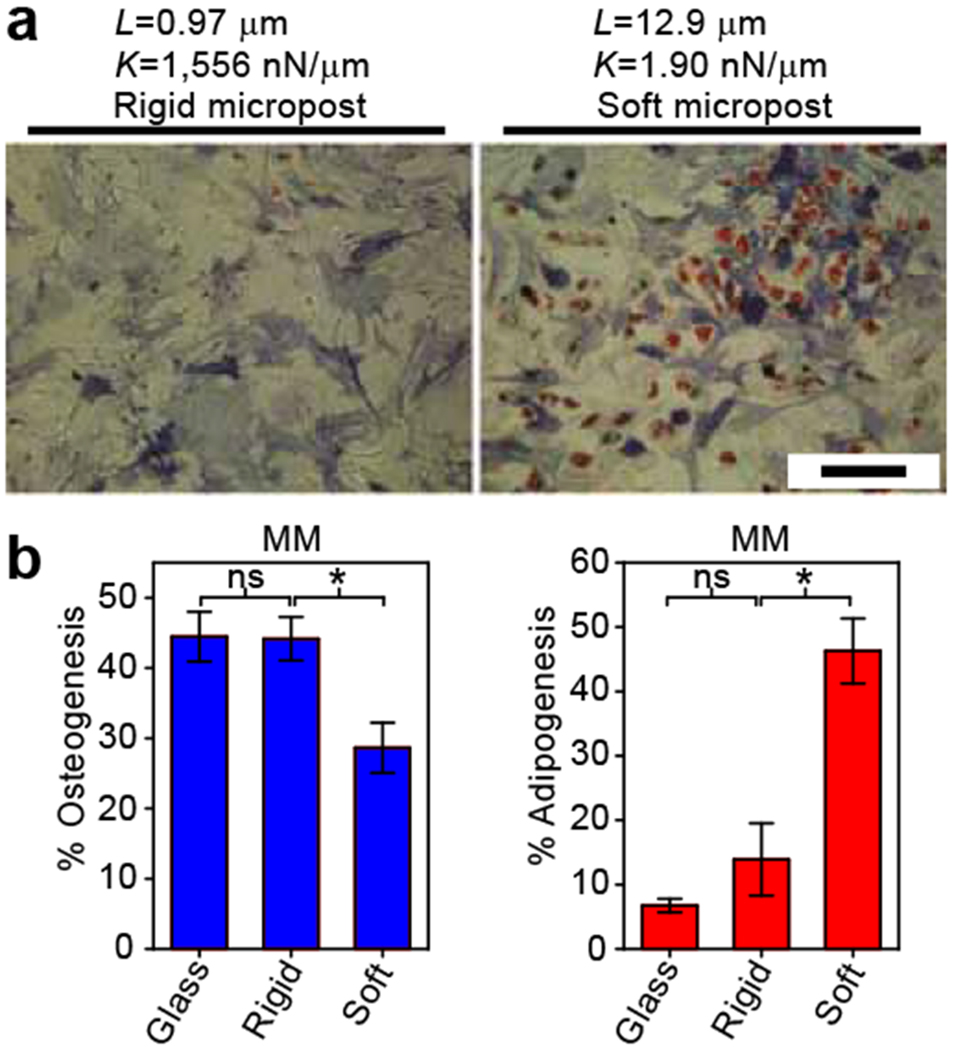
We describe the use of a microfabricated cell culture substrate, consisting of a uniform array of closely spaced, vertical, elastomeric microposts, to study the effects of substrate rigidity on cell function. Elastomeric micropost substrates are micromolded from silicon masters comprised of microposts of different heights to yield substrates of different rigidities. The tips of the elastomeric microposts are functionalized with extracellular matrix through microcontact printing to promote cell adhesion. These substrates, therefore, present the same topographical cues to adherent cells while varying substrate rigidity only through manipulation of micropost height. This protocol describes how to fabricate the silicon micropost array masters (~2 weeks to complete) and elastomeric substrates (3 d), as well as how to perform cell culture experiments (1-14 d), immunofluorescence imaging (2 d), traction force analysis (2 d) and stem cell differentiation assays (1 d) on these substrates in order to examine the effect of substrate rigidity on stem cell morphology, traction force generation, focal adhesion organization and differentiation.
Conflict of interest statement
COMPETING INTERESTS STATEMENT
The authors declare that they have no competing financial interests.
Figures
Similar articles
-
Mechanical regulation of cell function with geometrically modulated elastomeric substrates.Nat Methods. 2010 Sep;7(9):733-6. doi: 10.1038/nmeth.1487. Epub 2010 Aug 1. Nat Methods. 2010. PMID: 20676108 Free PMC article.
-
Micropatterning on micropost arrays.Methods Cell Biol. 2014;121:61-73. doi: 10.1016/B978-0-12-800281-0.00005-1. Methods Cell Biol. 2014. PMID: 24560503
-
Traction Force Measurement Using Deformable Microposts.Methods Mol Biol. 2017;1627:235-244. doi: 10.1007/978-1-4939-7113-8_16. Methods Mol Biol. 2017. PMID: 28836206
-
For whom the cells pull: Hydrogel and micropost devices for measuring traction forces.Methods. 2016 Feb 1;94:51-64. doi: 10.1016/j.ymeth.2015.08.005. Epub 2015 Aug 8. Methods. 2016. PMID: 26265073 Free PMC article. Review.
-
Microfabricated substrates as a tool to study cell mechanotransduction.Med Biol Eng Comput. 2010 Oct;48(10):965-76. doi: 10.1007/s11517-010-0619-9. Epub 2010 Apr 28. Med Biol Eng Comput. 2010. PMID: 20424924 Review.
Cited by
-
Development of functional biomaterials with micro- and nanoscale technologies for tissue engineering and drug delivery applications.J Tissue Eng Regen Med. 2014 Jan;8(1):1-14. doi: 10.1002/term.1494. Epub 2012 Jun 18. J Tissue Eng Regen Med. 2014. PMID: 22711442 Free PMC article. Review.
-
Mechanics regulates fate decisions of human embryonic stem cells.PLoS One. 2012;7(5):e37178. doi: 10.1371/journal.pone.0037178. Epub 2012 May 16. PLoS One. 2012. PMID: 22615930 Free PMC article.
-
Two-bubble acoustic tweezing cytometry for biomechanical probing and stimulation of cells.Biophys J. 2015 Jan 6;108(1):32-42. doi: 10.1016/j.bpj.2014.11.050. Biophys J. 2015. PMID: 25564850 Free PMC article.
-
Mechanobiology of platelets: techniques to study the role of fluid flow and platelet retraction forces at the micro- and nano-scale.Int J Mol Sci. 2011;12(12):9009-30. doi: 10.3390/ijms12129009. Epub 2011 Dec 7. Int J Mol Sci. 2011. PMID: 22272117 Free PMC article. Review.
-
Stiffening of human mesenchymal stem cell spheroid microenvironments induced by incorporation of gelatin microparticles.J Mech Behav Biomed Mater. 2012 Jul;11:63-71. doi: 10.1016/j.jmbbm.2012.02.018. Epub 2012 Mar 3. J Mech Behav Biomed Mater. 2012. PMID: 22658155 Free PMC article.
References
-
- Fuchs E, Tumbar T & Guasch G Socializing with the neighbors: stem cells and their niche. Cell 116, 769–78 (2004). - PubMed
-
- Scadden DT The stem-cell niche as an entity of action. Nature 441, 1075–9 (2006). - PubMed
-
- Jones DL & Wagers AJ No place like home: anatomy and function of the stem cell niche. Nat Rev Mol Cell Biol 9, 11–21 (2008). - PubMed
Publication types
MeSH terms
Substances
Grants and funding
LinkOut - more resources
Full Text Sources
Other Literature Sources
