. 2011 Mar 21;11(6):1065-73.
doi: 10.1039/c0lc00472c. Epub 2011 Feb 3.

A microfabricated deformability-based flow cytometer with application to malaria

Affiliations

A microfabricated deformability-based flow cytometer with application to malaria

Hansen Bow et al. Lab Chip. .

Abstract

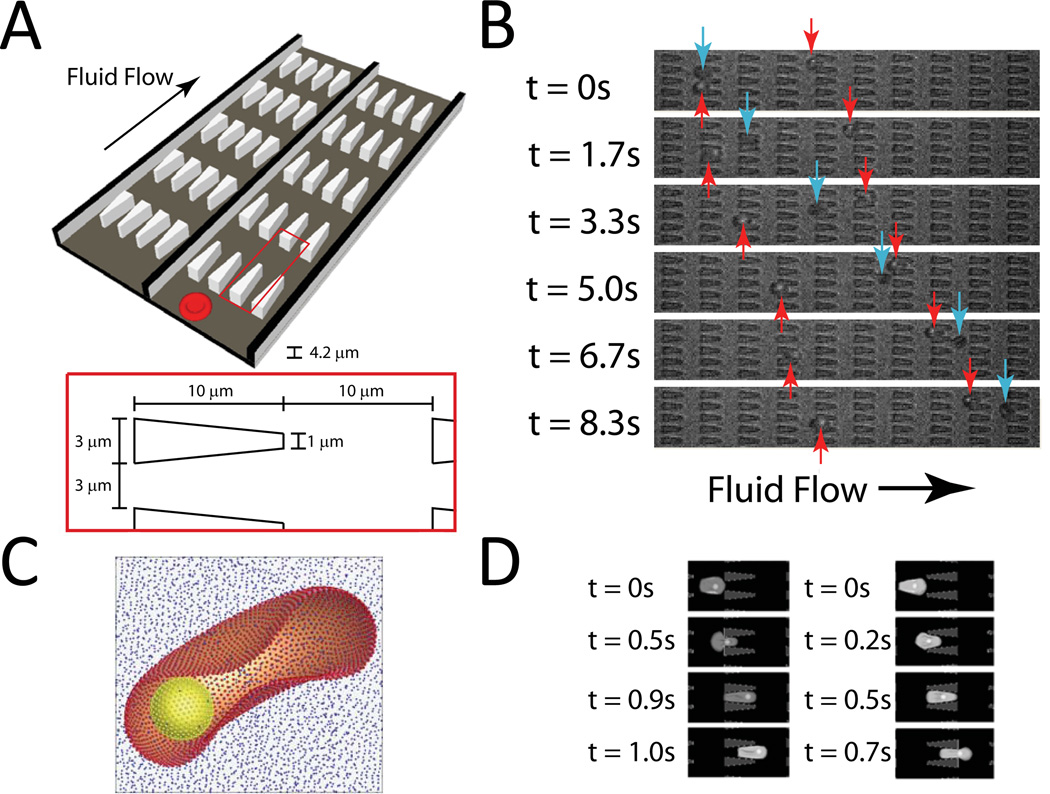
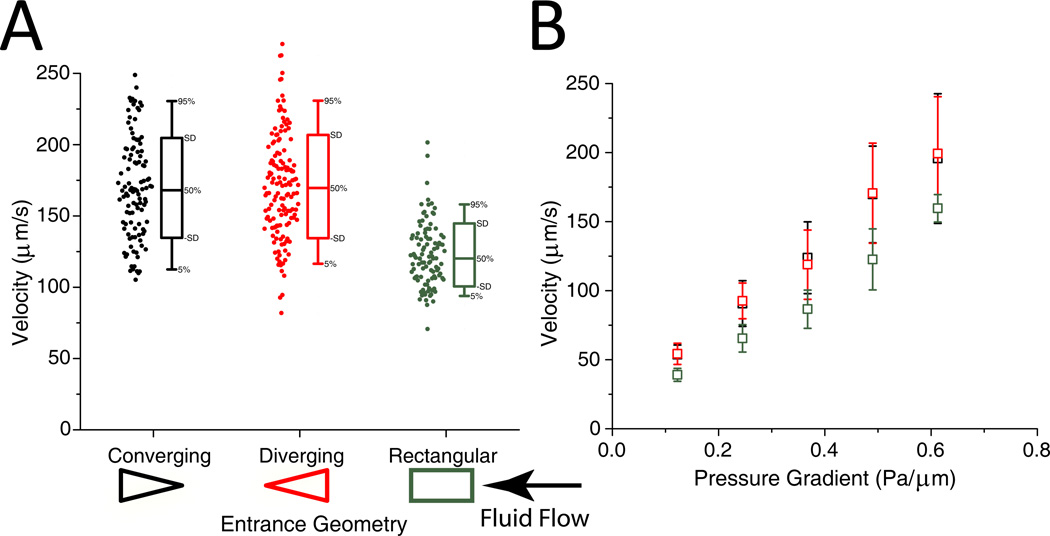
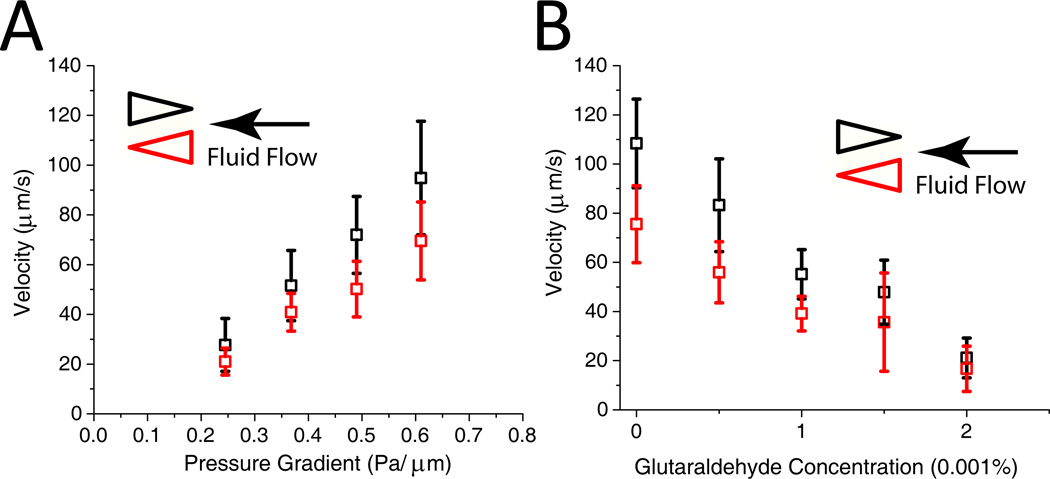
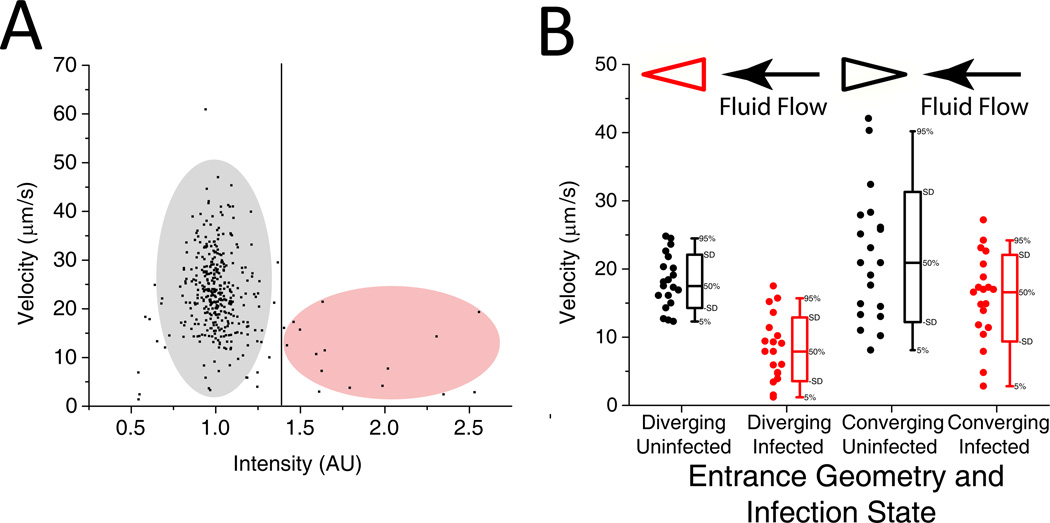
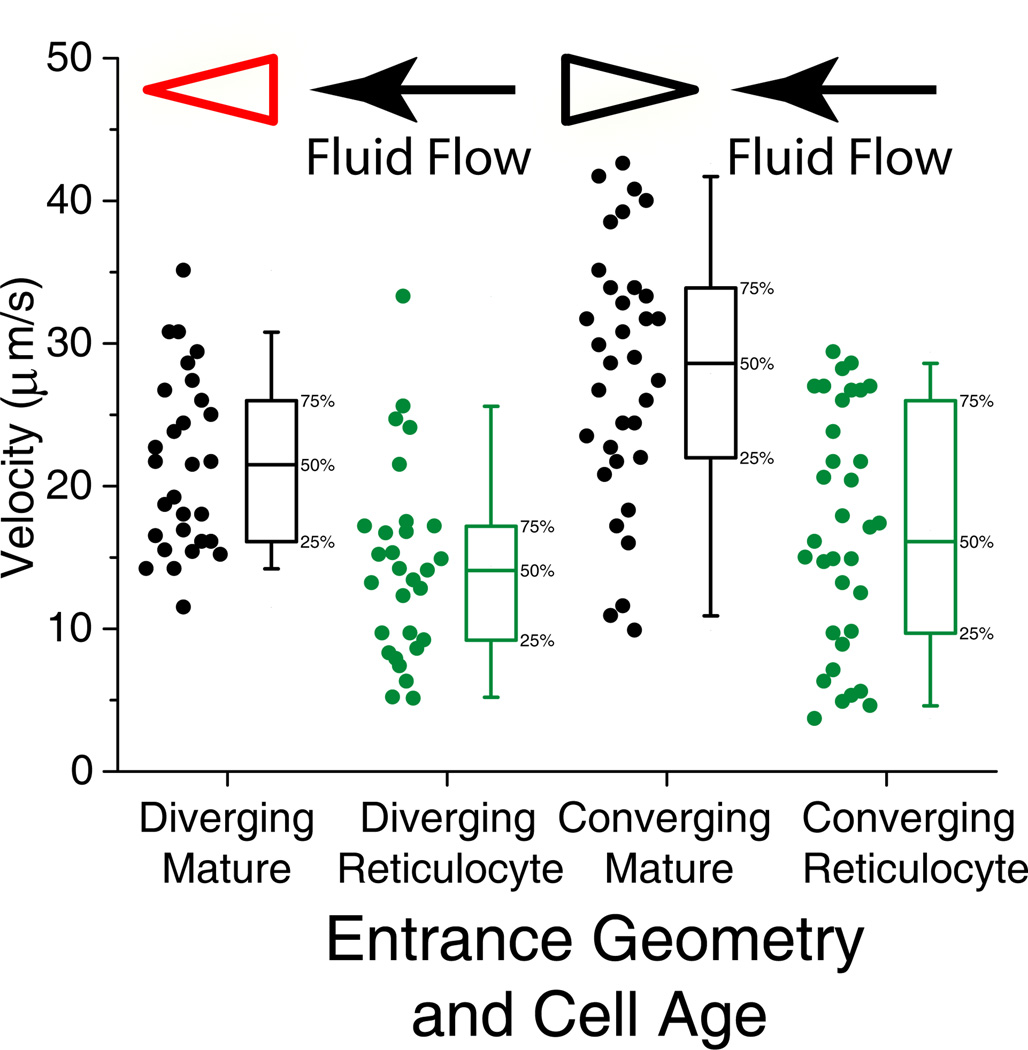
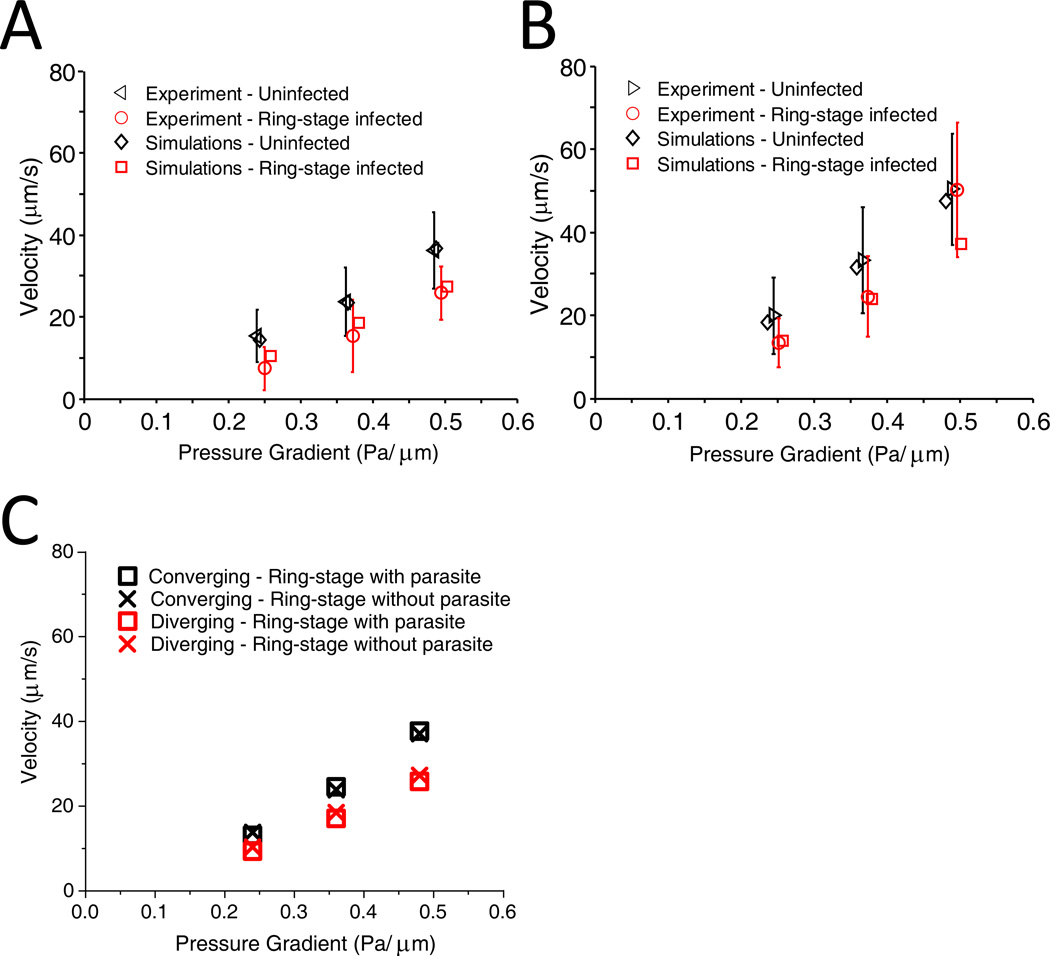
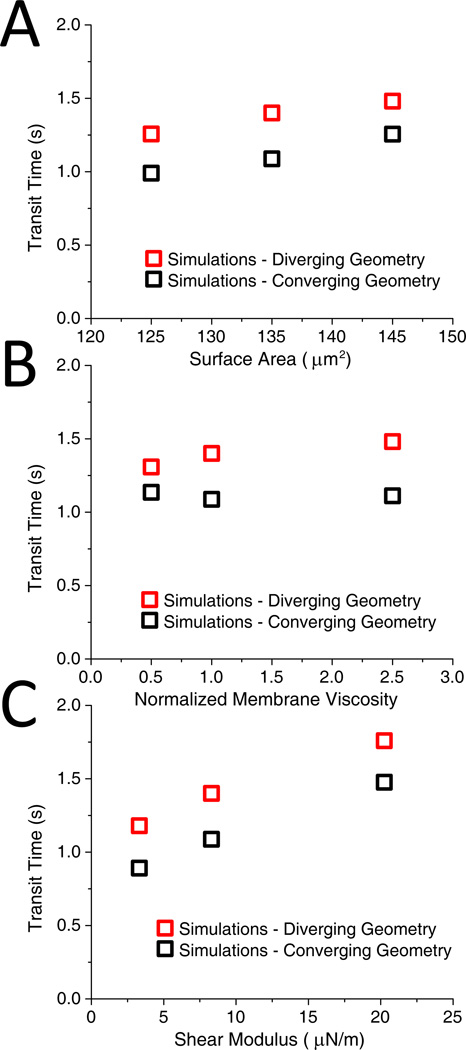
Malaria resulting from Plasmodium falciparum infection is a major cause of human suffering and mortality. Red blood cell (RBC) deformability plays a major role in the pathogenesis of malaria. Here we introduce an automated microfabricated "deformability cytometer" that measures dynamic mechanical responses of 10(3) to 10(4) individual RBCs in a cell population. Fluorescence measurements of each RBC are simultaneously acquired, resulting in a population-based correlation between biochemical properties, such as cell surface markers, and dynamic mechanical deformability. This device is especially applicable to heterogeneous cell populations. We demonstrate its ability to mechanically characterize a small number of P. falciparum-infected (ring stage) RBCs in a large population of uninfected RBCs. Furthermore, we are able to infer quantitative mechanical properties of individual RBCs from the observed dynamic behavior through a dissipative particle dynamics (DPD) model. These methods collectively provide a systematic approach to characterize the biomechanical properties of cells in a high-throughput manner.


Figures

Figure 1
Figure 1
A. Illustration of device design; each channel of the actual device is 10 pores wide and 200 pores long. B. Experimental images of ring-stage P. falciparum-infected (red arrows) and uninfected (blue arrows) RBCs in the channels at a pressure gradient of 0.24 Pa/µm. The small fluorescent dot inside the infected cell is the GFP-transfected parasite. At 8.3 s, it is clear that the uninfected cell moved about twice as far as each infected cell. C. The computational RBC model consists of 5000 particles connected with links. The P. falciparum parasite is modeled as a rigid sphere inside the cell. D. DPD simulation images of P. falciparum-infected RBCs traveling in channels of converging (left) and diverging (right) pore geometry at 0.48 Pa/µm.
Figure 2
Figure 2
A. Velocity of individual 200-nm-diameter beads at a pressure difference of 0.49 Pa/µm. There is no statistically significant difference in the velocity of beads travelling through the converging and diverging geometries. The beads travelling through the channel with rectangular obstacles move slower on average. B. Velocity vs. Pressure for the different obstacle geometries.
Figure 3
Figure 3
A Velocity vs. pressure for RBCs moving through the two pore geometries. Error bars indicate standard deviation for each measurement. B. Velocity vs. glutaraldehyde concentration (v/v). RBCs were treated with the indicated concentration of glutaraldehyde for 30 minutes in PBS and then washed 3 times. The pressure difference/length was approximately 0.61 Pa/µm.
Figure 4
Figure 4
A. FACS-like plot of velocity vs. intensity for ring-stage P. falciparum infected RBCs at a pressure gradient of 0.24 Pa/µm travelling in the converging geometry. Points to the right of the vertical line represent velocities of infected RBCs, while those to the left represent velocities of uninfected RBCs. The velocities of 381 RBCs were tracked. B. Velocity vs. infection state for RBCs infected with late ring-stage parasites at a pressure gradient of 0.24 Pa/µm. For each infected cell that was tracked, the next uninfected cell was tracked. Twenty cells were tracked for each measurement.
Figure 5
Figure 5
Velocity vs. cell maturation state. All experiments were run simultaneously, at a pressure gradient of 0.24 Pa/µm. Whole blood RBCs was stained for nucleic acid content with thiazole orange. Cells homogeneously fluorescesing under the GFP filter set were identified as reticulocytes. For every reticulocyte that was identified and tracked for 200 µm, the next cell appearing in the field of view was also tracked.
Figure 6
Figure 6
A. Velocity vs. pressure for uninfected and ring-stage-infected RBCs in diverging pore geometry: comparison of simulation and experimental results. For experimental data, mean values are shown. The error bars correspond to one standard deviation. B. Velocity vs. pressure in converging pore geometry. C. Effect of intracellular parasite presence on the velocity of ring-stage infected cells. The parasite is modeled in simulations as a rigid sphere, 2 microns in diameter, placed inside the cell.
Figure 7
Figure 7
Dissipative particle dynamics (DPD) simulations. A. Effect of RBC size variation on transit time at a pressure gradient of 0.24 Pa/µm. Cells with surface area of 125, 135 and 145 µm2 are modeled with corresponding volumes of 85, 94 and 103 µm3. B. Effect of membrane viscosity variation on RBC transit time at a pressure gradient of 0.24 Pa/µm. The membrane viscosity is normalized by the uninfected cell membrane viscosity value. C. RBC transit time vs. membrane shear modulus at 0.24 Pa/µm.

References

    1. McMillan D, Utterback N, La Puma J. Diabetes. 1978;27:895–901. - PubMed
    1. Cranston H, Boylan C, Carroll G, Sutera S, Williamson J, Gluzman I, Krogstad D. Science. 1983;233:400–403. - PubMed
    1. Mokken FC, Kedaria M, Henny CP, Hardeman M, Gleb A. Ann. Hematol. 1992;64:113–122. - PubMed
    1. WHO. World Malaria Report 2008. 2008
    1. Maier A, Cooke B, Cowman A, Tilley L. Nature Reviews Microbiology. 2009;7:341–354. - PubMed

Publication types