. 2011 Jun;129(6):629-39.
doi: 10.1007/s00439-011-0960-6. Epub 2011 Feb 4.

A dynamic model for genome-wide association studies

Affiliations

A dynamic model for genome-wide association studies

Kiranmoy Das et al. Hum Genet. 2011 Jun.

Abstract

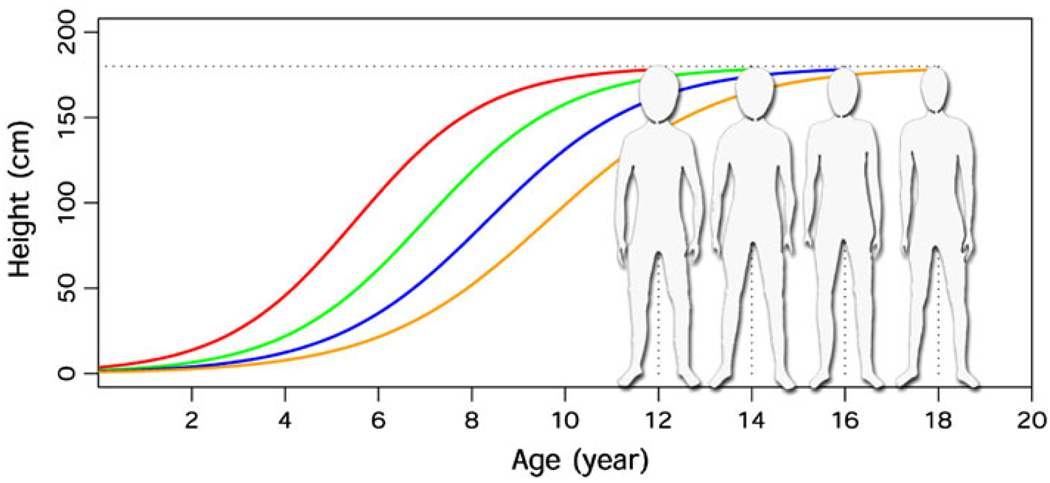
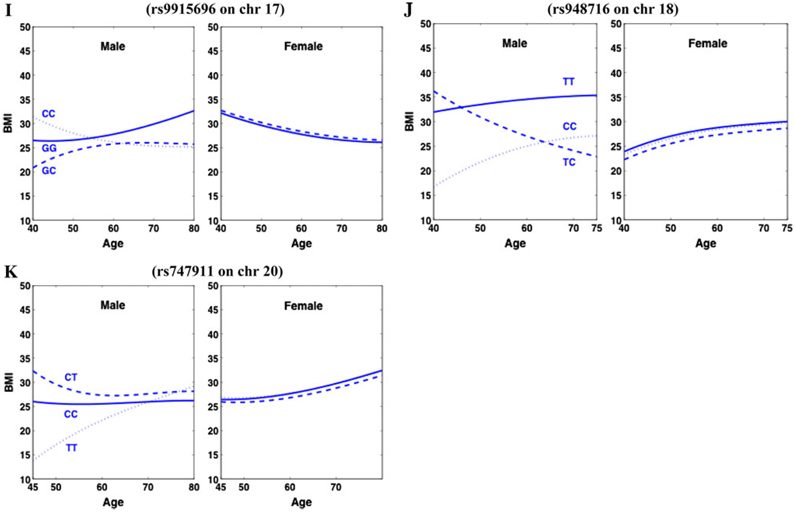
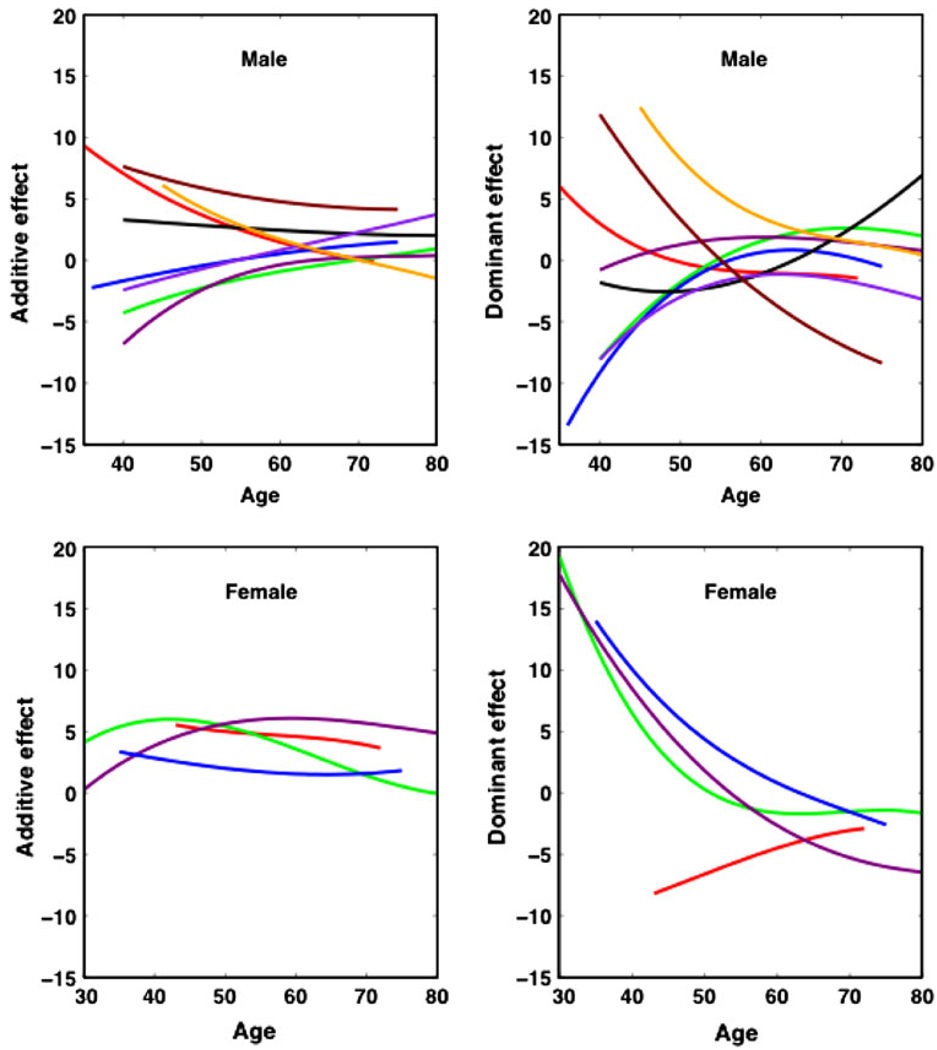
Although genome-wide association studies (GWAS) are widely used to identify the genetic and environmental etiology of a trait, several key issues related to their statistical power and biological relevance have remained unexplored. Here, we describe a novel statistical approach, called functional GWAS or fGWAS, to analyze the genetic control of traits by integrating biological principles of trait formation into the GWAS framework through mathematical and statistical bridges. fGWAS can address many fundamental questions, such as the patterns of genetic control over development, the duration of genetic effects, as well as what causes developmental trajectories to change or stop changing. In statistics, fGWAS displays increased power for gene detection by capitalizing on cumulative phenotypic variation in a longitudinal trait over time and increased robustness for manipulating sparse longitudinal data.


Figures

Fig. 1
Fig. 1
Final heights and growth curves of four subjects
Fig. 2
Fig. 2
Plots of BMI measured at different ages for five males (a) and five females (b) randomly sampled from the Framingham Heart Study. The sparsity and irregularity of longitudinal data for BMI are reflected by subject-specific uneven-spaced age intervals
Fig. 3
Fig. 3
a p plot (expected vs. observed p values) for male population in Framingham Heart Study. b p plot (expected vs. observed p values) for female population in Framingham Heart Study
Fig. 4
Fig. 4
Age-specific trajectories of BMI in different sexes for three genotypes at each significant SNP detected from various chromosomes
Fig. 4
Fig. 4
Age-specific trajectories of BMI in different sexes for three genotypes at each significant SNP detected from various chromosomes
Fig. 5
Fig. 5
Age-specific change of the additive and dominant genetic effects on BMI in different sexes for each significant SNP detected from various chromosomes. The additive effect is defined as the homozygote for the common allele minus the homozygote for the minor allele. The additive and dominant effects near zero suggest their absence

Similar articles

Cited by

References

    1. Altshuler D, Daly MJ, Lander ES. Genetic mapping in human disease. Science. 2008;322:881–888. - PMC - PubMed
    1. Anholt RRH, Mackay TFC. Genetic analysis of complex behaviors in Drosophila. Nat Rev Genet. 2004;5:838–849. - PubMed
    1. Atchley WR, Zhu J. Developmental quantitative genetics, conditional epigenetic variability and growth in mice. Genetics. 1997;147:765–776. - PMC - PubMed
    1. Bock RD, Thissen D. Fitting multi-component models for growth in stature; Proceedings of the 9th international biometrics conference; 1976. pp. 431–442.
    1. Bogardus C. Missing heritability and GWAS utility. Obesity. 2009;17:209–210. - PMC - PubMed

Publication types

LinkOut - more resources