. 2011 Mar;53(3):983-95.
doi: 10.1002/hep.24119. Epub 2011 Feb 3.

Septum transversum-derived mesothelium gives rise to hepatic stellate cells and perivascular mesenchymal cells in developing mouse liver

Affiliations

Septum transversum-derived mesothelium gives rise to hepatic stellate cells and perivascular mesenchymal cells in developing mouse liver

Kinji Asahina et al. Hepatology. 2011 Mar.

Abstract

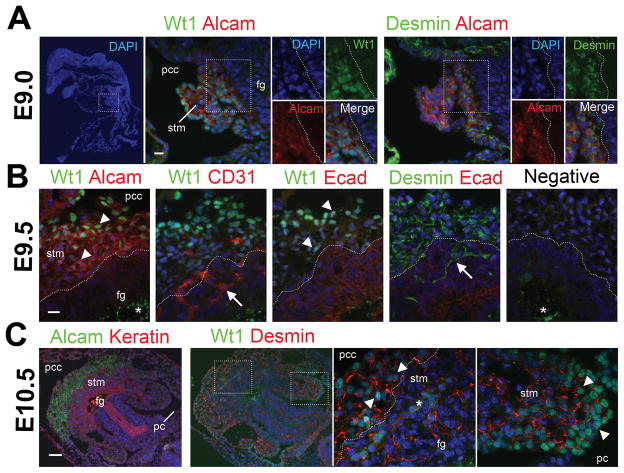
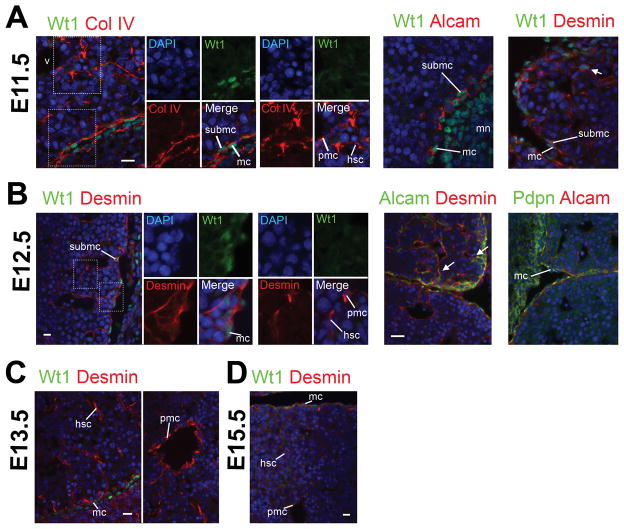
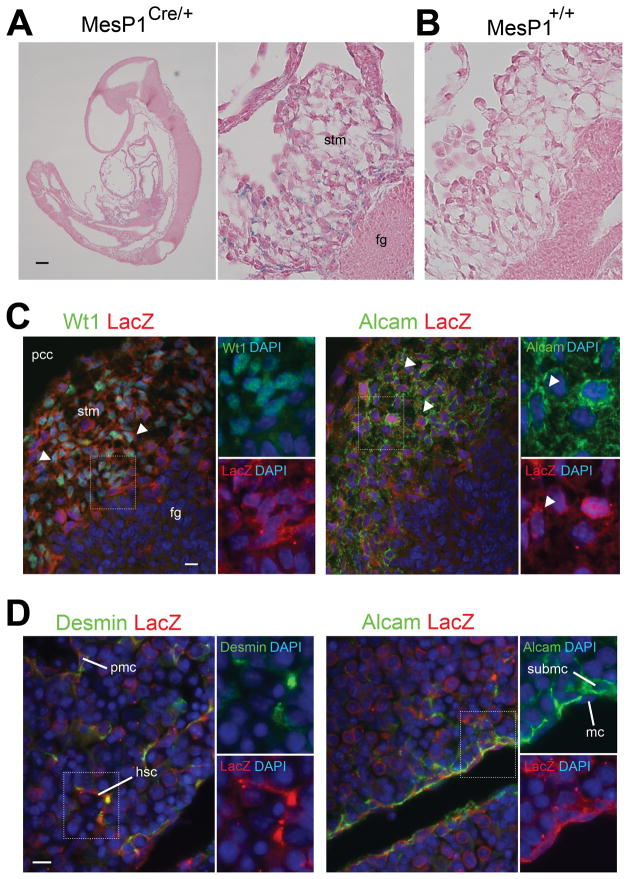
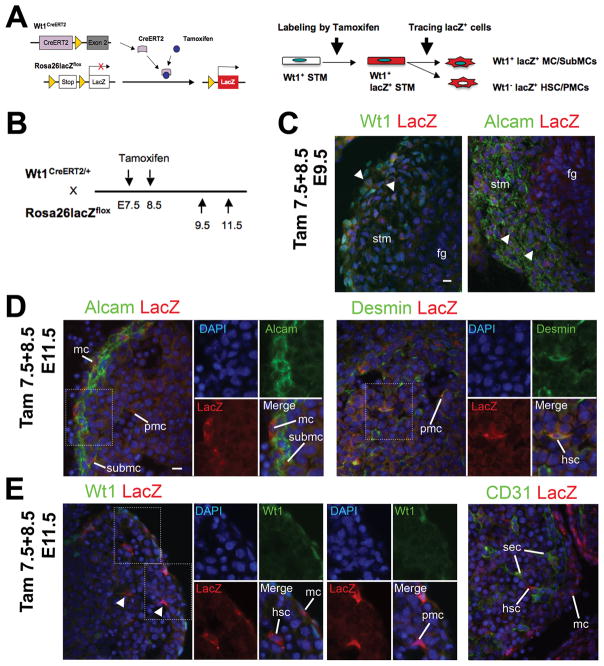
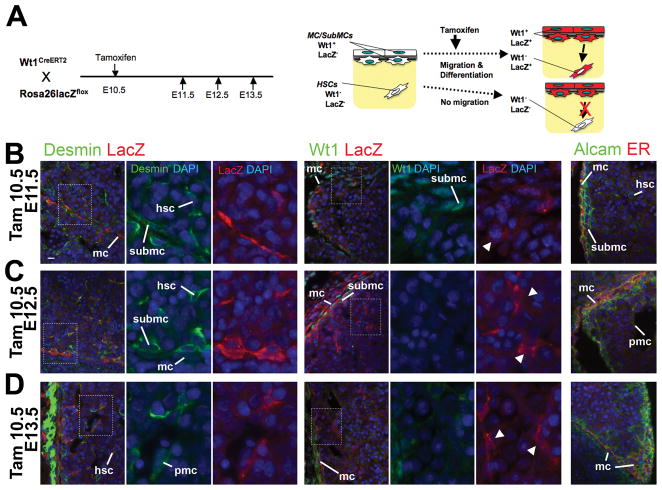
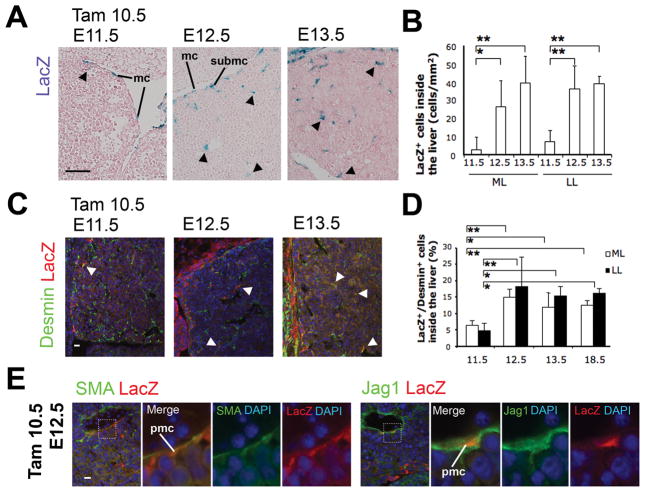
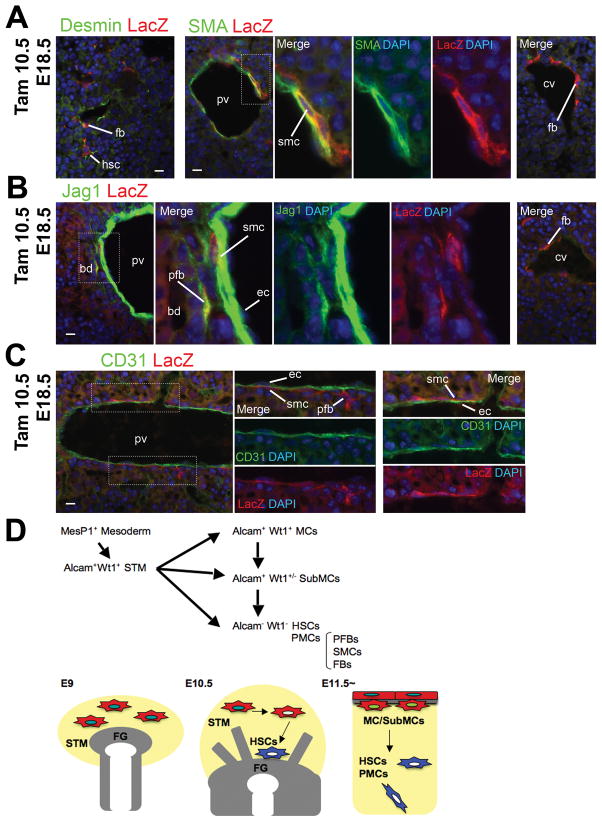
The septum transversum mesenchyme (STM) signals to induce hepatogenesis from the foregut endoderm. Hepatic stellate cells (HSCs) are sinusoidal pericytes assumed to originate from the STM and participate in mesenchymal-epithelial interaction in embryonic and adult livers. However, the developmental origin of HSCs remains elusive due to the lack of markers for STM and HSCs. We previously identified submesothelial cells (SubMCs) beneath mesothelial cells (MCs) as a potential precursor for HSCs in developing livers. In the present study, we reveal that both STM in embryonic day (E) 9.5 and MC/SubMCs in E12.5 share the expression of activated leukocyte cell adhesion molecule (Alcam), desmin, and Wilms tumor 1 homolog (Wt1). A cell lineage analysis using MesP1(Cre) /Rosa26lacZ(flox) mice identifies the mesodermal origin of the STM, HSCs, and perivascular mesenchymal cells (PMCs). A conditional cell lineage analysis using the Wt1(CreERT2) mice demonstrates that Wt1(+) STM gives rise to MCs, SubMCs, HSCs, and PMCs during liver development. Furthermore, we find that Wt1(+) MC/SubMCs migrate inward from the liver surface to generate HSCs and PMCs including portal fibroblasts, smooth muscle cells, and fibroblasts around the central veins. On the other hand, the Wt1(+) STM and MC/SubMCs do not contribute to sinusoidal endothelial cells, Kupffer cells, and hepatoblasts.

Conclusion: our results demonstrate that HSCs and PMCs are derived from MC/SubMCs, which are traced back to mesodermal STM during liver development.


Figures

Fig. 1
Fig. 1
Expression of Alcam, desmin, and Wt1 in the STM of the mouse embryos from E9.0 to E10.5. Serial sections prepared from embryos at E9.0 (A, sagittal sections), E9.5 (B, transverse sections), and E10.5 (C, transverse sections) were immunostained with antibodies against Alcam, CD31, desmin, E-cadherin (Ecad), cytokeratin (Keratin), and Wt1. Nuclei were counterstained with DAPI. Note that the STM expresses Alcam, desmin, and Wt1 from E9.0 to E10.5. The nuclear staining of Wt1 is seen in the STM (arrowheads), but not in CD31+ endothelial cells and E-cadherin+ endoderm in E9.5. The nuclear Wt1 expression becomes weak in the STM near the foregut endoderm (fg). Arrows indicate desmin+ Wt1 mesenchymal cells and CD31+ Wt1 endothelial cells trapped in the growing endoderm. Asterisks indicate non-specific signals at the yolk and blood cells. Negative control without primary antibodies is shown in B (negative). pc, peritoneal cavity; pcc, pericardial cavity; stm, septum transversum mesenchyme. Bar, 10 μm (A,B), 50 μm (C).
Fig. 2
Fig. 2
Expression of Wt1 in MCs and some SubMCs in mouse embryos from E11.5 to E15.5. Embryos at E11.5 (A), E12.5 (B), E13.5 (C), and E15.5 (D) were immunostained with antibodies against Alcam, desmin, podoplanin (Pdpn), type IV collagen (Col IV), and Wt1. Nuclei were counterstained with DAPI. Expression of Wt1 is seen in MCs and some SubMCs in E11.5. The number of Wt1+ MC/SubMCs decreases from E12.5 livers. No Wt1 expression is seen in liver HSCs and PMCs from E11.5 to E15.5. An arrow indicates rare desmin+ Wt1+ mesenchymal cells near the liver surface in E11.5 (A). In E12.5, Alcam+ desmin+ SubMCs seem to migrate inward and give rise to Alcam desmin+ HSCs near the liver surface (B, arrows). Podoplanin (Pdpn) is exclusively expressed in MCs. hsc, hepatic stellate cells; mc, mesothelial cells; mn, metanephros; pmc, perivascular mesenchymal cells; submc, submesothelial cells; v, veins. Bar, 10 μm.
Fig. 3
Fig. 3
MesP1+ mesoderm gives rise to HSCs via STM during mouse embryogenesis. The embryos from the MesP1Cre and Rosa26lacZflox mice were analyzed by X-gal staining (A,B) and immunohistochemistry (C,D). (A) The E9.0 MesP1Cre/+; Rosa26lacZflox/+ embryo shows lacZ expression in the STM adjacent to the foregut endoderm (fg). (B) No lacZ staining in the wild type littermate. Embryos were counterstained with eosin. (C) The STM in E9.5 MesP1Cre/+; Rosa26lacZflox/+ embryos coexpresses lacZ with Wt1 or Alcam (arrowheads). (D) Desmin+ HSCs and PMCs and Alcam+ MCs and SubMCs coexpresses lacZ in E12.5 MesP1Cre/+; Rosa26lacZflox/+ embryos. Nuclei were counterstained with DAPI. hsc, hepatic stellate cells; mc, mesothelial cells; pcc, pericardial cavity; pmc, perivascular mesenchymal cells; stm, septum transversum mesenchyme; submc, submesothelial cells. Bar, 100 μm (A), 10 μm (C,D).
Fig. 4
Fig. 4
The Wt1+ STM gives rise to HSCs and PMCs during liver development. The Wt1+ STM lineage was analyzed using the Wt1CreERT2 and Rosa26lacZflox mice. (A) Tamoxifen induces lacZ expression in Wt1+ STM. After tamoxifen injection, the CreERT2 excises the stop sequence between the loxP sites (triangles). Then, the lacZ gene is expressed in Wt1-expressing cells. If the STM gives rise to HSCs and PMCs, tamoxifen injection results in the expression of lacZ in Wt1 HSCs and PMCs inside the liver. (B) After tamoxifen injection twice at E7.5 and 8.5, the embryos at E9.5, and 11.5 were analyzed. (C-E) Immunohistochemistry of Alcam, CD31, desmin, lacZ, and Wt1 in the E9.5 (C) and E11.5 (D,E) embryos. Nuclei were counterstained with DAPI. Arrowheads indicate lacZ+ cells in Wt1+ or Alcam+ cells in the STM (C). Note that lacZ signals are detected in 5.6 ± 1.0% of Alcam+ cells in the STM in the E9.5 embryos. The percentage was obtained from total 906 Alcam+ cells. Results are means ± SD of 5 independent sections. In E11.5 embryos, lacZ expression is seen in Alcam+ MCs and SubMCs (D). LacZ is expressed in 10.5 ± 4.9% (ML) and 9.0 ± 2.7% (LL) of desmin+ cells in the E11.5 livers. These percentages were obtained from 1,643 (ML) and 2,058 (LL) desmin+ HSCs and PMCs inside the liver. No Wt1 expression in the lacZ+ HSCs and PMCs (E, arrowheads). No lacZ expression in CD31+ SECs (E). fg, foregut endoderm; hsc, hepatic stellate cells; mc, mesothelial cells; pmc, perivascular mesenchymal cells; sec, sinusoidal endothelial cells; stm, septum transversum mesenchyme; submc, submesothelial cells. Bar, 10 μm.
Fig. 5
Fig. 5
Wt1+ MC/SubMCs give rise to HSCs and PMCs during liver development. Wt1+ MC/SubMC lineage was analyzed using the Wt1CreERT2 and Rosa26lacZflox mice. (A) Conditional labeling of Wt1+ MC/SubMCs using the Wt1CreERT2 and Rosa26lacZflox mice. After tamoxifen injection at E10.5, the embryos at E11.5, 12.5 and 13.5 were serially analyzed. If MC/SubMCs migrate inward and give rise to HSCs and PMCs, tamoxifen injection results in the expression of lacZ in Wt1 HSCs and PMCs inside the liver. (B-D) Immunohistochemistry of Alcam, desmin, CreERT2 (ER), lacZ and Wt1 in the E11.5 (B), E12.5 (C), and E13.5 (D) embryos after tamoxifen injection at E10.5. Nuclei were counterstained with DAPI. Note that tamoxifen induces lacZ expression in MC/SubMCs from E11.5 to E13.5 livers. In E11.5, lacZ expression is rare in desmin+ HSCs inside the liver. From E12.5 livers, lacZ expression is readily found in desmin+ HSCs and PMCs inside the livers. LacZ+ HSCs and PMCs do not express Wt1 inside the livers (arrowheads), indicating the migration and differentiation of Wt1+ MC/SubMCs to Wt1 HSCs and PMCs between E11.5 to E13.5. No CreERT2 (ER) expression in HSCs and PMCs. hsc, hepatic stellate cells; mc, mesothelial cells; pmc, perivascular mesenchymal cells; submc, submesothelial cells. Bar, 10 μm.
Fig. 6
Fig. 6
Quantification of Wt1+ MC/SubMC-derived HSC/PMCs in developing livers. The embryos at E11.5, 12.5 and 13.5 were serially analyzed after tamoxifen injection at E10.5. (A) X-gal staining. Nuclei were counterstained with Nuclear fast red. Arrowheads indicate lacZ+ HSCs and PMCs inside the livers. (B) The lacZ+ cells including both HSCs and PMCs inside the liver were counted. Results are means ± SD of 6 independent sections. LL, left lobe; ML, median lobe. (C) Immunohistochemistry of desmin and lacZ. Nuclei were counterstained with DAPI. Arrowheads indicate lacZ+ desmin+ HSCs and PMCs inside the livers. (D) Percentages of the lacZ+/desmin+ cells inside the livers obtained from total 21,571 (E11.5, 768; E12.5, 1,401; E13.5, 2,252; E18.5, 17,150) and 31,909 (E11.5, 950; E12.5, 2,097; E13.5, 5,212; E18.5, 23,650) desmin+ cells in the ML and LL, respectively. The immunostaining images of the E18.5 livers are shown in Fig. 7A. Results are means ± SD of 5 independent sections. *P < .05, **P < .01. (E) Immunostaining of lacZ with SMA or Jag1 in E12.5 livers after tamoxifen injection at E10.5. LacZ expression is seen in SMA+ and Jag1+ PMCs. mc, mesothelial cells; pmc, perivascular mesenchymal cells; submc, submesothelial cells. Bar, 50 μm (A), 10 μm (C,E).
Fig. 7
Fig. 7
Wt1+ MC/SubMCs give rise to HSCs and PMCs including PFBs, SMCs, and FBs during liver morphogenesis. (A-C) Conditional labeling of Wt1+ MC/SubMCs using the Wt1CreERT2 and Rosa26lacZflox mice. Immunohistochemistry of CD31, desmin, Jag1, lacZ, and SMA in the E18.5 livers after tamoxifen injection at E10.5. Nuclei were counterstained with DAPI. Note that the expression of lacZ is seen in desmin+ HSCs and SMA+ SMCs in the portal veins (A). The percentages of the lacZ+ HSCs and PMCs in E18.5 livers are shown in Fig. 6D. PFBs adjacent to the bile duct coexpress lacZ (B). FBs around the central veins express desmin and lacZ (A,B). LacZ+ SMCs closely contact to CD31+ lacZ endothelial cells in the portal veins (C). bd, bile ducts; cv, central veins; ec, endothelial cells; fb, fibroblasts; hsc, hepatic stellate cells; pfb, portal fibroblasts; pv, portal veins; smc, smooth muscle cells. Bar, 10 μm. (D) Summary of the cell lineage analyses. MesP1+ mesoderm gives rise to the STM. Alcam+ Wt1+ STM loses expression of Alcam and Wt1 and differentiates into HSCs and PMCs around E10.5. From E11.5, MC/SubMCs show the similar phenotype of STM expressing Alcam and Wt1. MC/SubMCs lose expression of Alcam and Wt1, migrate inward from the liver surface, and give rise to HSCs and PMCs including PFBs, SMCs, and FBs during liver development.

References

    1. Friedman SL. Hepatic stellate cells: protean, multifunctional, and enigmatic cells of the liver. Physiol Rev. 2008;88:125–172. - PMC - PubMed
    1. Bataller R, Brenner DA. Liver fibrosis. J Clin Invest. 2005;115:209–218. - PMC - PubMed
    1. Popov Y, Schuppan D. Targeting liver fibrosis: strategies for development and validation of antifibrotic therapies. Hepatology. 2009;50:1294–1306. - PubMed
    1. Bhunchet E, Wake K. Role of mesenchymal cell populations in porcine serum-induced rat liver fibrosis. Hepatology. 1992;16:1452–1473. - PubMed
    1. Zarets KS. Regulatory phases of early liver development: paradigms of organogenesis. Nat Rev Genet. 2002;3:499–512. - PubMed

Publication types