. 2011 Jul;78(1):14-24.
doi: 10.1111/j.1747-0285.2011.01096.x. Epub 2011 May 26.

Transferred NOESY NMR studies of biotin mimetic peptide (FSHPQNT) bound to streptavidin: a structural model for studies of peptide-protein interactions

Affiliations

Transferred NOESY NMR studies of biotin mimetic peptide (FSHPQNT) bound to streptavidin: a structural model for studies of peptide-protein interactions

Dawit Gizachew et al. Chem Biol Drug Des. 2011 Jul.

Abstract

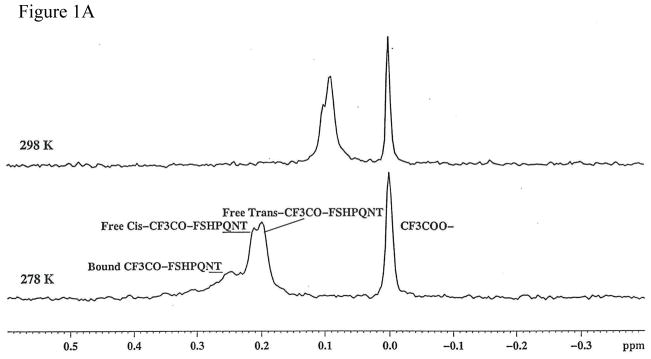
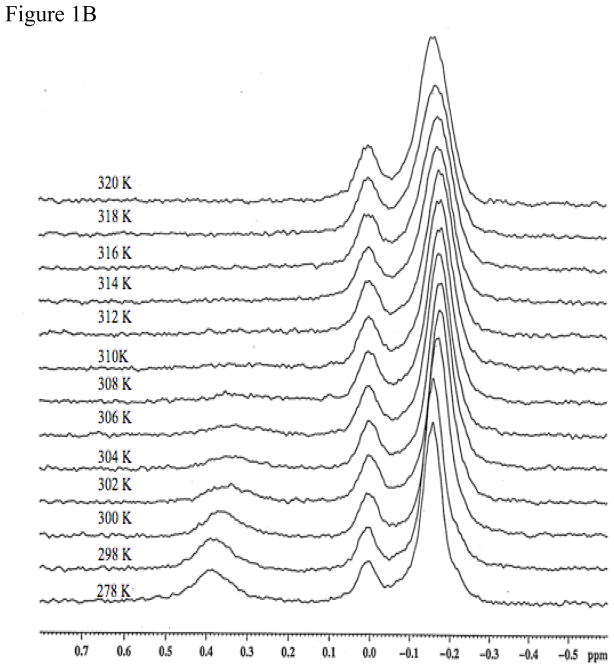
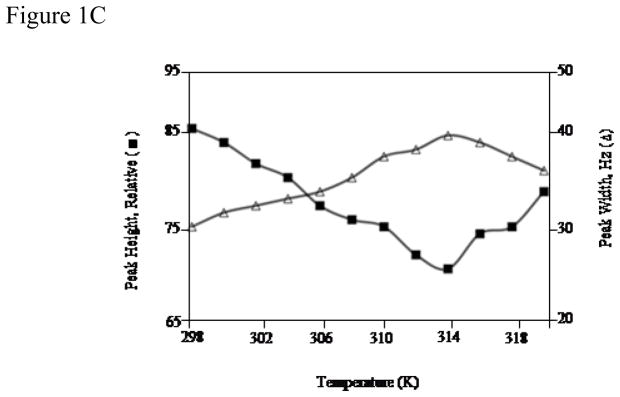
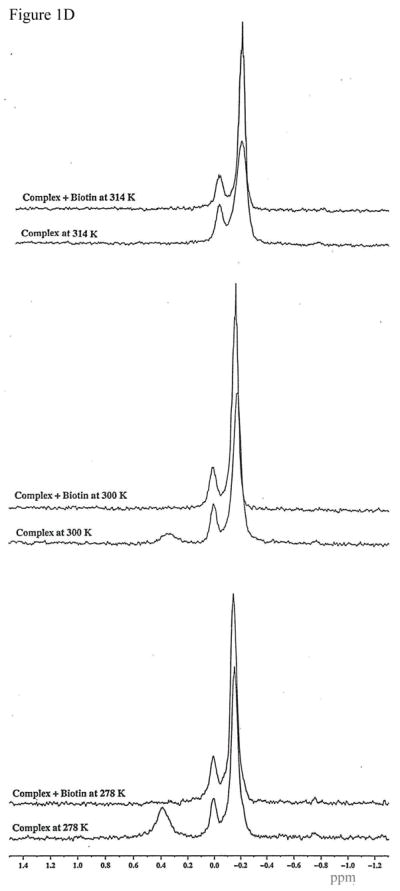
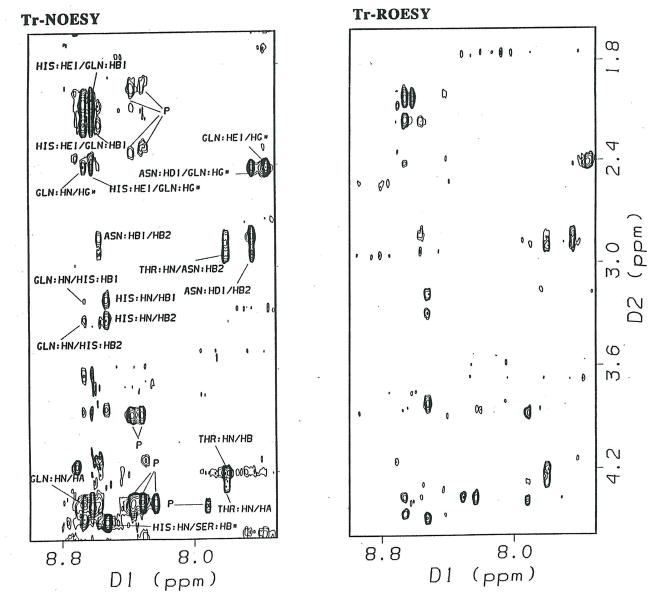
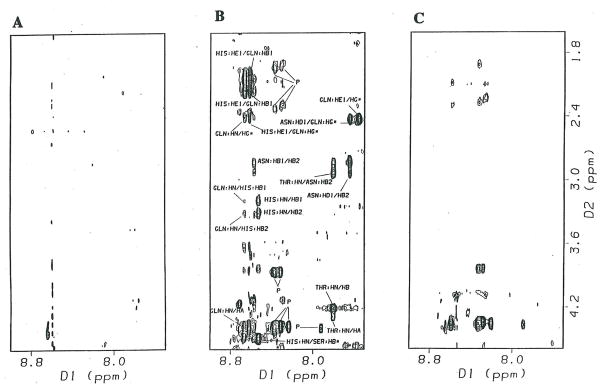
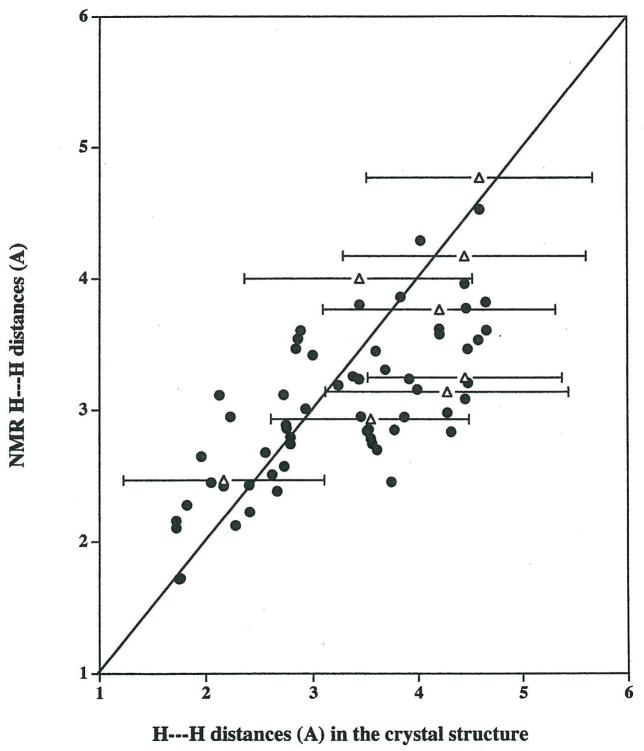
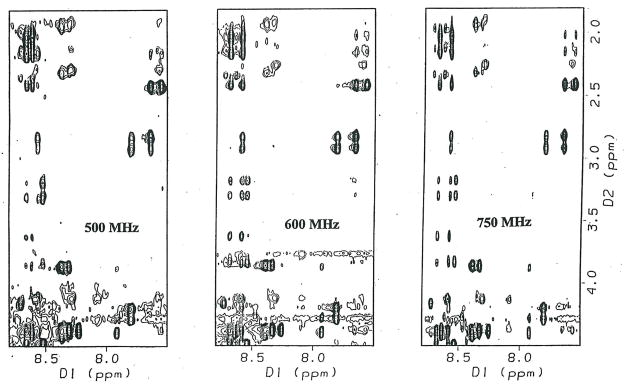
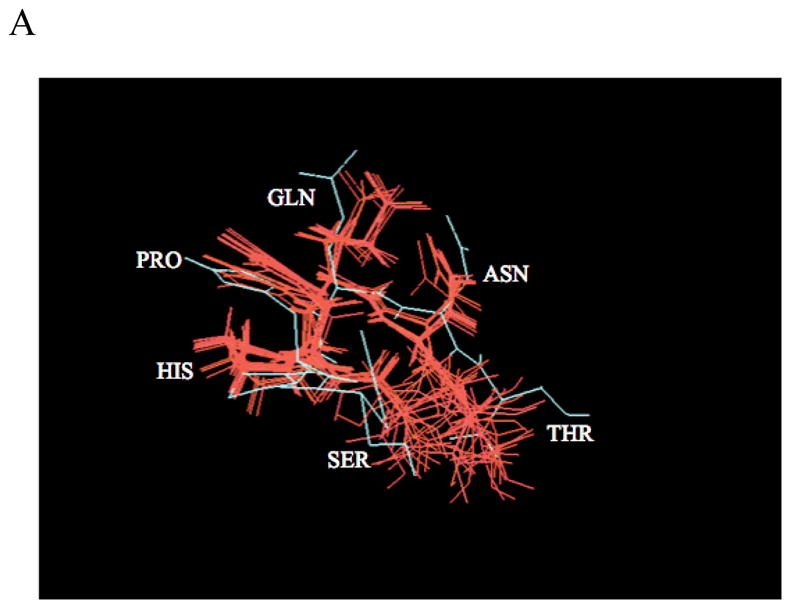
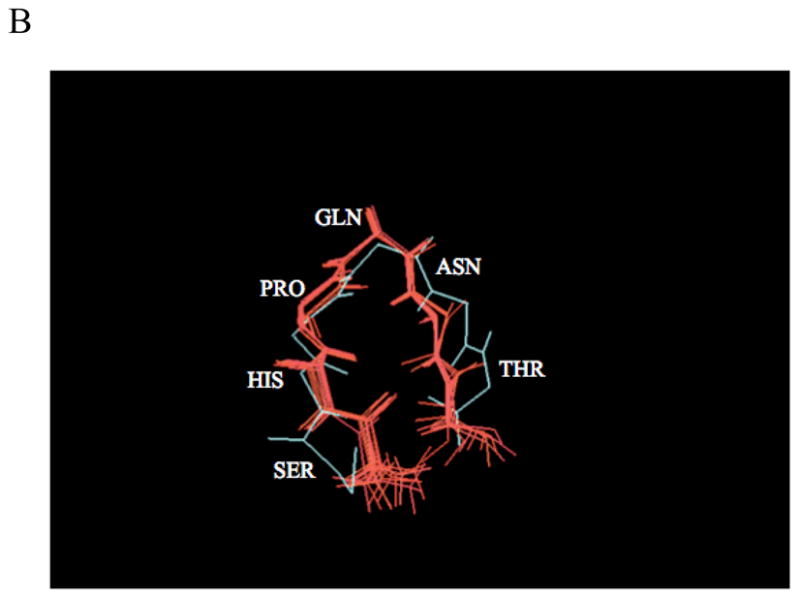
Protein-protein interactions control signaling, specific adhesion, and many other biological functions. The three-dimensional structures of the interfaces and bound ligand can be approached with transferred nuclear Overhauser effect spectroscopy NMR, which can be applied to much larger proteins than conventional NMR and requires less concentrated protein. However, it is not clear how accurately the structures of protein-bound peptides can be determined by transferred nuclear Overhauser effect spectroscopy. We studied the structure of a biotin mimetic peptide (FSHPQNT) bound to streptavidin, because the X-ray structure of the complex is available to 1.74 Å resolution, and we found that conditions could be adjusted so that the off-rates were fast enough for transferred nuclear Overhauser effect spectroscopy NMR. The off-rate was determined with (19)F NMR, using a para-fluoro-phenylalanine analog of the peptide. A new criterion for a lower limit on kinetic off-rate was found, which allowed accurate structure determination at a slower off-rate. Non-specific binding of the peptide to streptavidin was not significant, because biotin blocked the peptide transferred nuclear Overhauser effect spectroscopy. Protein mediation for the long-range peptide transferred nuclear Overhauser effect spectroscopy cross-peaks was corrected by a transferred nuclear Overhauser effect spectroscopy/ROESY averaging procedure. The protein-bound structure of the peptide was determined by transferred nuclear Overhauser effect spectroscopy constrained and simulated annealing. The structure deduced from the NMR was close to the X-ray structure.


Figures

Figure 1
Figure 1
19F NMR spectra of fluorine labeled FSHPQNT peptide bound to streptavidin at different temperatures were used for ligand off-rate analysis. (A) 19F NMR spectra of the CF3CO-FSHPQNT peptide bound to streptavidin as described in materials and methods at 278 K (lower curve) and 298 K (upper curve). The spectra have been calibrated so that the trifluoracetate reference signal is at 0.0 ppm. (B) Parafluoro-phe-SHPQNT peptide bound to streptavidin complex at pH 4.8 and different temperatures as described in materials and methods. The peak attributed to the cis-proline isomeric peptide was used as an internal standard and was set to 0.0 ppm at each temperature. The peak near 0.4 ppm is due to the peptide bound to streptavidin. The larger peak near −0.15 ppm is due to the free trans-proline peptide at the lowest temperatures and shows broadening and peak height changes as a function of temperature due to faster exchange at higher temperatures. (C) The peak height and width at half height of the major peak in B are plotted as a function of temperature from 298 to 320 K. The maximum width and minimum height occurred at 314 K where the kinetic off-rate equals the chemical shift splitting between the bound and free signals as explained in the text. (D) The effect of adding a two-fold excess of biotin relative to the concentration of streptavidin binding sites to the sample used to record the data in B. The lower pair of spectra show the effect of biotin addition at 278 K, the middle pair of spectra show the effect of biotin addition at 300 K and the upper pair of spectra show the effect of biotin addition at 314 K. In all cases the biotin releases all the peptide from the specific binding sites on streptavidin, removing the bound peaks at 278 and 300 K and sharpening the free peaks at 300 and 314 K.
Figure 1
Figure 1
19F NMR spectra of fluorine labeled FSHPQNT peptide bound to streptavidin at different temperatures were used for ligand off-rate analysis. (A) 19F NMR spectra of the CF3CO-FSHPQNT peptide bound to streptavidin as described in materials and methods at 278 K (lower curve) and 298 K (upper curve). The spectra have been calibrated so that the trifluoracetate reference signal is at 0.0 ppm. (B) Parafluoro-phe-SHPQNT peptide bound to streptavidin complex at pH 4.8 and different temperatures as described in materials and methods. The peak attributed to the cis-proline isomeric peptide was used as an internal standard and was set to 0.0 ppm at each temperature. The peak near 0.4 ppm is due to the peptide bound to streptavidin. The larger peak near −0.15 ppm is due to the free trans-proline peptide at the lowest temperatures and shows broadening and peak height changes as a function of temperature due to faster exchange at higher temperatures. (C) The peak height and width at half height of the major peak in B are plotted as a function of temperature from 298 to 320 K. The maximum width and minimum height occurred at 314 K where the kinetic off-rate equals the chemical shift splitting between the bound and free signals as explained in the text. (D) The effect of adding a two-fold excess of biotin relative to the concentration of streptavidin binding sites to the sample used to record the data in B. The lower pair of spectra show the effect of biotin addition at 278 K, the middle pair of spectra show the effect of biotin addition at 300 K and the upper pair of spectra show the effect of biotin addition at 314 K. In all cases the biotin releases all the peptide from the specific binding sites on streptavidin, removing the bound peaks at 278 and 300 K and sharpening the free peaks at 300 and 314 K.
Figure 2
Figure 2
Comparison of 2D Tr-NOESY and 2D ROESY NMR for the streptavidin bound FSHPQNT peptide (A) 2D Tr-NOESY NMR at 300 msec mixing time and (B) 2D ROESY NMR spectra at 150 msec mixing time at pH = 4.8 and 300 K. Many of the peaks are weaker or missing in the ROESY spectrum. Some of the missing peaks are due to sharp protein peaks and some of the weaker or missing peaks are due to peptide Tr-NOESY peaks that involve some protein proton mediation, as explained in the text.
Figure 3
Figure 3
All of the peptide Tr-NOESY signals are removed by the addition of biotin, which blocks the specific peptide binding sites. The remaining peaks after the addition of biotin are due to protein peaks that originate from relatively mobile regions of the protein. (A) spectrum of the free FSHPQNT peptide in the absence of streptavidin. (B) The Tr-NOESY spectrum of the FSHPQNT peptide observed upon the addition of streptavidin, where the fraction of the peptide bound is 0.27. Various peptide Tr-NOESY peaks are labeled as well as a few sharp protein peaks. (C) Tr-NOESY spectrum of the same sample as shown in B, but after the addition of a two fold excess of biotin over the concentration of streptavidin binding sites.
Figure 4
Figure 4
H---H distances in the FSHPQNT peptide bound to streptavidin derived from Tr-NOESY NMR as described in the text compared to the same distances measured from the 1.74 Å resolution x-ray crystal structure. The error bars for distances with Δ symbol indicate the uncertainties in some of the long range H---H distances derived from the x-ray structure based on the size of the crystallographic thermal B-factors.
Figure 5
Figure 5
Tr-NOESY spectra of the same sample of FSHPQNT-streptavidin at pH 4.8 and 300 K run for the same length of time at (A) 500 MHz, (B) 600 MHz and (C) 750 MHz The spectra were acquired under identical conditions, processed identically plotted at the same contour level.
Figure 6
Figure 6
Superimposed structures of SHPQNT derived from Tr-NOESY NMR and x-ray crystallography show good agreement. (A) Ten lowest energy structures of SHPQNT peptide bound to streptavidin calculated by simulated annealing using the Tr-NOESY-derived distance constraints (red) starting from randomized coordinates. The single structure in cyan is from the x-ray crystallography. (B) Backbone structures of SHPQNT derived from Tr-NOESY NMR (red) and x-ray crystallography (cyan) are shown. The rmsd between the crystal and NMR structures for the backbone of the four immobilized amino acids (HPQN) is 0.65 Å.
Figure 6
Figure 6
Superimposed structures of SHPQNT derived from Tr-NOESY NMR and x-ray crystallography show good agreement. (A) Ten lowest energy structures of SHPQNT peptide bound to streptavidin calculated by simulated annealing using the Tr-NOESY-derived distance constraints (red) starting from randomized coordinates. The single structure in cyan is from the x-ray crystallography. (B) Backbone structures of SHPQNT derived from Tr-NOESY NMR (red) and x-ray crystallography (cyan) are shown. The rmsd between the crystal and NMR structures for the backbone of the four immobilized amino acids (HPQN) is 0.65 Å.

Similar articles

Cited by

References

    1. Jones S, Thornton JM. Principles of protein-protein interactions. Proc Natl Acad Sci U S A. 1996;93:13–20. - PMC - PubMed
    1. Jones S, Thornton JM. Analysis of protein-protein interaction sites using surface patches. J Mol Biol. 1997;272:121–32. - PubMed
    1. Gizachew D, Moffett DB, Busse SC, Westler WM, Dratz EA, Teintze M. NMR studies on the conformation of the CD4 36–59 peptide bound to HIV-1 gp120. Biochemistry. 1998;37:10616–25. - PubMed
    1. Cortese R, Monaci P, Luzzago A, Santini C, Bartoli F, Cortese I, et al. Selection of biologically active peptides by phage display of random peptide libraries. Curr Opin Biotechnol. 1996;7:616–21. - PubMed
    1. Rarick HM, Artemyev NO, Mills JS, Skiba NP, Hamm HE. Specific peptide probes for G-protein interaction with effectors. Methods Enzymol. 1994;238:13–28. - PubMed

Publication types