. 2011 Feb 4:9:5.
doi: 10.1186/1477-5956-9-5.

Plasma peptidome profiling of acute hepatitis E patients by MALDI-TOF/TOF

Affiliations

Plasma peptidome profiling of acute hepatitis E patients by MALDI-TOF/TOF

Shikha Taneja et al. Proteome Sci. .

Abstract

Background: Hepatitis E is endemic to resource-poor regions, where it manifests as sporadic cases and large waterborne outbreaks. The disease severity ranges from acute self-limited hepatitis with low mortality to fulminant hepatic failure with high mortality. It is believed that the host response plays an important role in determining the progression and outcome of this disease. We profiled the plasma peptidome from hepatitis E patients to discover suitable biomarkers and understand disease pathogenesis.

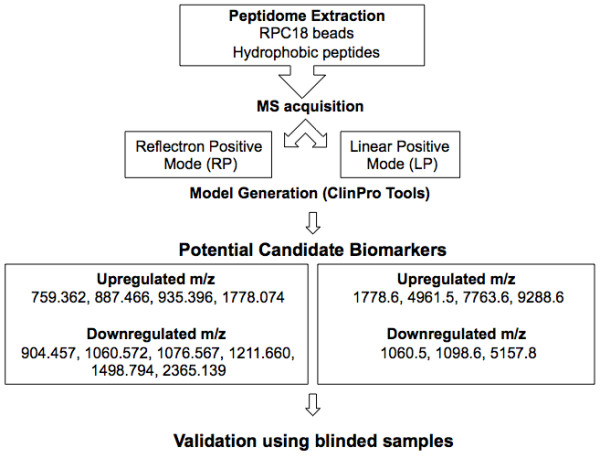
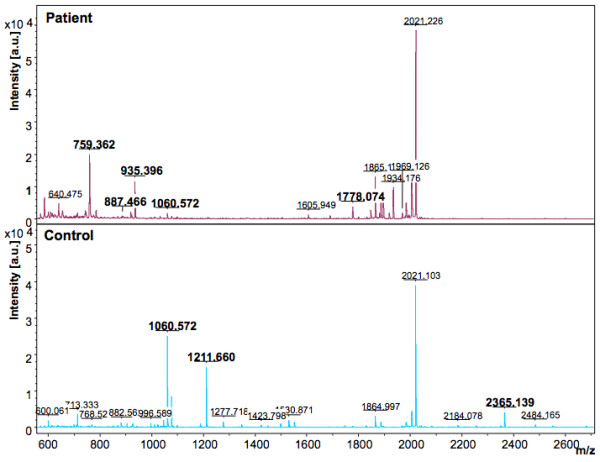
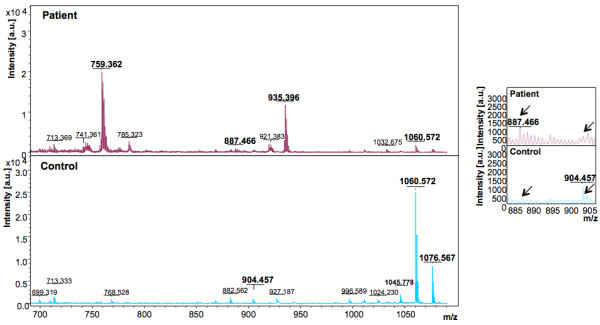
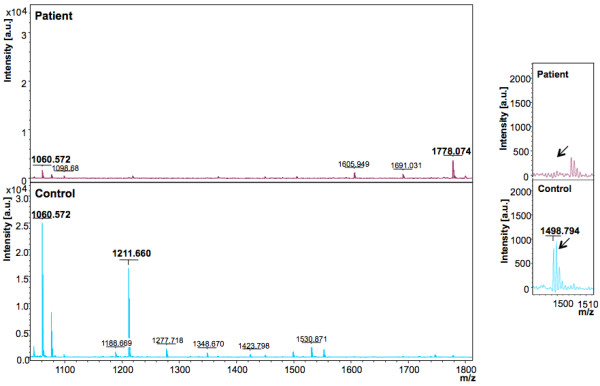
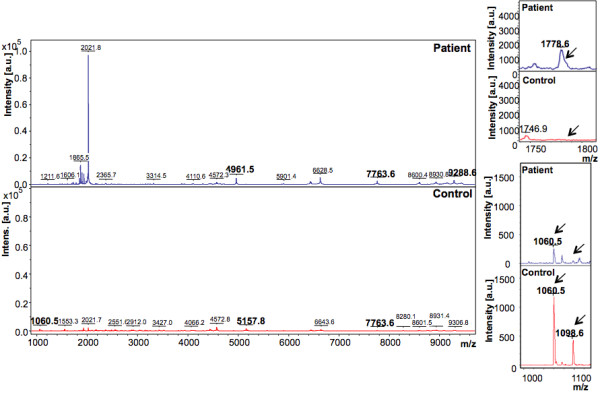
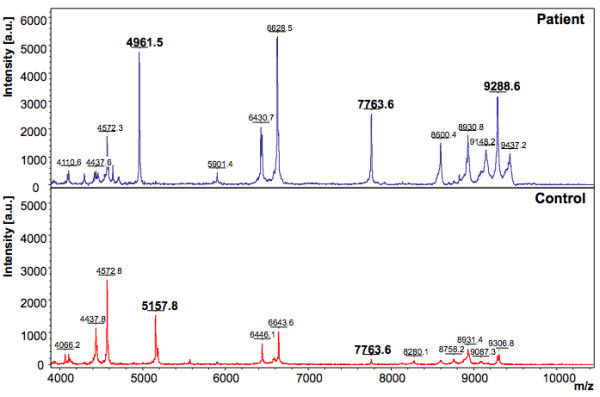
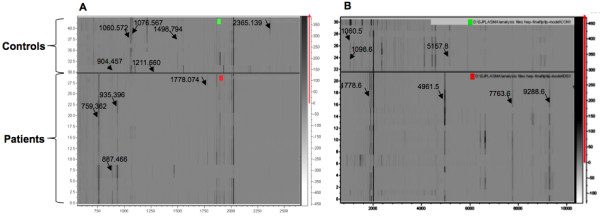
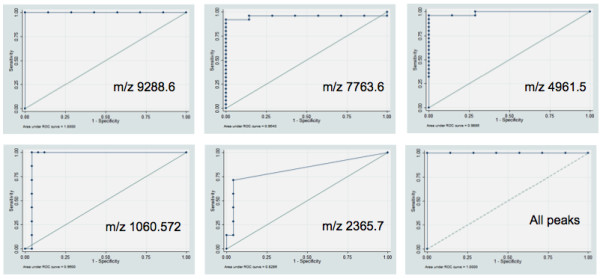
Results: The peptidome (< 10 kDa) fraction of plasma was enriched and analyzed by mass spectrometry. A comparative analysis of the peptide pattern of hepatitis E patients versus healthy controls was performed using ClinPro Tools. We generated a peptide profile that could be used for selective identification of hepatitis E cases. We have identified five potential biomarker peaks with m/z values of 9288.6, 7763.6, 4961.5, 1060.572 and 2365.139 that can be used to reliably differentiate between hepatitis E patients and controls with areas under the receiver operating characteristic curve (AUROC) values of 1.00, 0.954, 0.989, 0.960 and 0.829 respectively. A number of proteins involved in innate immunity were identified to be differentially present in the plasma of patients compared to healthy controls.

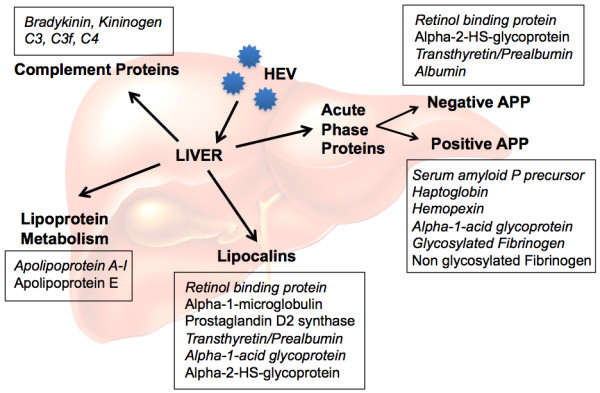
Conclusions: Besides the utility of this approach for biomarker discovery, identification of changes in endogenous peptides in hepatitis E patient plasma has increased our understanding of disease pathogenesis. We have identified peptides in plasma that can reliably distinguish hepatitis E patients from healthy controls. Results from this and an earlier proteomics study are discussed.


Figures

Figure 1
Figure 1
Schematic representation of peptidome enrichment and analysis. The methodology used for the enrichment and analysis of plasma peptides is shown. After enrichment of hydrophobic peptides using RPC-18 magnetic beads, the peptide fraction was subjected to mass spectrometry using two different acquisition modes. ClinPro Tools was used for model generation using pattern analysis of the peptide mass fingerprints of patients or controls and the differentiating peaks were identified using MS/MS. Following the discovery phase, different blinded samples were used for validation.
Figure 2
Figure 2
Representative mass spectra showing peaks in the Reflectron Positive (RP) mode. The upper and lower panels show peak patterns for representative plasma samples from HEV patients and healthy controls, respectively. Peaks that are upregulated or down regulated in patients and controls in the m/z range of 600 to 2600 are shown. The peaks are marked at their respective m/z values; numbers in bold indicate the discriminating peaks. Averaged mass spectra were generated by ClinPro Tools software (V2.0) using spectra showing the highest number of peaks and signal-to-noise ratios. All spectra were baseline-subtracted, smoothed, normalised and realigned.
Figure 3
Figure 3
Representative mass spectra showing peaks in the Reflectron Positive (RP) mode. The upper and lower panels show peak patterns for representative plasma samples from HEV patients and healthy controls, respectively. Peaks in the m/z range of 700 to 1100 are shown. The upper and lower panels show peak patterns for representative plasma samples from HEV patients and healthy controls, respectively. Averaged mass spectra were generated by ClinPro Tools software (V2.0) using spectra showing the highest number of peaks and signal-to-noise ratios. All spectra were baseline-subtracted, smoothed, normalised and realigned. Insets show discriminating peaks not readily apparent at the scale of the main figure.
Figure 4
Figure 4
Representative mass spectra showing peaks in the Reflectron Positive (RP) mode. The upper and lower panels show peak patterns for representative plasma samples from HEV patients and healthy controls, respectively. Peaks in the m/z range of 1050 to 1800 are shown. The upper and lower panels show peak patterns for representative plasma samples from HEV patients and healthy controls, respectively. Averaged mass spectra were generated by ClinPro Tools software (V2.0) using spectra showing the highest number of peaks and signal-to-noise ratios. All spectra were baseline-subtracted, smoothed, normalised and realigned. Insets show discriminating peaks not readily apparent at the scale of the main figure.
Figure 5
Figure 5
Representative mass spectra showing peaks in the Linear Positive (LP) mode. The upper and lower panels show peak patterns for representative plasma samples from HEV patients and healthy controls, respectively. Peaks that are upregulated or down regulated in patients and controls in the m/z range of 1000 to 10000 are shown. The peaks are marked at their respective m/z values; numbers in bold indicate the discriminating peaks. Averaged mass spectra were generated by ClinPro Tools software (V2.0) using spectra showing the highest number of peaks and signal-to-noise ratios. All spectra were baseline-subtracted, smoothed, normalised and realigned. Insets show discriminating peaks not readily apparent at the scale of the main figure.
Figure 6
Figure 6
Representative mass spectra showing peaks in the Linear Positive (LP) mode. The upper and lower panels show peak patterns for representative plasma samples from HEV patients and healthy controls, respectively. Peaks that are upregulated or down regulated in patients and controls in the m/z range of 4000 to 10000 are shown. The peaks are marked at their respective m/z values; numbers in bold indicate the discriminating peaks. Averaged mass spectra were generated by ClinPro Tools software (V2.0) using spectra showing the highest number of peaks and signal-to-noise ratios. All spectra were baseline-subtracted, smoothed, normalised and realigned.
Figure 7
Figure 7
Density Plot of the peptide profiles. Density plots (pseudo gel view) of the plasma peptide profiles of HEV patients and healthy controls are shown. Differentiating peaks that are identified using the (A) RP mode, and (B) LP mode are marked with arrows. Upper panels are the gel views of control samples and lower panels represent the patient samples. The MS profiles were generated by ClinPro Tools software (V2.0) and were baseline-subtracted, smoothed, and normalised.
Figure 8
Figure 8
Receiver Operator Characteristics Curve (ROC) for the discriminating peaks. The Area under the curve (AUROC) for peaks with m/z values indicated on the graphs is shown. These are 1.00 for m/z 9288.6 and 0.954 for m/z 7763.6 and 0.989 for m/z 4961.5. Peak m/z 1060.572 was identified as Bradykinin with an AUROC value of 0.960; peak m/z 2365.139 was identified as Kininogen with an AUROC value of 0.829. The AUROC value for all 5 peaks taken together is 1.0.
Figure 9
Figure 9
Differentially regulated proteins in HEV infected patients. An overview of the various pathways perturbed due to hepatitis E virus infection is presented. The plain and italicized texts indicate increased or decreased expression of the proteins, respectively, in patients compared to controls.

Similar articles

Cited by

References

    1. Khuroo MS, Kamili S, Jameel S. Vertical transmission of hepatitis E virus. Lancet. 1995;345:1025–1026. doi: 10.1016/S0140-6736(95)90761-0. - DOI - PubMed
    1. Kumar A, Beniwal M, Kar P, Sharma JB, Murthy NS. Hepatitis E in pregnancy. Int J Gynaecol Obstet. 2004;85:240–244. doi: 10.1016/j.ijgo.2003.11.018. - DOI - PubMed
    1. Jameel S. Molecular biology and pathogenesis of hepatitis E virus. Expert Rev Mol Med. 1999;1999:1–16. - PubMed
    1. Aggarwal R, Jameel S. Hepatitis E vaccine. Hepatol Int. 2008;2:308–315. doi: 10.1007/s12072-008-9071-4. - DOI - PMC - PubMed
    1. Aggarwal R, Naik S. Epidemiology of hepatitis E: current status. J Gastroenterol Hepatol. 2009;24:1484–1493. doi: 10.1111/j.1440-1746.2009.05933.x. - DOI - PubMed

LinkOut - more resources