. 2012;23(1-4):439-63.
doi: 10.1163/092050610X552221. Epub 2011 Jan 28.

Time controlled release of arabinofuranosylcytosine (Ara-C) from agarose hydrogels using layer-by-layer assembly: an in vitro study

Affiliations

Time controlled release of arabinofuranosylcytosine (Ara-C) from agarose hydrogels using layer-by-layer assembly: an in vitro study

Sumit Mehrotra et al. J Biomater Sci Polym Ed. 2012.

Abstract

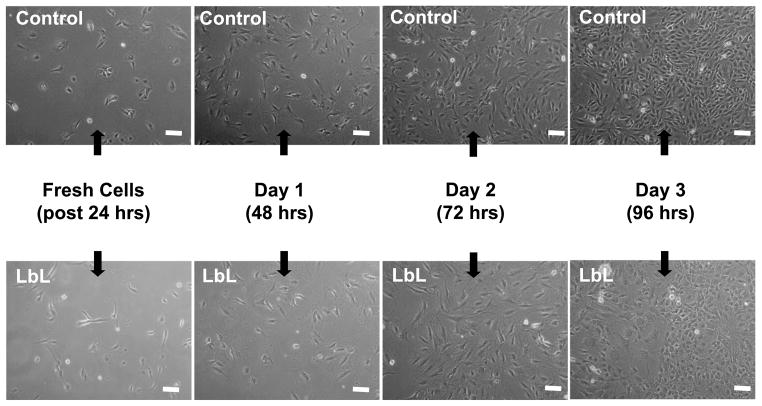
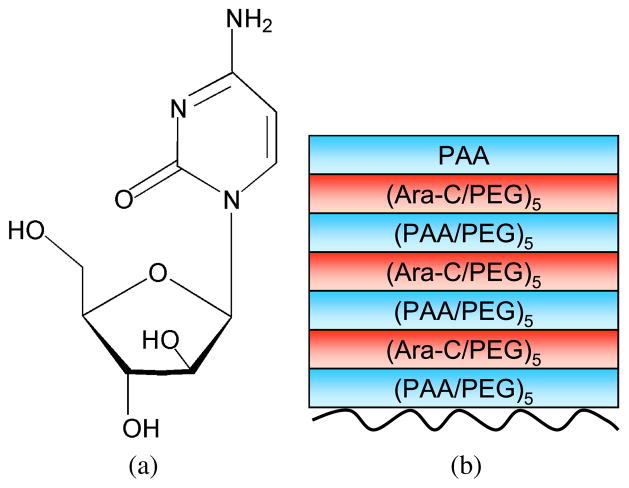
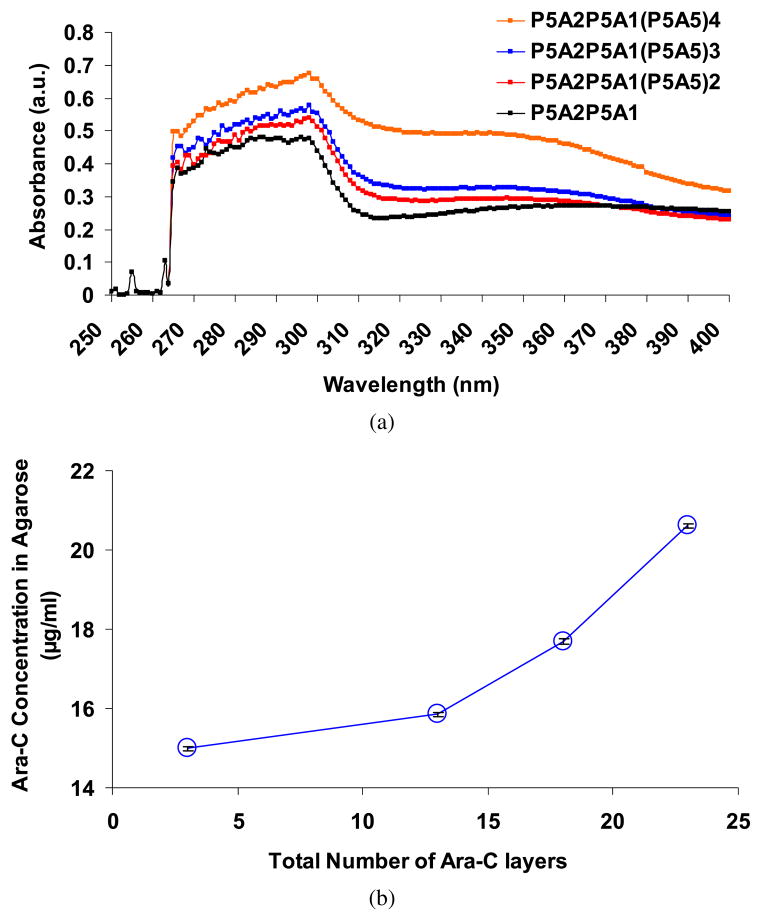
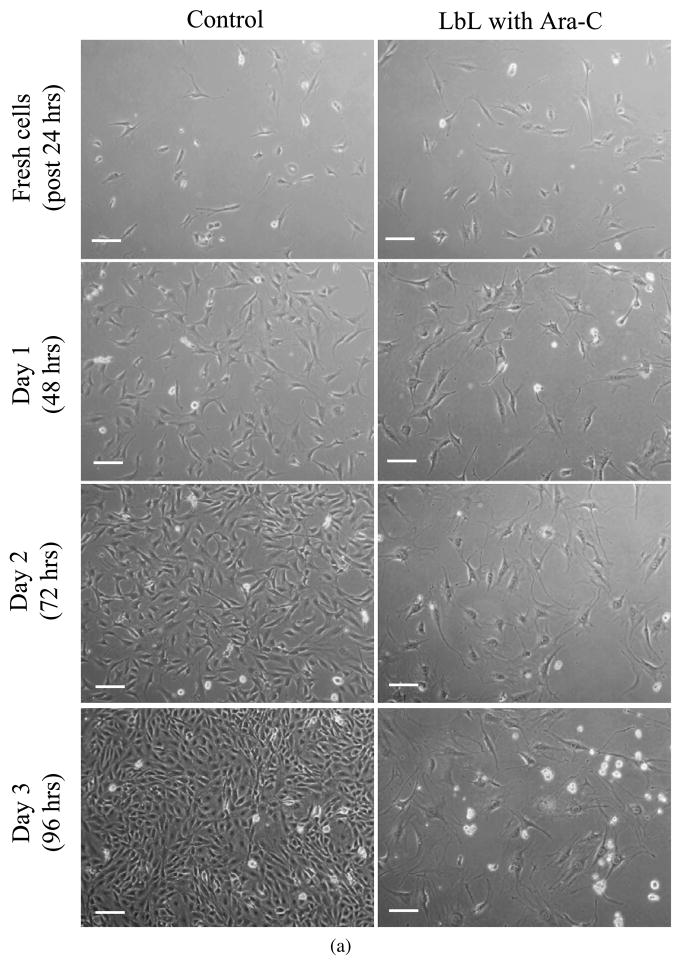
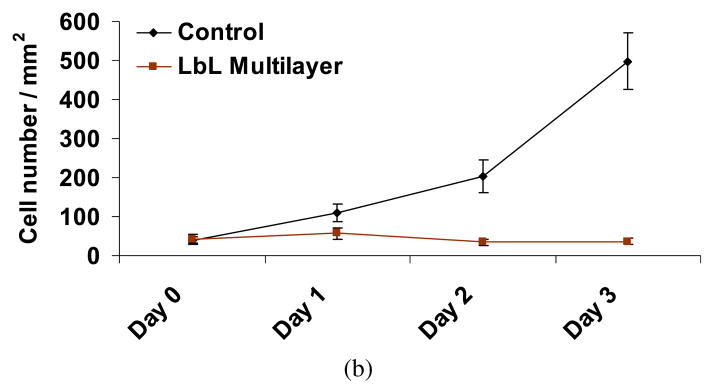
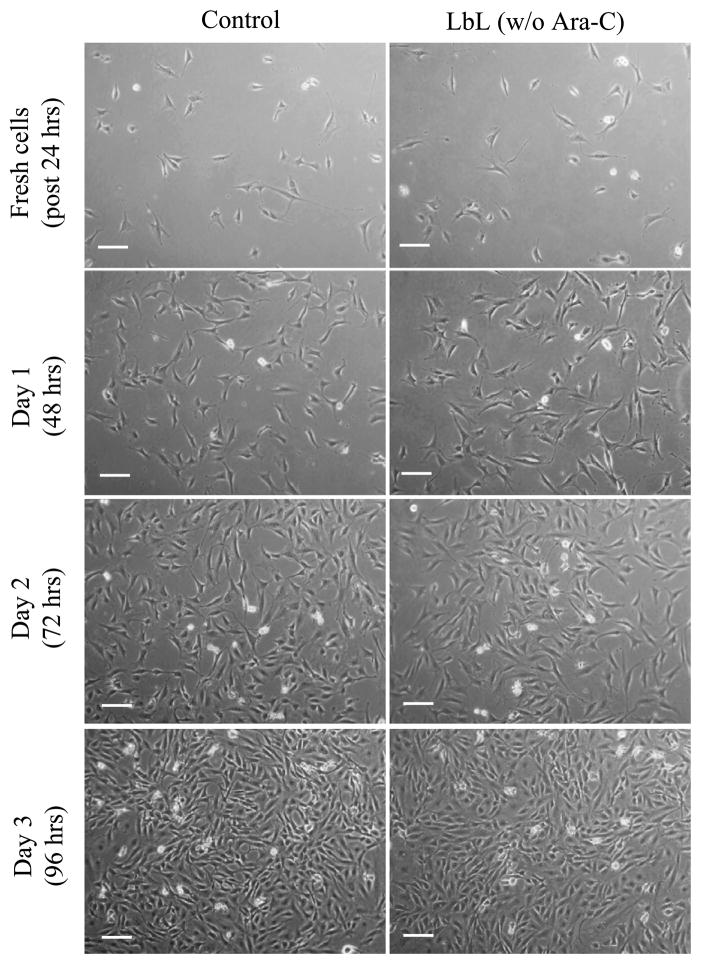
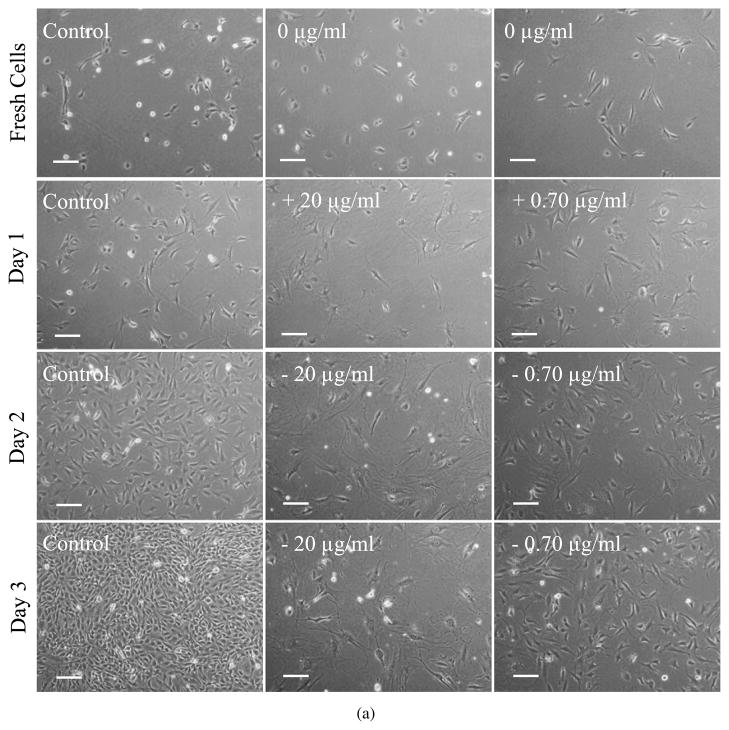
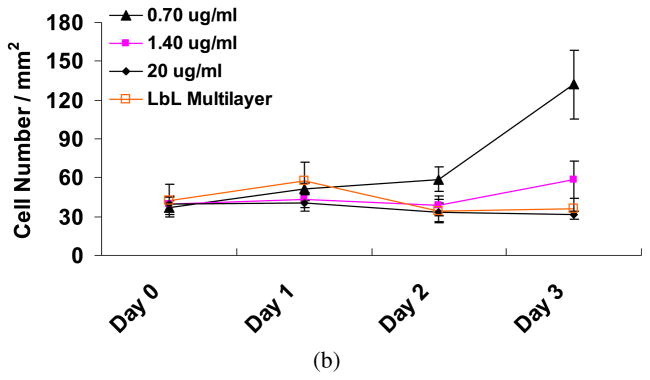
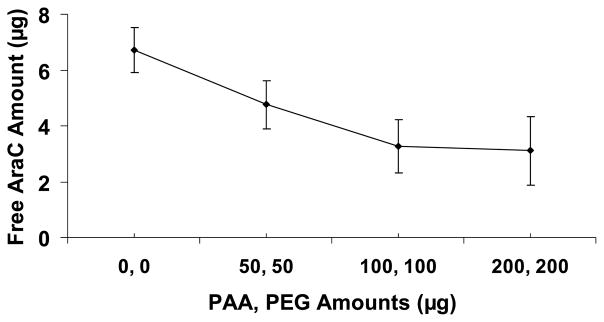
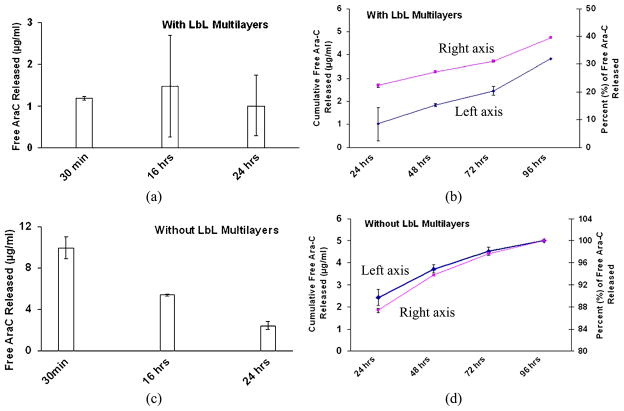
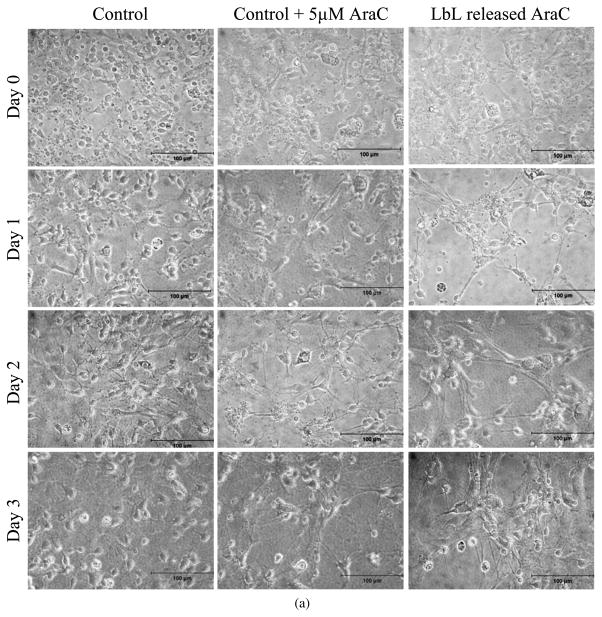
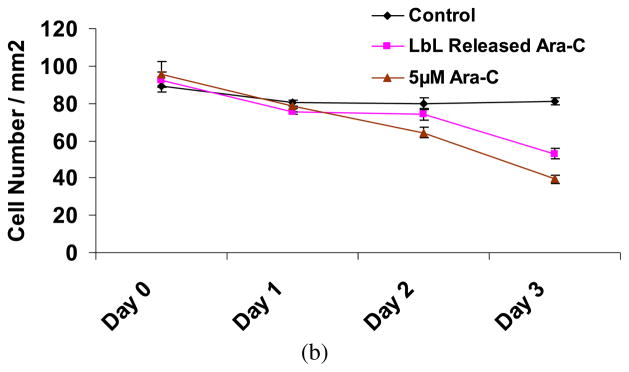
Experimentally induced axonal regeneration is compromised by glial scar formation arising from leptomeningeal fibroblasts cells in and around the hydrogel scaffold implanted for nerve repair. Strategies are needed to prevent such fibroblastic reactive cell layer formation for enhanced axonal regeneration. Here, we implement the technique of layer-by-layer assembled degradable, hydrogen bonded multilayers on agarose hydrogels to incorporate an anti-mitotic drug (1-β-D-arabinofuranosylcytosine (Ara-C)) within the agarose hydrogels. We show controlled release of Ara-C under physiological conditions over a period of days. The concentrations of Ara-C released from agarose at the different time points were sufficient to inhibit fibroblast growth in vitro, while not adversely affecting the viability of the neuronal cells.


Figures

Figure A1
Figure A1
UV-Vis spectrum of (a) PAA and PEG alone and (b) PAA and PEG mixture.
Figure A2
Figure A2
Fibroblasts cultured on a cover-slip in contact with LbL multilayer ([(PAA/PEG)5 (Ara-C/PEG)5]3PAA)-coated agarose 96 h after exposing LbL-coated agarose discs in cell-culture media, as described in Fig. 3. Fresh cells in contact with LbL-coated agarose discs after 96 h were monitored for another 3 days (indicated as Day 4 (120 h), Day 5 (144 h) and Day 6 (168 h)). Scale bar = 100 μm.
Figure A3
Figure A3
The effect on fibroblast growth after directly adding pure Ara-C. Varying concentrations of Ara-C were added once, for the first 24 h, and subsequently replaced with non-Ara-C containing media. The fibroblasts were monitored for up to 3 days. The effectiveness of the Ara-C decreased with concentration. Scale bar = 100 μm.
Figure A4
Figure A4
Primary cortical neurons in culture medium containing Ara-C released from LbL-multilayer-coated agarose are shown in the rightmost panels. Primary cortical neurons cultured in medium supplemented with 5 μM Ara-C, replaced every 24 h, are shown in the middle panels. Primary neurons cultured in regular cortical neuronal medium (without Ara-C), replaced every 24 h, are shown in the leftmost panels. Day 4 and Day 5 represent the time points subsequent to those shown in Fig. 8.
Figure A5
Figure A5
Fibroblasts cultured on a cover-slip in contact with LbL multilayer ([(PAA/PEG)5 (Ara-C/PEG)5]3PAA)-coated agarose, when the bulk concentration of Ara-C loading solution at the beginning of LbL formation was 500 μg/ml. Prior to exposure to the cells, the LbL-coated agarose discs were incubated in cell culture media (without any cells) for 24 h, with fresh culture medium replaced at 30 min, 16 and 24 h. Cells were monitored for 3 days (indicated as Day 1 (48 h), Day 2 (72 h) and Day 3 (96 h)). Scale bar = 100 μm. Time in parentheses denotes the time since the start of the multilayer degradation in culture media, where the initial 24 h of degradation was performed in the absence of cells. Controls are fibroblasts in contact with non-coated agarose.
Figure 1
Figure 1
(a) Chemical structure of 1-β-D-arabinofuranosylcytosine (Ara-C). (b) Multilayer assembly of PAA, PEG and Ara-C over agarose. The curved line represents the agarose. This figure is published in colour in the online edition of this journal, which can be accessed via http://www.brill.nl/jbs
Figure 2
Figure 2
(a) UV-Vis spectrum of agarose loaded with multilayers of (PAA/PEG)5 (AraC/PEG)2(PAA/PEG)5(Ara-C/PEG)[(PAA/PEG)5(Ara-C/PEG)5]n, where n represents the number of repetitions of the sequence [(PAA/PEG)5(Ara-C/PEG)5]. In the plot, P represents (PAA/PEG) and A represents (Ara-C/PEG) multilayers and the numeric value represents the number of replicates. P5A5P5A1 represents the base multilayer for each case in the UV-Vis measurements. (b) Plot of Ara-C concentration within agarose hydrogel after the LbL multilayer deposition as a function of total number of Ara-C layers according to the multilayer sequence shown in panel (a). This figure is published in colour in the online edition of this journal, which can be accessed via http://www.brill.nl/jbs
Figure 3
Figure 3
Fibroblasts cultured on a cover-slip in contact with LbL multilayer ([(PAA/PEG)5 (Ara-C/PEG)5]3PAA)-coated agarose. Prior to exposure to the cells, the LbL-coated agarose discs were incubated in cell culture media (without any cells) for 24 h, with fresh culture medium replaced at 30 min, 16 h and 24 h. (a) Cells were monitored for 3 days (indicated as Day 1 (48 h), Day 2 (72 h) and Day 3 (96 h)). Scale bar = 100 μm. Time in parentheses represents the age of the LbL-coated agarose, i.e., it denotes the time since the start of the multilayer degradation in culture media, where the initial 24 h of degradation was performed in the absence of cells. Controls are fibroblasts in contact with non-coated agarose. (b) The number of cells cultured on the covers-slips in contact with the LbL-multilayer-coated and non-coated agarose. Day 0 signifies fresh cells, i.e., just before placing the cells in contact with LbL-coated agarose. Student’s t -test (two-tailed) was used to evaluate the statistical significances: P < 0.00000004 at Day 1, Day 2 and Day 3 for cells exposed to LbL released Ara-C as compared to control. This figure is published in colour in the online edition of this journal, which can be accessed via http://www.brill.nl/jbs
Figure 3
Figure 3
Fibroblasts cultured on a cover-slip in contact with LbL multilayer ([(PAA/PEG)5 (Ara-C/PEG)5]3PAA)-coated agarose. Prior to exposure to the cells, the LbL-coated agarose discs were incubated in cell culture media (without any cells) for 24 h, with fresh culture medium replaced at 30 min, 16 h and 24 h. (a) Cells were monitored for 3 days (indicated as Day 1 (48 h), Day 2 (72 h) and Day 3 (96 h)). Scale bar = 100 μm. Time in parentheses represents the age of the LbL-coated agarose, i.e., it denotes the time since the start of the multilayer degradation in culture media, where the initial 24 h of degradation was performed in the absence of cells. Controls are fibroblasts in contact with non-coated agarose. (b) The number of cells cultured on the covers-slips in contact with the LbL-multilayer-coated and non-coated agarose. Day 0 signifies fresh cells, i.e., just before placing the cells in contact with LbL-coated agarose. Student’s t -test (two-tailed) was used to evaluate the statistical significances: P < 0.00000004 at Day 1, Day 2 and Day 3 for cells exposed to LbL released Ara-C as compared to control. This figure is published in colour in the online edition of this journal, which can be accessed via http://www.brill.nl/jbs
Figure 4
Figure 4
Fibroblasts cultured on a cover-slip in contact with LbL multilayer ((PAA/PEG)15.5)-coated agarose, without (w/o) Ara-C. Cells were monitored for 3 days (indicated as Day 1 (48 h), Day 2 (72 h) and Day 3 (96 h)). Scale bar = 100 μm. Time in parentheses represents the age of the LbL-coated agarose, i.e., it denotes the time since the start of multilayer degradation in culture media, where the initial 24 h of degradation was performed in the absence of cells (with no cells and media replaced at 30 min, 16 h and 24 h). Controls are fibroblasts in contact with non-coated agarose.
Figure 5
Figure 5
(a) The effect on fibroblast growth of directly adding pure Ara-C. Varying concentrations of Ara-C were added once, for the first 24 h and subsequently replaced with non-Ara-C containing media. The fibroblasts were monitored for up to 3 days. The effectiveness of the Ara-C decreased with concentration. Scale bar = 100 μm. (b) The number of cells as a function of time. Day 0 are fresh cells, i.e., just before adding the Ara-C to the cells. For comparison, growth rate of cells in contact with LbL-multilayer-coated agarose (Fig. 3b) is also plotted. The growth rate of the control cells (data not plotted) is similar to those plotted in Fig. 3b. Student’s t -test (two-tailed) was used to evaluate the statistical significances between the number of cells exposed to LbL-coated agarose and the number of cells in the direct Ara-C treatment. Day 1: P < 0.01 (0.7 μg/ml), P < 0.000003 (1.4 μg/ml) and P < 0.0000003 (20 μg/ml). Day 2: P < 0.000002 (0.7 μg/ml), P < 0.05 (1.4 μg/ml) and P < 0.5 (20 μg/ml). Day 3: P < 0.0000003 (0.7 μg/ml), P < 0.005 (1.4 μg/ml) and P < 0.001 (20 μg/ml). This figure is published in colour in the online edition of this journal, which can be accessed via http://www.brill.nl/jbs
Figure 5
Figure 5
(a) The effect on fibroblast growth of directly adding pure Ara-C. Varying concentrations of Ara-C were added once, for the first 24 h and subsequently replaced with non-Ara-C containing media. The fibroblasts were monitored for up to 3 days. The effectiveness of the Ara-C decreased with concentration. Scale bar = 100 μm. (b) The number of cells as a function of time. Day 0 are fresh cells, i.e., just before adding the Ara-C to the cells. For comparison, growth rate of cells in contact with LbL-multilayer-coated agarose (Fig. 3b) is also plotted. The growth rate of the control cells (data not plotted) is similar to those plotted in Fig. 3b. Student’s t -test (two-tailed) was used to evaluate the statistical significances between the number of cells exposed to LbL-coated agarose and the number of cells in the direct Ara-C treatment. Day 1: P < 0.01 (0.7 μg/ml), P < 0.000003 (1.4 μg/ml) and P < 0.0000003 (20 μg/ml). Day 2: P < 0.000002 (0.7 μg/ml), P < 0.05 (1.4 μg/ml) and P < 0.5 (20 μg/ml). Day 3: P < 0.0000003 (0.7 μg/ml), P < 0.005 (1.4 μg/ml) and P < 0.001 (20 μg/ml). This figure is published in colour in the online edition of this journal, which can be accessed via http://www.brill.nl/jbs
Figure 6
Figure 6
RP-HPLC measurements of the amount of free Ara-C in the solution mixtures of PAA, PEG and Ara-C as a function of increasing PAA and PEG amounts (no LbL). The x-axis indicates the amount of both PAA and PEG in the solution, e.g., (100, 100) μg on the x-axis indicates that 100 μg of PAA and 100 μg of PEG were added to the solution. Total amount of pure Ara-C added to each solution was 6.25 μg.
Figure 7
Figure 7
Non-cumulative and cumulative free Ara-C concentrations released from: (a, b) LbL-coated agarose and (c, d) non-coated Ara-C impregnated (soaked) agarose, both exposed to 1 × PBS at physiological pH. The cumulative concentrations are determined from 24 h onwards after the supernatant changes at 30 min and 16 h shown in panels (a) and (c). This figure is published in colour in the online edition of this journal, which can be accessed via http://www.brill.nl/jbs
Figure 8
Figure 8
(a) Primary cortical neurons, as shown in the rightmost column, in culture medium containing Ara-C released from LbL-multilayer-coated agarose. Day 0 represents the time point at which the medium containing LbL released Ara-C was first exposed to the cells. Cells were 2 days old in culture prior to time point Day 0. The middle column illustrates primary cortical neurons cultured in medium supplemented with 5 μM Ara-C starting at Day 0. The medium supplemented with Ara-C was subsequently replaced every 24 h. The leftmost column are primary neurons cultured in regular cortical neuronal medium (without Ara-C) for the duration of the experiment, replaced every 24 h. (b) The number of neurons cultured with media containing Ara-C released from the LbL-multilayer-coated agarose and replaced every 24 h, with media supplemented with 5 μM Ara-C and replaced every 24 h, and with regular neuronal media replaced every 24 h (control). Student’s t -test (two-tailed) was used to evaluate the statistical significances: P < 0.1 (Days 0 and 1), P < 0.01 (Day 2), P < 0.001 (Day 3) for LbL released Ara-C and 5 μM Ara-C as compared to control; P < 0.001 for LbL released Ara-C as compared to 5 μM Ara-C on Days 2 and 3. This figure is published in colour in the online edition of this journal, which can be accessed via http://www.brill.nl/jbs
Figure 8
Figure 8
(a) Primary cortical neurons, as shown in the rightmost column, in culture medium containing Ara-C released from LbL-multilayer-coated agarose. Day 0 represents the time point at which the medium containing LbL released Ara-C was first exposed to the cells. Cells were 2 days old in culture prior to time point Day 0. The middle column illustrates primary cortical neurons cultured in medium supplemented with 5 μM Ara-C starting at Day 0. The medium supplemented with Ara-C was subsequently replaced every 24 h. The leftmost column are primary neurons cultured in regular cortical neuronal medium (without Ara-C) for the duration of the experiment, replaced every 24 h. (b) The number of neurons cultured with media containing Ara-C released from the LbL-multilayer-coated agarose and replaced every 24 h, with media supplemented with 5 μM Ara-C and replaced every 24 h, and with regular neuronal media replaced every 24 h (control). Student’s t -test (two-tailed) was used to evaluate the statistical significances: P < 0.1 (Days 0 and 1), P < 0.01 (Day 2), P < 0.001 (Day 3) for LbL released Ara-C and 5 μM Ara-C as compared to control; P < 0.001 for LbL released Ara-C as compared to 5 μM Ara-C on Days 2 and 3. This figure is published in colour in the online edition of this journal, which can be accessed via http://www.brill.nl/jbs

Similar articles

Cited by

References

    1. Stokols S, Sakamoto J, Breckon C, Holt T, Weiss J, Tuszynski MH. Tissue Eng. 2006;12:2777. - PubMed
    1. Gros T, Sakamoto JS, Blesch A, Havton LA, Tuszynski MH. Biomaterials. 2010;31:6719. - PubMed
    1. Mehrotra S, Lynam D, Maloney R, Pawelec KM, Tuszynski MH, Lee I, Chan C, Sakamoto J. Adv Funct Mater. 2010;20:247. - PMC - PubMed
    1. Mehrotra S, Hunley SC, Pawelec KM, Zhang LX, Lee I, Baek S, Chan C. Langmuir. 2010;26:12794. - PMC - PubMed
    1. Capizzi RL. Invest New Drugs. 1996;14:249. - PubMed

Publication types

MeSH terms

LinkOut - more resources