. 2011 Feb 4;8(2):149-63.
doi: 10.1016/j.stem.2010.12.007.

Genetic predisposition directs breast cancer phenotype by dictating progenitor cell fate

Affiliations

Genetic predisposition directs breast cancer phenotype by dictating progenitor cell fate

Theresa A Proia et al. Cell Stem Cell. .

Abstract

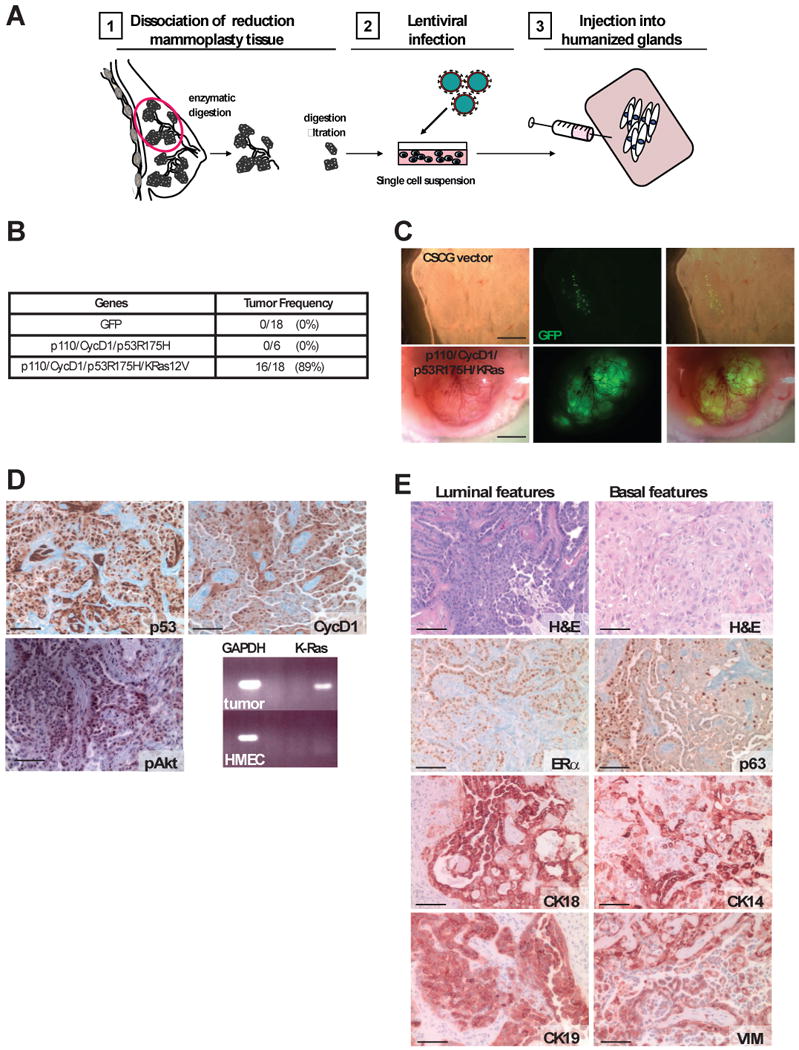
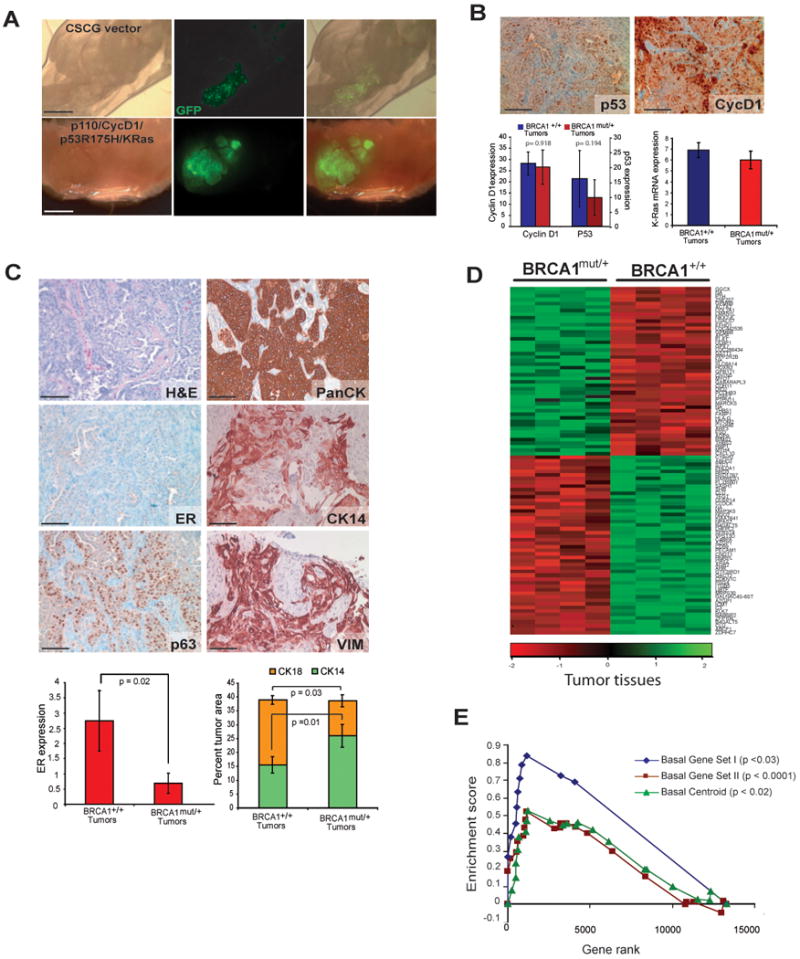
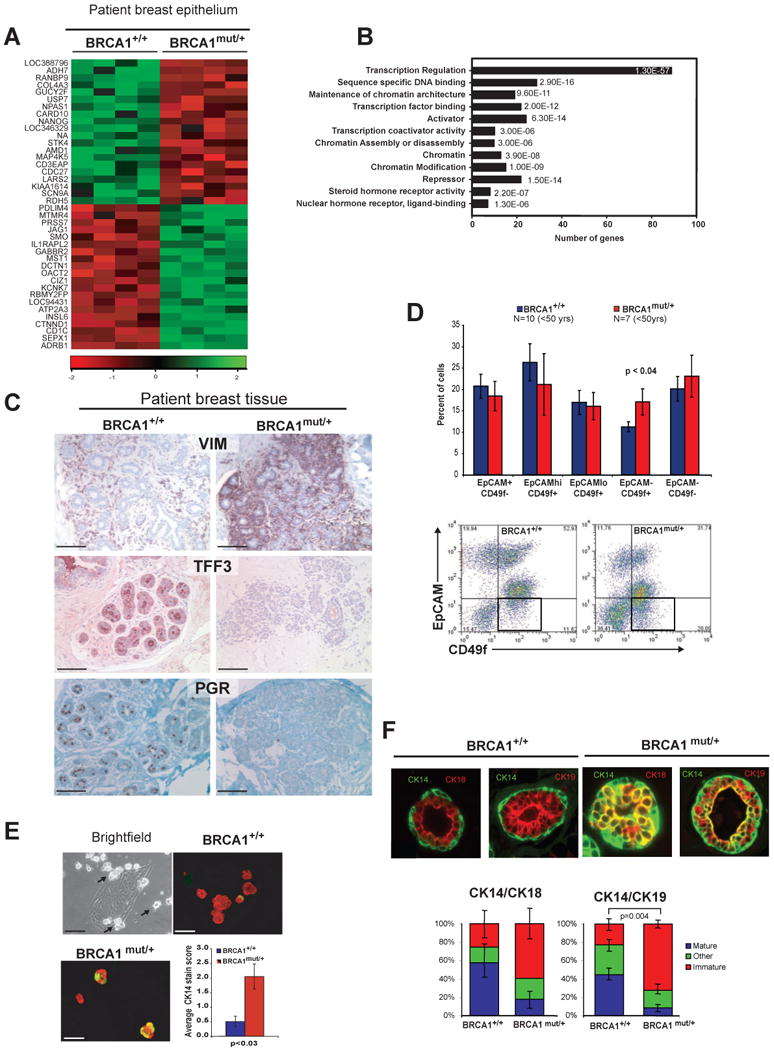
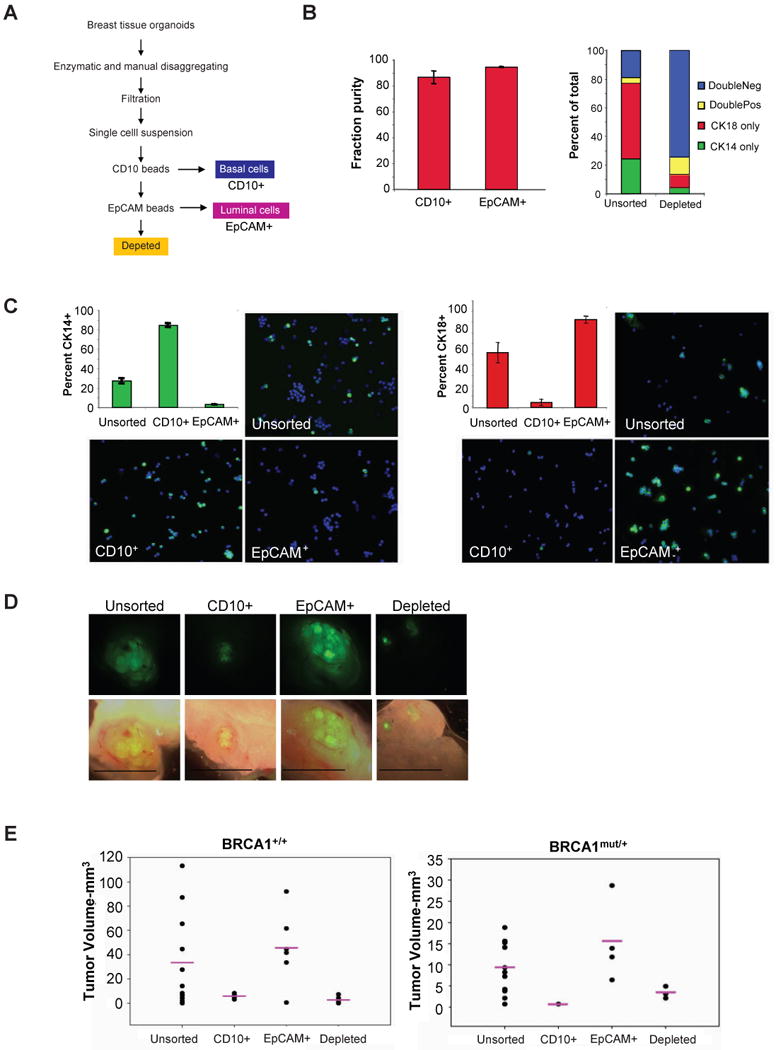
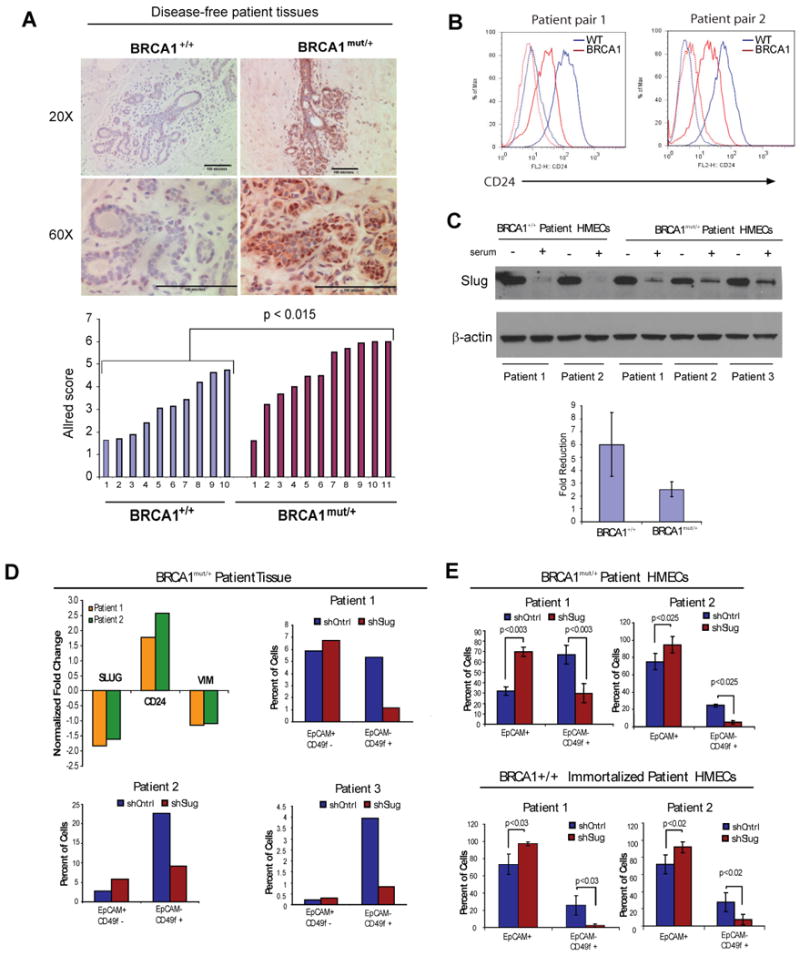
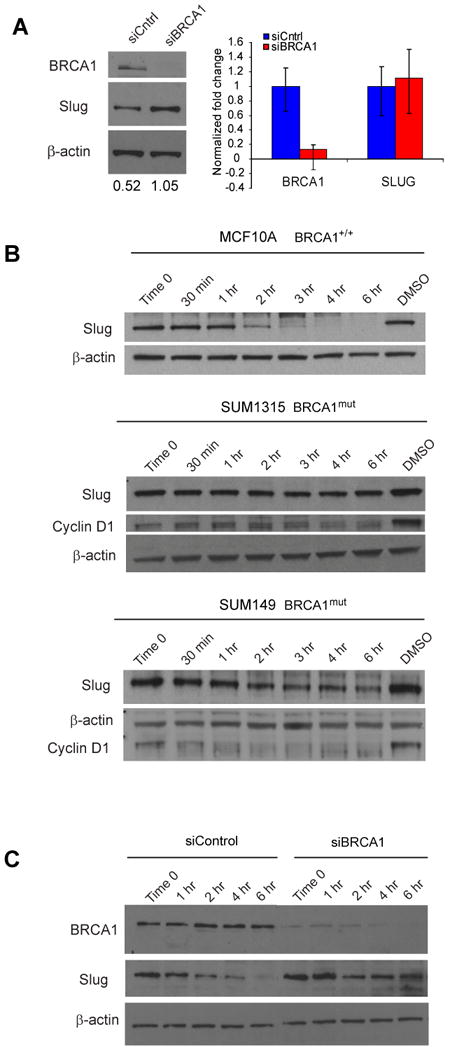
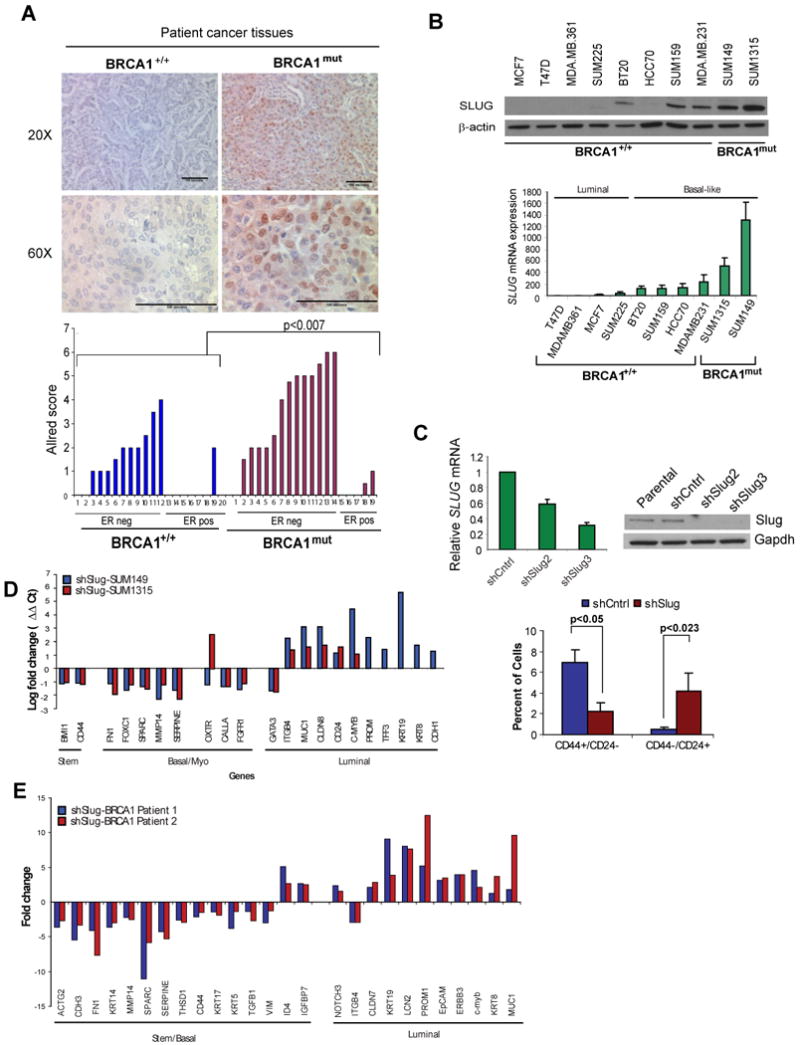
Women with inherited mutations in the BRCA1 gene have increased risk of developing breast cancer but also exhibit a predisposition for the development of aggressive basal-like breast tumors. We report here that breast epithelial cells derived from patients harboring deleterious mutations in BRCA1 (BRCA1(mut /+) give rise to tumors with increased basal differentiation relative to cells from BRCA1+/+ patients. Molecular analysis of disease-free breast tissues from BRCA1(mut /+) patients revealed defects in progenitor cell lineage commitment even before cancer incidence. Moreover, we discovered that the transcriptional repressor Slug is an important functional suppressor of human breast progenitor cell lineage commitment and differentiation and that it is aberrantly expressed in BRCA1(mut /+) tissues. Slug expression is necessary for increased basal-like phenotypes prior to and after neoplastic transformation. These findings demonstrate that the genetic background of patient populations, in addition to affecting incidence rates, significantly impacts progenitor cell fate commitment and, therefore, tumor phenotype.


Figures

Figure 1
Figure 1. Generation of human breast tumors in vivo
(A) Schematic depiction of the experimental strategy used to generate human breast tumors with limited ex-vivo culturing. (B,C) Tumor incidence table and GFP wholemount of unsorted breast epithelial cells infected with a GFP control virus or cells infected with the four oncogenes infected with GFP-containing viruses (constructs encoding K-ras and p53) (D) Immunoperoxidase staining of tumors for p53, cyclin D1, pAKT and express K-ras by RT-PCR (scale bar = 100 μm) (E) Tumor histopathology. Tumors generated from unsorted cells have a mixed phenotype, including areas that have characteristics of basal-type tumors including squamous appearance and immunoreactivity for cytokeratin 14 (CK14), vimentin (VIM) and p63, as well as areas of luminal phenotype that have a papillary growth pattern and reactivity for cytokeratins 8/18 (CK18), 19 (CK19) and estrogen receptor (ER) (scale bar = 100 μm). See also Figure S1.
Figure 2
Figure 2. Human breast tumors derived from BRCA1mut/+ epithelial cells exhibit enhanced features of basal differentiation
(A) Epithelial cells derived from morphologically normal prophylactic mastectomy tissues from BRCA1mut/+ carriers form tumors in mice after infection with p110/CycD1/ p53R175H/KRas lentiviruses (scale bar = 2mm). (B) Similar expression levels of p53, cyclin D1, pAKT and K-ras in BRCA1mut/+ and BRCA1+/+ tumors (scale bar = 100 μm). (C) BRCA1mut/+ tumor histopathology. Immunoperoxidase staining of tumors for breast epithelial characteristics (ER and pan cytokeratin) as well as basal-like tumor features (CK14, vimentin: VIM and p63) (scale bar = 100μm). (D) Heat map of hierarchical clustering of microarray data from tumors (n=4) arising from BRCA1+/+ epithelium and tumors (n=4) arising from BRCA1mut/+ epithelium. (scale bar = 100 μm) (E) GSEA analysis indicates the clustering is in part due to increased expression of genes associated with basal differentiation and with the basal-like breast cancer centroid. See also Tables S1, S2 and S3.
Figure 3
Figure 3. BRCA1mut/+ breast epithelial cells exhibit defects in lineage differentiation
(A) Heat map of hierarchical clustering of microarray data from epithelial cells isolated from BRCA1+/+ breast patient samples (N=4) and BRCA1mut/+ patient samples (N=4). (B) Gene ontology biological process categories associated with BRCA1mut/+ breast epithelial cells. The DAVID Functional Annotation Tool was used to define categories with an enrichment score >1.5; and the number of genes represented in the list and the p value of genes differentially expressed in the microarray are shown. (C) Immunoperoxidase staining of normal human breast tissue from BRCA1+/+ and BRCA1mut/+ carriers with luminal-specific trefoil factor 3 (TFF3) and progesterone receptor (PGR) and basal-specific vimentin (VIM) antibodies (scale bar = 100 μm). Immunohistochemistry for TFF3, PGR and VIM was performed on age matched BRCA1+/+ (N=13) and BRCA1mut/+ (N=10) disease-free breast tissues. Differences in staining were observed primarily in lobules, not ducts. (D) Freshly dissociated, uncultured epithelial cells from age matched (<50 yrs) BRCA1+/+ (N=10) and BRCA1mut/+ (N=7) patients were analyzed for EpCAM and CD49f expression by flow cytometry. Representative dot plots of a BRCA1+/+ or BRCA1mut/+ patient are shown. (E) Human breast epithelial cells produce small (∼30-50 μm) luminal suspension spheres when grown under adherent conditions (indicated by arrows). Cytospun spheres were stained for CK 8/18 (red) and 14 (green)(scale bar = 100 μm). CK14 content in spheres was scored as described in methods. At least 30 spheres were scored for each patient sample. The average scores from 3 BRCA1+/+ and BRCA1mut/+ patient samples are shown in the graph. Error bars are +/- SEM and p-values were calculated by two-tailed t-test. (F) Acinar structures from patient-derived BRCA1+/+ (N=4) and BRCA1mut/+ patient (N=4) cells infected with GFP lentivirus to visualize outgrowth and grown in the HIM model. Tissue outgrowths were double stained for CK14 and CK8/18 or CK19 (representative photos, top). The staining was characterized as mature (CK14+ basal/ME layer and CK8/18 and/or 19+ luminal layer), immature (CK14+ basal/ME layer and CK14 and CK8/19 and/or 19+ luminal layer) or other (CK14 only, CK8/18/19 only etc.). The average number of the 3 categories of structures are shown in the graph (n = ≥ 85 acini). Error bars are +/- SEM and p-values were calculated by two-tailed t-test. See also Figures S2 and S3 as well as Tables S4 and S5.
Figure 4
Figure 4. EpCAM+ luminal cells are able to recapitulate the tumor growth
(A) Flow chart describing sorting scheme. (B) Assessment of the purity of cells following magnetic bead sorting. Quantification of double staining for the luminal marker CK8/18 and the basal marker CK14 following sorting indicates that the sorting strategy depletes cells positive for these markers. Secondary antibody labeling of immunocomplexes on bead-released sorted cells indicates purity of the fractions. (C) CK14 immunofluorescence (IF) staining and quantification of sorted fractions indicates basal cell enrichment in the CD10+ fraction and depletion in the CD10-/EpCAM+ fraction. CK8/18 IF staining of sorted fractions indicates luminal cell depletion in the CD10+ fraction and enrichment in the CD10-/EpCAM+ fraction. (D, E) Sorted epithelial cell fractions infected with identical oncogenes differ in their ability to form tumors. GFP wholemount micrographs of tumor outgrowths of sorted and infected breast epithelial cells from the four different fractions. BRCA1+/+ tumor data is compiled from three separate experiments with two different patient samples. Unsorted (n=14), CD10+ (n=4), CD10-/EpCAM+ (n=6), Depleted (n=8). BRCA1mut/+ tumor data is compiled from two experiments with one patient sample. BRCA1mut/+ Unsorted (n=8), CD10+ (n=1), CD10-/EpCAM+ (n=4), Depleted (n=4).
Figure 5
Figure 5. Slug regulates breast epithelial differentiation and lineage commitment
(A) IHC staining of PM and RM tissues for Slug protein; staining was quantified by Allred scoring (see Supplemental Methods); two-tailed t-test used to derive p-value. (B) Flow cytometry analysis of CD24 expression in immortalized BRCA1+/+ and BRCA1mut/+ epithelial cells derived from 4 different patient tissues following serum-induced differentiation (C) Slug protein expression in immortalized BRCA1+/+ and BRCA1mut/+ epithelial cells derived from patient breast tissues following serum-induced differentiation. Quantification of fold reduction in Slug protein expression upon serum treatment from 3 different experiments (p=0.24). (D) Flow cytometry analysis of EpCAM and CD49f expression in patient-derived breast epithelial cells from breast tissues of 3 different BRCA1mut/+ patients following Slug knockdown. (E) Flow cytometry analysis of EpCAM and CD49f expression in patient-derived breast epithelial cells from immortalized BRCA1mut/+ epithelial cells derived from BRCA1mut/+ tissues following Slug knockdown. See also Figures S4 and S5.
Figure 6
Figure 6. BRCA1-mutation promotes increased Slug protein stability
(A) Loss of BRCA1 leads to increased Slug protein but not mRNA expression in MCF10A cells. QRT-PCR and Western blot analysis of BRCA1 and Slug expression in BRCA1+/+ MCF10A cells transfected with siBRCA1 or siControl. QRT-PCR data was normalized to GAPDH and to siControl. (B) BRCA1+/+ (MCF10A) and BRCA1mut (SUM1315, SUM149) cells were treated with cycloheximide (CHX) to prevent further protein synthesis at indicated time intervals. Western blot analysis demonstrates that Slug protein is highly unstable in MCF10A cells while it had a significantly longer half-life in SUM149 and SUM1315 cells. Cyclin D1 and Actin were used as controls. (C) BRCA1+/+ (MCF10A) were transfected with siBRCA1 or siControl and treated with cycloheximide (CHX) to prevent further protein synthesis at indicated time intervals. Western blot analysis demonstrates that Slug protein is turned over in siControl MCF10A cells while it remained expressed in siBRCA1 MCF10A cells. See also Figure S6.
Figure 7
Figure 7. Slug regulation of breast cancer phenotype in BRCA1-mutaion carriers
(A) Immunohistochemistry of Slug protein in breast carcinomas with known BRCA1-mutation status; two-tailed t-test used to derive p-values of Allred scores. (B) Western blot analysis of Slug and BRCA1 expression in breast cancer cell lines. SLUG mRNA levels were normalized to GAPDH and to BRCA1 levels in the cell lines. (C) SUM149 BRCA1mut breast cancer cells infected with lentiviruses targeting Slug (shSlug2 and shSlug3) or a scrambled sequence (shCntrl). Flow cytometry analysis of CD44 and CD24 expression in patient-derived SUM149 cell following Slug knockdown. (D) Quantitative RT-PCR array against a panel of 86 genes expressed in breast luminal, basal and stem cells was performed on SUM1315-shSlug and SUM149-shSlug and their respective scrambled controls. Genes differentially expressed in both cell lines in the shSlug cells compared to the scrambled controls are plotted. PROM, TFF3, KRT19, KRT8, and CDH1 genes are not expressed in SUM1315 cells. (E) BRCA1mut/+ epithelial cells infected with oncogenes in the presence of Slug knockdown leads to cells with features of luminal-like breast cancers. BRCA1mut/+ patient-derived breast epithelial cells were infected with lentiviruses encoding mutant p53, cyclin D1, and K-ras with shSlug or a scrambled sequence (shCntrl) and a quantitative RT-PCR array was performed. Genes differentially expressed >2-fold in both patient samples compared to the scrambled controls are plotted. See also Figure S7 and Table S6.

Comment in

References

    1. Allinen M, Beroukhim R, Cai L, Brennan C, Lahti-Domenici J, Huang H, Porter D, Hu M, Chin L, Richardson A, Schnitt S, Sellers WR, Polyak K. Molecular characterization of the tumor microenvironment in breast cancer. Cancer Cell. 2004;6:17–32. - PubMed
    1. Arnes JB, Brunet JS, Stefansson I, Begin LR, Wong N, Chappuis PO, Akslen LA, Foulkes WD. Placental cadherin and the basal epithelial phenotype of BRCA1-related breast cancer. Clin Cancer Res. 2005;11:4003–4011. - PubMed
    1. Burga LN, Tung NM, Troyan SL, Bostina M, Konstantinopoulos PA, Fountzilas H, Spentzos D, Miron A, Yassin YA, Lee BT, Wulf GM. Altered proliferation and differentiation properties of primary mammary epithelial cells from BRCA1 mutation carriers. Cancer Res. 2009;69:1273–1278. - PMC - PubMed
    1. Campbell IG, Russell SE, Choong DY, Montgomery KG, Ciavarella ML, Hooi CS, Cristiano BE, Pearson RB, Phillips WA. Mutation of the PIK3CA gene in ovarian and breast cancer. Cancer Res. 2004;64:7678–7681. - PubMed
    1. Clarke CL, Sandle J, Jones AA, Sofronis A, Patani NR, Lakhani SR. Mapping loss of heterozygosity in normal human breast cells from BRCA1/2 carriers. Br J Cancer. 2006;95:515–519. - PMC - PubMed

Publication types

MeSH terms

Substances

Associated data

LinkOut - more resources