. 2011 May 1;353(1):120-33.
doi: 10.1016/j.ydbio.2011.01.031. Epub 2011 Feb 3.

Lineage analysis of micromere 4d, a super-phylotypic cell for Lophotrochozoa, in the leech Helobdella and the sludgeworm Tubifex

Affiliations

Lineage analysis of micromere 4d, a super-phylotypic cell for Lophotrochozoa, in the leech Helobdella and the sludgeworm Tubifex

Stephanie E Gline et al. Dev Biol. .

Abstract

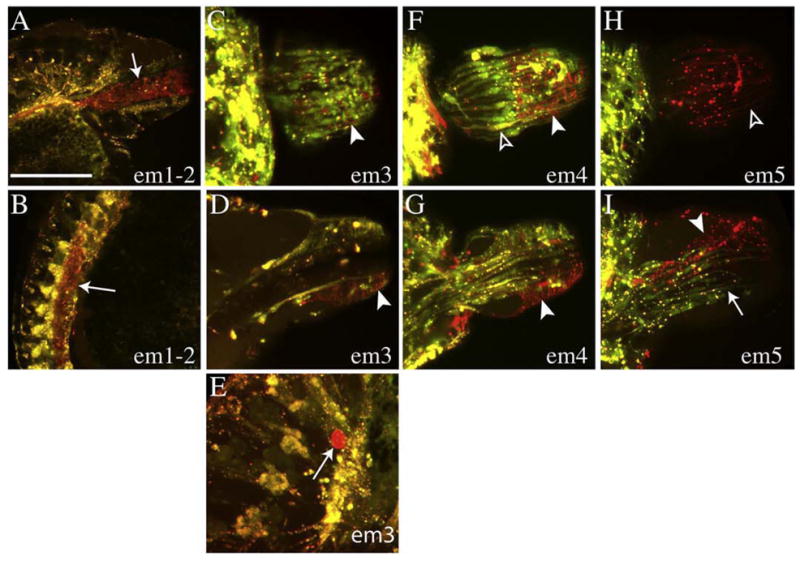
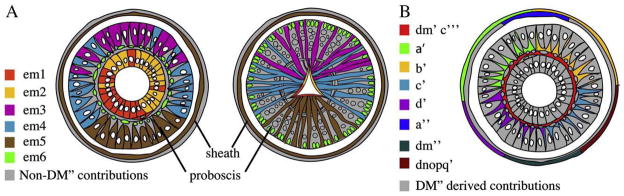
The super-phylum Lophotrochozoa contains the plurality of extant animal phyla and exhibits a corresponding diversity of adult body plans. Moreover, in contrast to Ecdysozoa and Deuterostomia, most lophotrochozoans exhibit a conserved pattern of stereotyped early divisions called spiral cleavage. In particular, bilateral mesoderm in most lophotrochozoan species arises from the progeny of micromere 4d, which is assumed to be homologous with a similar cell in the embryo of the ancestral lophotrochozoan, more than 650 million years ago. Thus, distinguishing the conserved and diversified features of cell fates in the 4d lineage among modern spiralians is required to understand how lophotrochozoan diversity has evolved by changes in developmental processes. Here we analyze cell fates for the early progeny of the bilateral daughters (M teloblasts) of micromere 4d in the leech Helobdella sp. Austin, a clitellate annelid. We show that the first six progeny of the M teloblasts (em1-em6) contribute five different sets of progeny to non-segmental mesoderm, mainly in the head and in the lining of the digestive tract. The latter feature, associated with cells em1 and em2 in Helobdella, is seen with the M teloblast lineage in a second clitellate species, the sludgeworm Tubifex tubifex and, on the basis of previously published work, in the initial progeny of the M teloblast homologs in molluscan species, suggesting that it may be an ancestral feature of lophotrochozoan development.


Figures

Fig. 1
Fig. 1
Mesoderm development in the leech Helobdella. A. Representations of selected developmental stages (animal pole views unless otherwise indicated; see text for details). B. Left: schematic showing the relationships of teloblasts, blast cells, bandlets, and germinal band on the right side of an early stage 8 embryo, corresponding to the boxed section in panel (A). Right: schematic showing an M teloblast and its descendant column of em and sm cells, roughly 34 h after the division of DM″; em1–3 are depicted with dashed outlines because the timing and orientation of their first mitoses are unknown; em4 (black outline) has not yet divided at this time, nor has em5 (blue), but em6 (red) and sm1 (yellow) have each undergone bilateral divisions; sm2 (green) is shown rounding up for mitosis while sm3 (turquoise) and sm4 (purple) have not yet divided. C. Left: distribution of em and sm clones across segments R1–R4 (color coded as in B; cells em1–em4 do not contribute to segmental mesoderm). Shown are ganglia R1–R4 (black contours): dashed line marks the midline; colored lines next to the midline indicate muscle cells within the nerve cord; colored circles indicate clusters of M-derived neurons; open boxes, partially obscured by the ganglia, depict hemi-somite boundaries. Right: schematic modified from (Weisblat and Huang, 2001) depicting the mesodermal progeny (elements of 3 sm clones) associated with a typical midbody segment; c.m., connective muscle, m.n., M-derived neurons, d.v.m. dorsoventral muscle, neph. nephridium, hatched lines represent body wall muscles. D. Six cells are born from each M teloblast prior to stage 6b. Durations (in minutes) of relevant developmental stages and M teloblast cell cycles, compiled from time-lapse movies of embryos (Supplemental Movie 1). Cell cycles and stage lengths were calculated and averaged from a total of 13 experiments. Anterior is up in this and all subsequent figures unless otherwise noted. (For interpretation of the references to color in this figure legend, the reader is referred to the web version of this article.)
Fig. 2
Fig. 2
M lineage during cleavage and segmentation. (A–E). Confocal images (maximally projected stacks) of embryos in which DM″ was injected with RDA (red) at stage 4b; injected embryos were fixed after the time intervals indicated (hours post-injection), then counterstained by immunofluorescence for histone H1 to label nuclei (green). For orientation, cell and/or embryos contours are indicated by dotted lines. A. Bilateral division of DM″ gives rise to teloblasts ML and MR. B. During interphase, nuclei of ML and MR remain close to the zone of contact between the two cells. C. As shown previously (Fernández and Stent, 1980), the first progeny of ML and MR (em1 cells) arise in direct apposition at the site of contact, so the distal (prospective anterior) ends of the m bandlets are connected at this time (arrowhead in C–E). D. The anterior contact between left and right m bandlets (arrowhead) is maintained as subsequent em cells are born. E. By 30 h post-injection, the columns of primary blast cells fromeach teloblast have lengthened and anterior cells havebegun to divide (open arrowheads; ML is not present in this stack of images). (F–H). Confocal images of older embryos in which DM″ was injected with RDA plus pEF-H2B:GFP or h2bgfp mRNA to specifically label M lineage nuclei (green). F. By 72 h post-injection, proliferation within sm blast cell clones has given rise to repeated clusters of cells (hemisomites; brackets). Anterior/distal to the hemisomites, the distribution of labeled cells is markedly different, including a population of dispersed “freckle cells” (e.g., arrow) between the left and right germinal bands and a large cell with a prominent nucleus at the anterior end of each germinal band (arrowheads). G. By 96 h post-injection, segmentation in the anterior M lineage is more obvious (brackets), freckle cells are scattered across the prospective dorsal side of the embryo (e.g., arrow) and there is still a large prominent cell at the anterior of each germinal band (arrowheads). H. Enlarged view of a sibling embryo, corresponding to the boxed area of (G) showing the large anterior cell (arrowhead) and freckle cells, one of which was dividing (arrow). Scale bar, 130 mm in A–E; 100 mm in F–G; 60 mm in H. (For interpretation of the references to color in this figure legend, the reader is referred to the web version of this article.)
Fig. 3
Fig. 3
Mesodermal and ectodermal lineages begin segmental blast cell production at approximately the same time. (A–E) Confocal images (maximally projected stacks) of embryos injected with RDA (red) into newborn ML teloblasts (stage 4c) and with FDA (green) into newborn OPL proteloblasts (stage 6b); embryos were fixed at the time intervals indicated (hours after the M injection). A. At 30 h post-injection, the columns of cells (arrows) arising from the M and OP lineages are not yet in contact. B. By 48 h post-injection the two columns of cells are roughly parallel, but the M teloblast derivatives extend well beyond the anterior extent of the OP lineage (dashed line in B–D). C. The mismatch between the anterior borders of the M and OP lineages persists as the freckle cells spread between the germinal bands. D. By stage 9, a lateral view (ventral to left) reveals many RDA-labeled cells in the prostomium anterior to the OP lineage. E. Confocal image of the germinal plate dissected from an embryo fixed 96 h post-injection shows extensive mesodermal progeny anterior to the OP lineage. F. A dissected germinal plate comparable to that shown in (E), but from an embryo in which the M teloblast and OP proteloblast were injected within minutes of one another, at the birth of OP (stage 6b). With this injection paradigm, the anterior M and OP boundaries fall within the same segment as shown here, or in adjacent segments (not shown). In this preparation, some RDA-labeled contractile fibers from the provisional integument (arrowhead) appear above the segmental derivatives, due to folding of the preparation during mounting. Scale bar, 60 mm in A–C; 80 mm in D–F. (For interpretation of the references to color in this figure legend, the reader is referred to the web version of this article.)
Fig. 4
Fig. 4
Lineage-specific distribution patterns of early em clones. Confocal images (maximum projections of stacks) of embryos in which timed tandem injections (see text for details) were performed to uniquely label the progeny of cells em1-6 or sm1 with RDA (red) and either h2bgfp mRNA or pEF-H2B:GFP (yellow green). Cells arising after the second injection also contain ADA (blue). Embryos were cultured for 48 (top row) or 72 (middle and bottom rows) h post-injection, then fixed and processed for microscopy. Bottom panel in each column shows close-up views of the uniquely labeled clones in the middle panel. The founder cell for each uniquely labeled clone is indicated above the column. In A′ and A″, note the similarity between the blue, em2-derived (arrowhead in A″) and red, em1-derived freckle cells. In E″, note cell debris (open arrowhead) suggestive of cell death in the em5 clone. In F′ and G′, note lateral expansion of hemisomites (brackets). See text for details. Scale bar, 60 mm in A–G; 100 mm in A′–G′; 25 mm in A″–G″.
Fig. 5
Fig. 5
Lineage-specific differences in proliferation within em clones. Cells in uniquely labeled clones from timed tandem injections as shown in Fig. 4 were counted. Standard deviations are indicated by error bars. Maximum clone sizes are indicated in red. Sample sizes are indicated below the bars. (For interpretation of the references to color in this figure legend, the reader is referred to the web version of this article.)
Fig. 6
Fig. 6
Lineage-specific distribution patterns of em clones at early stage 9. Confocal images (maximum projections of stacks, lateral views, ventral to left) of embryos in which timed tandem injections were used to uniquely label em (or sm) clones as in Fig. 4, except that in these experiments, FDA (yellow green) was used for the second injection, no nuclear label was used, and injected embryos were cultured to early stage 9, by which time the morphological differentiation of anterior tissues was underway. The top image in each column shows the complete stack of optical sections (arrows indicate the proboscis tip); images below include sections highlighting the uniquely labeled clone. A–C. em1 contributes progeny to the nascent proboscis in the medial portion of the prostomium (arrow in B); more posteriorly, em1 progeny (open arrowhead in C) lie superficial to the syncytial yolk cell, in a plane beneath the circumferential muscle fibers of the provisional integument (visible in A but not C); em2 makes similar contributions (closed arrowhead in C) and the uniquely labeled em2 clone is not included in this figure. D, E. em3 contributes a brightly labeled patch (arrow in E, suggesting that there have been few divisions in this sub-lineage), and presumptive muscle fibers within the proboscis (closed arrowhead in E). F–I. em4 contributes scattered cells in the prostomium (open arrowhead in G), musculature in the developing proboscis (arrow in H), and cells scattered among the circumferential muscle fibers of the provisional integument (arrow in I). J–M. em5 contributes muscle fibers to the presumptive proboscis sheath (bracket in K), muscle fibers to the presumptive proboscis (arrow in L), a cluster of neurons in ganglion R1 (closed arrowhead in L) and superficial cells among the circumferential muscle fibers of the provisional integument (arrow in M). N–P. em6 contributes longitudinal muscle fibers to the proboscis (arrow in O), a lateral patch of cells in segment R3 (open arrowhead in O and P), mesoderm surrounding the first coelomic cavity (asterisk in P) and a cluster of neurons in ganglion R2 (closed arrowhead in P). Q–S. An anterior sm clone contributes circumferential muscle fibers to the provisional integument (closed arrowhead in Q), a nephridial primoridum (open arrowhead in R), a cluster of neurons in the next posterior ganglion (closed arrowhead in R and S) and the mesoderm surrounding the coelom (asterisk in S). Scale bar, 180 mm in A, D, F, J, N, and Q; 50 mm in all other panels.
Fig. 7
Fig. 7
Definitive contributions of em lineages. Confocal images (maximal projections of stacks, lateral views) of embryos with uniquely labeled em clones as in Fig. 6, except that: 1) in some embryos the injections were timed so both em1 and em2 were labeled with RDA only and; 2) the injected embryos were cultured to late stage 9, by which time differentiation in anterior tissues is well advanced, although the proboscis is still in its everted configuration. A–B. em1 and em2 progeny line the lumen of the proboscis (arrow in A) and contribute to a layer of cells between the syncytial yolk cell and the germinal plate (arrow in B). C–D. lateral and medial optical sections, respectively, show that em3 contributes radial muscle fibers to lateral (arrowhead in C) and dorsal (arrowhead in D) sectors of the proboscis. E. em3 also gives rise to a brightly labeled clump of seemingly detached cells observed at various positions within the germinal plate lateral to segmental mesoderm (arrow). F–G. Lateral and medial optical sections, respectively show that em4 contributes radial muscle fibers to lateral (arrowhead in F) and dorsolateral (arrowhead in G) sectors of the proboscis, just beneath the musculature of the sheath (open arrowhead F). H–I. Lateral and medial optical sections, respectively, show that em5 gives rise to the majority of the musculature in the proboscis sheath (open arrowhead in H) and to radial muscle fibers in the ventral sector of the proboscis (arrowhead in I). Double-labeled longitudinal proboscis muscle fibers (arrow in I) are derived from em6 (not illustrated as a uniquely labeled clone). Scale bar, 25 mm in E; 50 mm in all other panels.
Fig. 8
Fig. 8
em1 and em2 derivatives line the foregut and midgut. Confocal images (maximum projections of stacks) from embryos in which the combined em1 and em2 clones from one M lineage were both labeled with RDA (red) by timed tandem injections. The injected embryos were cultured to stage 11, by which time the digestive tract was well-differentiated. A. By stage 11, the proboscis (p; foregut; dotted contour) has assumed its position within the anterior body; em1 and em2 progeny line both sides of the lumen. B, C. The crop (c; anterior midgut) and intestine (i; posterior midgut) have differentiated from the syncytial yolk cell; em1 and em2 contribute bilaterally to a population of cells lining both the crop (arrows B and C), and the intestine (open arrowheads C). Note that M progeny born after em1 and em2 (double labeled cells, yellow, presumably from sm clones) contribute visceral mesoderm (closed arrowhead) lying just outside the em1 and em2 progeny. Scale bar, 20 mm in A, B; 30 mm in C. (For interpretation of the references to color in this figure legend, the reader is referred to the web version of this article.)
Fig. 9
Fig. 9
The M lineage contributes to all layers of the proboscis and its sheath. Confocal images (maximum projections of stacks from thick sections) showing transverse views (dorsal up) of the proboscises of embryos in which cell DM″ (A–I, M–O) or ML (J–L) was injected with RDA (red); injected embryos were fixed at stage 9 (Oda-Ishii et al., 2005) or 10 (J–O), counterstained with DAPI (cyan), embedded and sectioned by hand. A–C. At the distal tip of the proboscis, muscle fibers from the sheath (open arrowheads in A–F) connect to the proboscis itself. At this stage, the inner ring comprising em1 and em2 derivatives (closed arrowheads in all panels), is a cylinder of columnar epithelium. D–F. A slightly more posterior section from the same specimen reveals the space (asterisk) between the proboscis (p) and its sheath (s). G–I. Further posterior, at the level of the supraesophageal ganglia (seg), presumptive longitudinal muscle fibers appear as a ring of puncta (small arrows in G–O) surrounding the inner ring. J–L. By mid-stage 10, the proboscis has retracted to within the body cavity and the tri-radiate organization of the lumen is evident. Radial muscles (large arrows in J–O) span from just within the longitudinal muscles at the outer edge of the proboscis to the inner ring and their large ovoid nuclei are shifting toward the outer edge. If the longitudinally oriented cells surrounding the inner ring at stage 9 (small arrows in G–I) are precursors of the peripheral longitudinal muscle fibers at stage 10 and beyond, they must migrate peripherally; candidates for such migrating cells are visible in this section (small arrows). M–O. By late stage 10, nuclei of the longitudinal and radial muscles are arranged in concentric rings near the outer surface of the proboscis. Cells of the inner ring constitute a thin layer lining the tri-radiate lumen. Scale bar, 25 mm. (For interpretation of the references to color in this figure legend, the reader is referred to the web version of this article.)
Fig. 10
Fig. 10
Embryonic origins of cells in the proboscis. Drawings depict transverse sections with dorsal up. A. Schematic showing contributions of em clones to the late stage 9 proboscis (left) and a hypothesis of how they relate to cells in the adult proboscis (right), based on the work presented here. In the adult proboscis (right), progeny of em1 and em 2 line the lumen, those of em3–5 comprise radial muscle fibers and those of em6 comprise longitudinal muscle fibers. In these lefthand drawings, grey outlines depict cells not arising from the M lineage, including presumptive nerves and salivary ductules running between the radial muscle fibers and a band of circumferential muscle fibers lying partway out along the radius. B. A schematic based on previously published work in another Helobdella species (Huang et al., 2002; Kang et al., 2003) shows contributions from other embryonic lineages accounting for the non-M-derived cells in the stage 9 proboscis.
Fig. 11
Fig. 11
Differential expression of hedgehog (Hau-hh) and tropomyosins (Hau-trop1, Hau-trop2) in the developing proboscis. Standard fluorescence (A) and confocal images (maximum projections of stacks; B–K) of embryos in which early ML teloblasts (stage 4c) were injected with FDA (green); injected embryos were fixed at stage 9–10, processed for fluorescent in situ hybridization (FISH, red), then examined in wholemount or as sections counterstained with DAPI (blue). A–D. FISH for Hau-hh. A. Lateral view; expression is predominantly in core of the proboscis (Kang et al., 2003). B. Saggital section through the proboscis shows that Hau-hh expression is strongest in cells of the inner ring (arrows), cells just outside the inner ring (open arrowheads) and cells in the epidermal layer at the tip of the proboscis sheath (closed arrowheads). C, D. Saggital and transverse views, respectively showing colocalization of lineage tracer and FISH product (yellow) confirm that Hau-hh positive cells are those of the inner ring, derived from em1 and em 2. E–H. FISH for Hau-tropo1. E. In stage 9 embryos, Hau-tropo1 is expressed in the M-derived provisional circumferential muscle fibers of the integument (arrows) and in segmental muscle cells of anterior, more differentiated segments (closed arrowheads), but not in the posterior segmental mesoderm (open arrowheads) where segmental muscles have not yet differentiated. F–H. Saggital and transverse sections (as in B–D) show that Hau-trop1 is expressed in muscles of the proboscis sheath (closed arrowheads), and in cells just outside the inner ring (open arrowheads), but not in the inner ring (arrows). I–K. In contrast to Hau-trop1, Hau-trop2 is expressed throughout the inner ring of em1 and em 2-derived cells (arrows). Scale bar, 125 mm in A, E; 40 mm in all other panels. (For interpretation of the references to color in this figure legend, the reader is referred to the web version of this article.)
Fig. 12
Fig. 12
Ontogeny of 4d lineage in Tubifex. Confocal images (maximum projections of stacks) of Tubifex embryos fixed 24–144 h after cell 4d was injected with RDA (red). A, B. Animal views. All others are lateral views (ventral to left). A. 24 h post-injection, ML and MR are visible (arrows); the nascent columns of blast cells are not in contact at their distal ends (arrowheads). B. 48 h post-injection, left and right germinal bands are visible, still without contact at their distal ends (arrowheads). C–E, C′–E′. During the period 72–120 h post-injection, a single large 4d-derived cell is evident on each side (arrowheads C′–E′), reminiscent of the large, em3-derived cells in Helobdella. C′–E′. Higher power views of the boxed regions in C–E, respectively, show that this large cell appears to form a long process with profuse, fine lateral branches extending posteriorly in dorsolateral territory (closed arrowheads in C′–E′). This cell appears to mark the edge of the dorsally expanding germinal plate. F. By 144 h post-injection, primordial germ cells are visible as three bright clusters of RDA-containing cells (arrows). F′. Magnified view of the anterior end shows that, as in Helobdella, the 4d lineage has contributed muscle cells (open arrowhead) anterior to the mouth, and cells lining the mouth opening (arrow). Scale bar, 150 mm in A, B; 200 mm in C–E; 320 mm in F; 60 mm in C′–F′. (For interpretation of the references to color in this figure legend, the reader is referred to the web version of this article.)

References

    1. Ackermann C, Dorresteijn A, Fischer A. Clonal domains in postlarval Platynereis dumerilii (Annelida: Polychaeta) J Morphol. 2005;266:258–280. - PubMed
    1. Anderson DT. Embryology and Phylogeny in Annelids and Arthropods. Pergamon; Oxford: 1973.
    1. Astrow S, Holton B, Weisblat DA. Centrifugation redistributes factors determining cleavage patterns in leech embryos. Dev Biol. 1987;120:270–283. - PubMed
    1. Bissen ST, Weisblat DA. The durations and compositions of cell cycles in embryos of the leech, Helobdella triserialis. Development. 1989;106:105–118. - PubMed
    1. Bouche M, Biagianti-Risbourge S, Vernet G. A light and scanning electron microscope study of the morphology of the chaetae of Tubifex tubifex in a non-polluted medium. Hydrobiologia. 1997;411:39–44.

Publication types

LinkOut - more resources