. 2011 Apr 8;407(4):521-31.
doi: 10.1016/j.jmb.2011.01.052. Epub 2011 Feb 3.

Multiple barriers to recombination between divergent HIV-1 variants revealed by a dual-marker recombination assay

Affiliations

Multiple barriers to recombination between divergent HIV-1 variants revealed by a dual-marker recombination assay

Olga A Nikolaitchik et al. J Mol Biol. .

Abstract

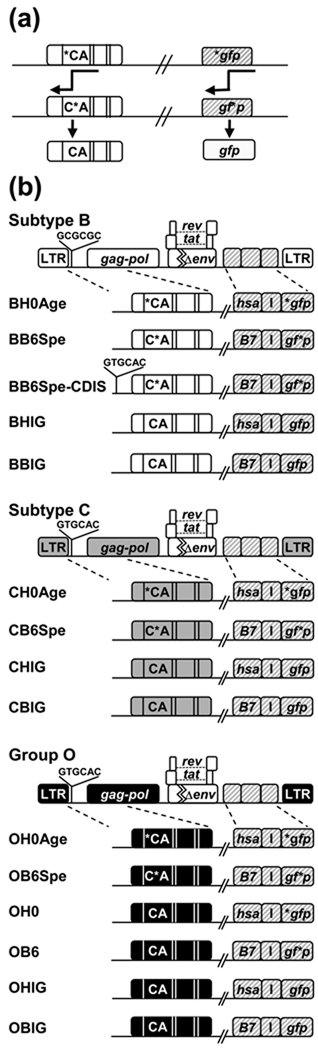
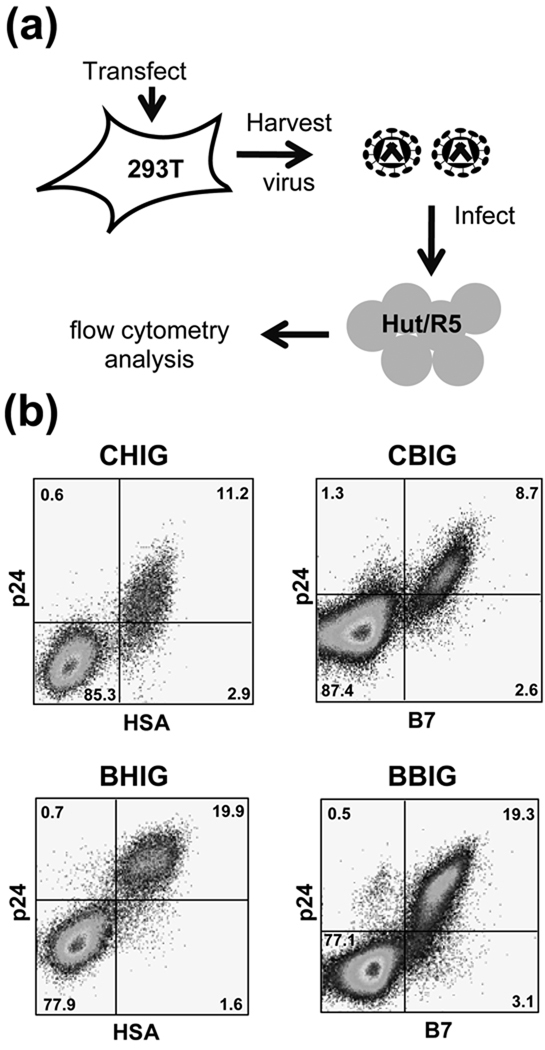
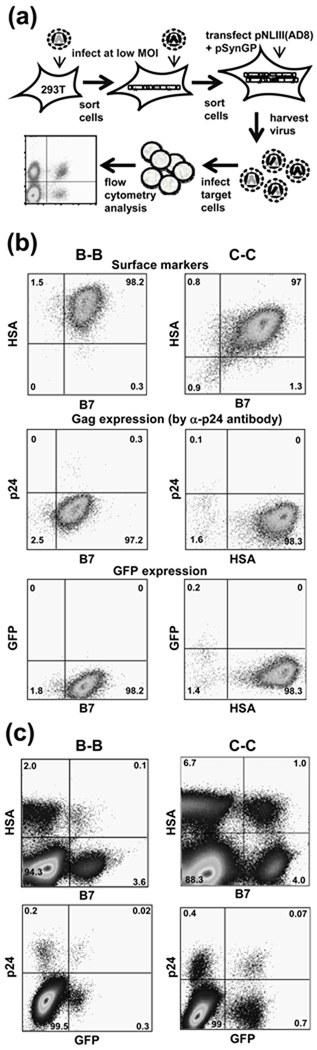
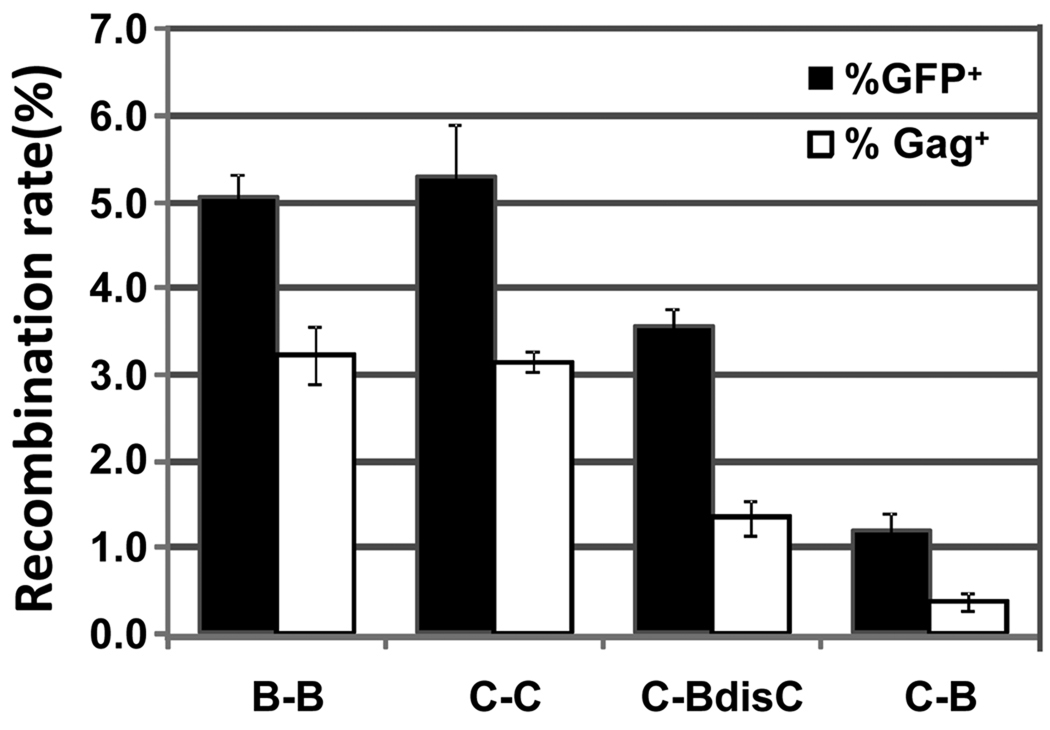
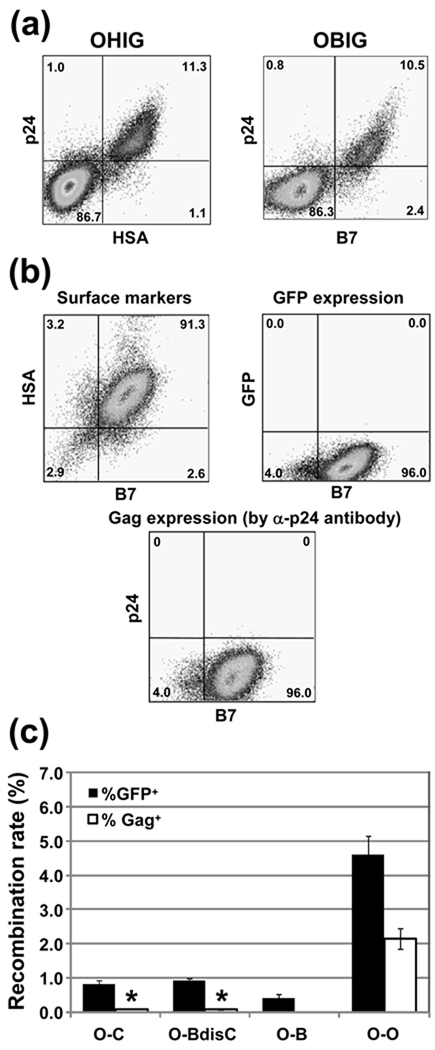
Recombination is a major force for generating human immunodeficiency virus type 1 (HIV-1) diversity and produces numerous recombinants circulating in the human population. We previously established a cell-based system using green fluorescent protein gene (gfp) as a reporter to study the mechanisms of HIV-1 recombination. We now report an improved system capable of detecting recombination using authentic viral sequences. Frameshift mutations were introduced into the gag gene so that parental viruses do not express full-length Gag; however, recombination can generate a progeny virus that expresses a functional Gag. We demonstrate that this Gag reconstitution assay can be used to detect recombination between two group M HIV-1 variants of the same or of different subtypes. Using both gfp and gag assays, we found that, similar to group M viruses, group O viruses also recombine frequently. When recombination between a group M virus and a group O virus was examined, we found three distinct barriers for intergroup recombination. First, similar to recombination within group M viruses, intergroup recombination is affected by the identity of the dimerization initiation signal (DIS); variants with the same DIS recombined at a higher rate than those with different DIS. Second, using the gfp recombination assay, we showed that intergroup recombination occurs much less frequently than intragroup recombination, even though the gfp target sequence is identical in all viruses. Finally, Gag reconstitution between variants from different groups is further reduced compared with green fluorescent protein, indicating that sequence divergence interferes with recombination efficiency in the gag gene. Compared with identical sequences, we estimate that recombination rates are reduced by 3-fold and by 10- to 13-fold when the target regions in gag contain 91% and 72-73% sequence identities, respectively. These results show that there are at least three distinct mechanisms preventing exchange of genetic information between divergent HIV-1 variants from different groups.


Figures

Fig. 1
Fig. 1. Experimental strategy and HIV-1 vectors used in the recombination assays
(a) Schematic representation of recombination in gfp and gag genes. Template switching between inactivating mutations within a gene can generate a recombinant expressing functional GFP and / or Gag containing the CA domain. Slanted double lines indicate parts omitted for simplicity. Direction of DNA synthesis is indicated by arrows. (b) General structures of vectors used in this study. All vectors express functional Tat and Rev and carry a deletion in the env gene. White, grey, and black boxes represent subtype B, C, and group O sequences, respectively. Striped boxes indicate marker genes inserted in the nef reading frame. Asterisk denotes inactivating mutation. DIS sequences, GCGCGC or GTGCAC, are indicated. The name of each construct is descriptive of its structure: the first letter refers to the group or subtype of the viral sequence; the second letter indicates the surface marker gene (H is for hsa and B is for B7); numbers mark the position of the inactivating mutation in GFP (0 is for start of the gene, 6 is for 603 nt downstream); and Age or Spe refers to the frameshift mutation toward the 5’ or 3’ end of CA, which are indicated as *CA or C*A, respectively.
Fig. 2
Fig. 2. Detection of Gag expression in infected cells by α-p24-antibody staining and flow cytometry
(a) Experimental protocol used to generate infected cells for Gag detection. Briefly, constructs were used to transfect 293T cells, viruses were harvested and used to infect target Hut/CCR5 cells, which were processed and analyzed by flow cytometry. (b) Detection of Gag expression in cells infected with subtype C viruses (upper panels) and subtype B viruses (lower panels). Detection of HSA or B7 markers is shown in x-axis, whereas detection of CA (p24) is shown in y-axis.
Fig. 3
Fig. 3. Measurements of recombination among group M viruses
(a) Experimental protocol used to establish dual-infected virus producer cell line and to measure recombination. (b) Expression of surface markers, Gag, and GFP in selected producer cell lines containing subtype B and subtype C proviruses. Gag expression was detected by α-p24 antibody staining. (c) Representative flow cytometry analyses of target Hut/CCR5 cells from recombination experiments.
Fig. 4
Fig. 4. Recombination of group M viruses measured by gfp or gag marker gene reconstitution
Y-axis, the percentage of recombination events measured by GFP+ or Gag+ among infection events. Black bars, percentage of GFP+ events; white bars, percentage of Gag+ events measured by α-p24-antibody staining. Results from three to seven independent experiments were averaged; error bars represent standard deviations.
Fig. 5
Fig. 5. Measurements of recombination rate between group M and group O viruses
(a) Detection of group O Gag expression in cells. Target Hut/CCR5 cells were infected with control group O viruses and stained with α-p24 and anti-surface marker antibodies. (b) Expression of surface markers, Gag, and GFP in producer cell line containing two group O proviruses with gag mutations. (c) Inter-group recombination rates. Black and white bars represent % GFP+ and % Gag+ cells in infected population, respectively. Except for those marked by *, results from three to six independent experiments were averaged; error bars represent standard deviations. Each of the two results marked by * is from a single data point although three (O-C) and four (O-BdisC) repetitions were performed each yielding sufficient numbers of GFP+ cells to calculate GFP recombination rate.

Similar articles

Cited by

References

    1. Sharp PM, Hahn BH. The evolution of HIV-1 and the origin of AIDS. Philos Trans R Soc Lond B Biol Sci. 2010;365:2487–2494. - PMC - PubMed
    1. Gao F, Bailes E, Robertson DL, Chen Y, Rodenburg CM, Michael SF, Cummins LB, Arthur LO, Peeters M, Shaw GM, Sharp PM, Hahn BH. Origin of HIV-1 in the chimpanzee Pan troglodytes troglodytes. Nature. 1999;397:436–441. - PubMed
    1. Van Heuverswyn F, Li Y, Neel C, Bailes E, Keele BF, Liu W, Loul S, Butel C, Liegeois F, Bienvenue Y, Ngolle EM, Sharp PM, Shaw GM, Delaporte E, Hahn BH, Peeters M. Human immunodeficiency viruses: SIV infection in wild gorillas. Nature. 2006;444:164. - PubMed
    1. Plantier JC, Leoz M, Dickerson JE, De Oliveira F, Cordonnier F, Lemee V, Damond F, Robertson DL, Simon F. A new human immunodeficiency virus derived from gorillas. Nat Med. 2009;15:871–872. - PubMed
    1. McCutchan FE. Global epidemiology of HIV. J Med Virol. 2006;78 Suppl 1:S7–S12. - PubMed

Publication types

Substances

LinkOut - more resources