. 2011 Feb 4;144(3):414-26.
doi: 10.1016/j.cell.2011.01.016.

Influence of cell geometry on division-plane positioning

Affiliations

Influence of cell geometry on division-plane positioning

Nicolas Minc et al. Cell. .

Abstract

The spatial organization of cells depends on their ability to sense their own shape and size. Here, we investigate how cell shape affects the positioning of the nucleus, spindle and subsequent cell division plane. To manipulate geometrical parameters in a systematic manner, we place individual sea urchin eggs into microfabricated chambers of defined geometry (e.g., triangles, rectangles, and ellipses). In each shape, the nucleus is positioned at the center of mass and is stretched by microtubules along an axis maintained through mitosis and predictive of the future division plane. We develop a simple computational model that posits that microtubules sense cell geometry by probing cellular space and orient the nucleus by exerting pulling forces that scale to microtubule length. This model quantitatively predicts division-axis orientation probability for a wide variety of cell shapes, even in multicellular contexts, and estimates scaling exponents for length-dependent microtubule forces.


Figures

Figure 1
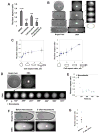
Figure 1. Controlling cell shape of sea urchin embryos using microfabricated chambers
A. Use of micro-fabricated PDMS wells for manipulating the shape of sea urchin embryos. Fertilized eggs are placed into wells of different shapes that are designed all to be the volume of an egg. The depth of the chambers (h) is smaller than the egg diameter (d) so that the egg is slightly flattened into its new geometry. B. DIC pictures of eggs in chambers adopting different geometries. C. Division plane positioning in cells with different geometries. Cells of different shapes were introduced into wells and then assayed for division plane positioning. The “long axis rule” predicts that cells will divide at the center of cell mass at an axis perpendicular to the long axis at this center. The cells in the top row follow this rule, but the cells in the bottom row do not. D. Time-lapse sequence of an embryo shaped in a rectangular chamber, from 15 min after fertilization to completion of cytokinesis. Nuclei were stained with Hoechst. Note the early centering of the zygote nucleus after pro-nuclei migration and fusion, and the elongation of the interphase nucleus along the future division axis. E. The orientation of the interphase nucleus predicts the future spindle axis and division plane in these cells. The relative centering and orientation at metaphase (M), anaphase (A), and cytokinesis (C) relative to interphase (I) are computed as indicated in the figure from time-lapse sequences. Error bars represent standard deviations. Scale bars, 20μm. See also figure S1 and S2 and Movie S1.
Figure 2
Figure 2. Nuclear centering is microtubule dependent
A. Methods for dynamically altering cell shape. Images of an interphase cell before and after entry into a well. The nucleus, stained with Hoechst, is positioned at the new cell center within minutes. B. Images of interphase cells a few minutes after being pushed into chambers in the presence of 1% DMSO (control), 20μM nocodazole, or 20μM Latrunculin B (from top to bottom). Black arrows point at aster centers on the side of the nucleus. The red dots position the center of mass and the dotted purple lines outline the nucleus contour. C. Quantification of nuclear position in the indicated conditions. The error in centering is defined as the ratio between the distances from the nucleus center to the cell’s center of mass to the long axis of the cell. Error bars represent standard deviations. D. Confocal images of cells in chambers fixed and stained in situ for tubulin (green) and DNA (blue), in the presence of 1% DMSO or 20μM nocodazole. Images are stacks of 20 mid-section slices that cover a total depth of 10μm. **P<0.01, Student’s t-test compared with the control. Scale bars, 20μm. See also figure S3.
Figure 3
Figure 3. Nuclear shape is an indicator of microtubule pulling forces
A. Quantification of nuclear shape in cells treated with the indicated drugs (as in Figure 2B). The nuclear aspect ratio is defined as the ratio between the long and short axis of the ellipsoid shape of the nucleus. The cells used for this quantification have a geometrical aspect ratio smaller than 1.5 (see 3C). Error bars represent standard deviations. B. Nuclear shape in cells with increasing aspect ratios. Close-up images of nuclei in different cells are presented on the right. Dotted colored lines outline each nucleus. Their superimposition highlights the increase in nuclear aspect ratio as cells are more elongated. Black arrows in the bright field picture point at aster centers on the side of the nucleus. C. Plot of the nuclear aspect ratio as a function of the cell aspect ratio, a/b, for a series of ellipsoid and rectangular cell shapes. Each point is binned from data on 10 or more cells having the same shape, for a total number of 104 cells for the ellipses and 82 for the rectangles. Error bars represent standard deviations. The dotted lines are depicted to guide the eyes. D. Time-lapse images of the interphase nucleus in a cell just prior to and after treatment with 20μM nocodazole. Note that nuclear shape becomes spherical in minutes. E. The nuclear aspect ratio as a function of time in the representative cell in Figure 2D and two other cells treated in the same manner. F. Effect of 20μM nocadozole on the nuclear shape in elongated cells inside chambers. Black arrows point at aster centers on the side of the nucleus and the dotted purple lines outline the nucleus. G. Nuclear aspect ratio in cells inside chambers before and after treatment with 20μM nocodazole (one cell per color, n=8 cells). The black horizontal bar represents the mean value. **P<0.01, Student’s t-test compared with the control. Scale bars, 20μm.
Figure 4
Figure 4. A computational model that predicts nuclear orientation and division plane orientation in response to cell geometry
A. Schematic 2D representation of the cellular organization used for modeling. The nucleus (gray) is located at the center of mass and oriented along an axis α. Microtubules (green) emanate from two centrosomes (orange) attached to each side of the nucleus and extend out to the cortex. The total force generated by the two MT asters along the α-axis is F(α), and the total torque at the cell’s center is T(α). Inset: A microtubule in the aster has a length L and is nucleated at an angle θ from the axis α. It produces a pulling force, f at its nuclear attachment and a torque τ at the nucleus center. The projection of the force along the axis α is denoted fp. B. Examples of cells in specific geometries (triangles and fan) at interphase and after cytokinesis, stained with Hoechst. The nuclear and subsequent spindle orientation, α is reported and highlighted by the yellow dotted line. C. The plots represent the different outputs of the model for these 3 cells in B (corresponding colors). The dots on the plots position the experimental spindle orientation αexp. Note that in the three cases, αexp is close to maxima of the total normalized force and the probability density, to zeros of the total normalized torque and to minima of the normalized potential. D. (Left) Frequency histogram of the absolute difference between αexp and αth (calculated as the maxima of the probability plot) for 77 dividing cells with different shapes. (Right) Frequency histogram of the probability density ratio for the same 77 sequences. The ratio is 1 when the experimental axis has the same probability density as the theoretical axis and 0 when the experimental axis falls in the zone where the probability density is 0. E. Model prediction of cleavage plane orientation probability density in the depicted shapes and experimental frequency histograms of division axis in the depicted shape. Note that the division plane angle used here, αdiv is rotated 90° from the nuclear orientation angle α presented in 4A-4D. F. (Top) DIC images of divided eggs in different geometry. (Bottom) Plot of the experimental and theoretical division plane orientation to the y-axis, sin(αdiv)-cos(αdiv), as a function of the geometrical aspect ratio. The orientation to the y-axis is -1 if all cells cleave perpendicular to the y-axis, 1 if they all cleave parallel to the y-axis and 0 for a random distribution of cleavage planes. Each experimental point is averaged on at least 15 different cells in a given shape. Scale bars, 20μm. See also figure S4 and S5.
Figure 5
Figure 5. Nuclear force scaling in different shapes reveals length dependency of microtubules forces
Top: Schematic 2D representation of the cellular organization used for force scaling modeling in the series of ellipses and rectangles. The axis orientation is fixed at the stable orientation, α=0 which also corresponds to the maximum force, Fmax. Inset: The MT pulling force, f, is set to be proportional to Lβ. Bottom: Logarithmic plots of the normalized nuclear force as a function of cell aspect ratio. The experimental maximum forces are computed using Eq.1 from the nuclear aspect ratio data reported in Figure 3C and normalized to the force in a round cell. Theoretical plots are generated for different values of β (different colors). The slope σ is computed from fitting each plot linearly. Error bars represent standard deviations.
Figure 6
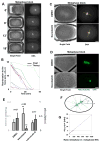
Figure 6. Predicting embryonic cleavage patterns and spindle orientation in tissues
A. Time lapse images of urchin embryos going through the first two cleavages encased in chambers of different geometries. Each colored graph on the right corresponds to the predicted probability density computed from the shape of the cell on the left, contoured with the same color. The color blue is used for the zygote, and green and red are used for the 2-cell blastomeres. The spots on the plots correspond to the experimental division plane axis. Note that the division plane angle used here, αdiv is rotated 90° from the nuclear orientation angle α presented in 4A-4D. B. Drawing of meiotic spermatocytes with different shapes from a tissue section of the pigeon testis, reprinted from (Guyer, 1900). The corresponding computed theoretical spindle orientation probability density is plotted on the right in the corresponding color and number. Only cells depicting a spindle in the image plane are analyzed. The spots on the plots correspond to the experimental axis. Scale bars, 20μm.
Figure 7
Figure 7. Rotation of the metaphase spindle in response to cell-shape changes
A. Cells were blocked in metaphase by treatment with the inhibitor MG132 and then changed into a new shape by introducing them into a well. Time-lapse images of spindle rotation (as shown by Hoechst staining) in a metaphase arrested cell in a rectangular chamber. B. Examples of experimental and theoretical plots of the reorientation of the spindle axis to the theoretical force axis. The theoretical plots are computed by assuming a ratio of metaphase to interphase MT number of 1/150 (see 5G). C. Images of embryos blocked in metaphase and introduced into a chamber for 20 min, in the presence and in the absence of 20μM nocodazole. The red point corresponds to the cell’s center of mass and the yellow dotted line corresponds to the spindle axis. D. Confocal images of embryos blocked in metaphase, treated with 1% DMSO or 20μM nocodazole and introduced into a chamber. After 20 min, cells were fixed and stained in situ for tubulin (green) and DNA (blue). Images are projections of Z-stacks of 20 mid-section slices that cover a total depth of 10μm. E. Quantification of spindle centering and orientation along the theoretical force axis in response to shape changes, in the indicated conditions. The error in centering is defined as the ratio between the distances from the metaphase spindle center to the cell’s center of mass to the long axis of the cell. The orientation ratio, p(αexp) /p(αth) is 1 when the spindle axis has the same probability density as the theoretical axis and 0 when the spindle axis falls in the zone where the probability density is 0. Error bars represent standard deviations. F. Schematic 2-D representation of the cellular organization at metaphase. G. Average error between experimental and theoretical times corresponding to 12 different cells, plotted as a function of the ratio of metaphase to interphase MT number. A positive number corresponds to an underestimation in the reorientation timing of the model while a negative number corresponds to an overestimation of the model. **P<0.01, Student’s t-test compared with the control. Scale bars, 20μm. See also figure S6.

Comment in

References

    1. Bettinger BT, Gilbert DM, Amberg DC. Actin up in the nucleus. Nat Rev Mol Cell Biol. 2004;5:410–415. - PubMed
    1. Bjerknes M. Physical theory of the orientation of astral mitotic spindles. Science. 1986;234:1413–1416. - PubMed
    1. Cai D, McEwen DP, Martens JR, Meyhofer E, Verhey KJ. Single molecule imaging reveals differences in microtubule track selection between Kinesin motors. PLoS Biol. 2009;7:e1000216. - PMC - PubMed
    1. Carminati JL, Stearns T. Microtubules orient the mitotic spindle in yeast through dynein-dependent interactions with the cell cortex. J Cell Biol. 1997;138:629–641. - PMC - PubMed
    1. Concha ML, Adams RJ. Oriented cell divisions and cellular morphogenesis in the zebrafish gastrula and neurula: a time-lapse analysis. Development. 1998;125:983–994. - PubMed

Publication types

LinkOut - more resources