. 2011 Feb 4;144(3):439-52.
doi: 10.1016/j.cell.2010.12.032.

Reference Maps of human ES and iPS cell variation enable high-throughput characterization of pluripotent cell lines

Affiliations

Reference Maps of human ES and iPS cell variation enable high-throughput characterization of pluripotent cell lines

Christoph Bock et al. Cell. .

Abstract

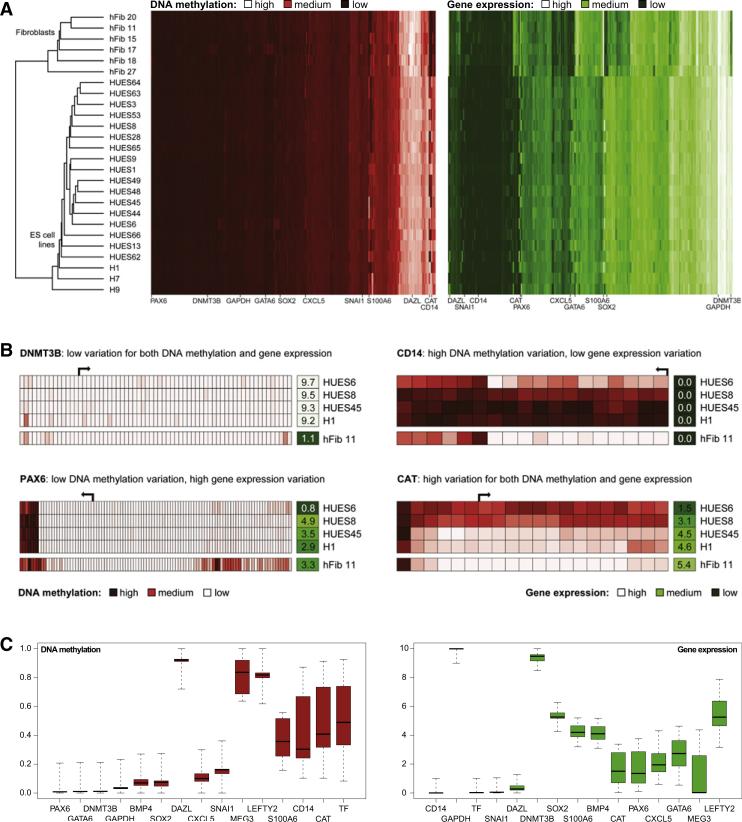
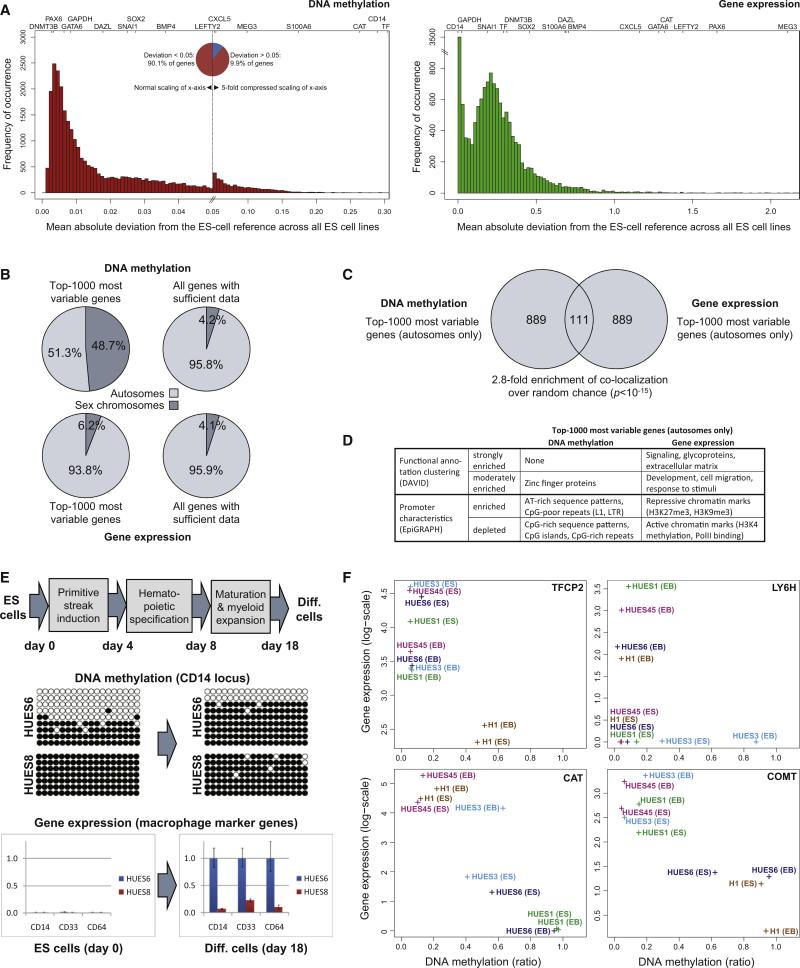
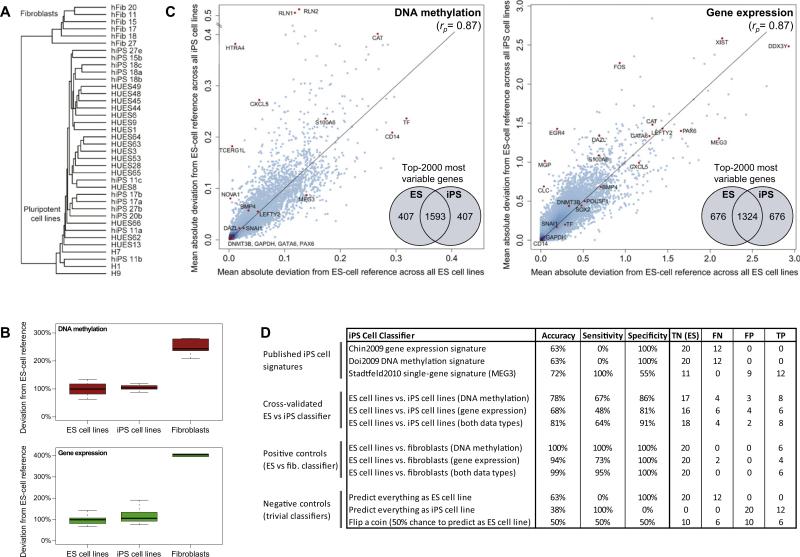
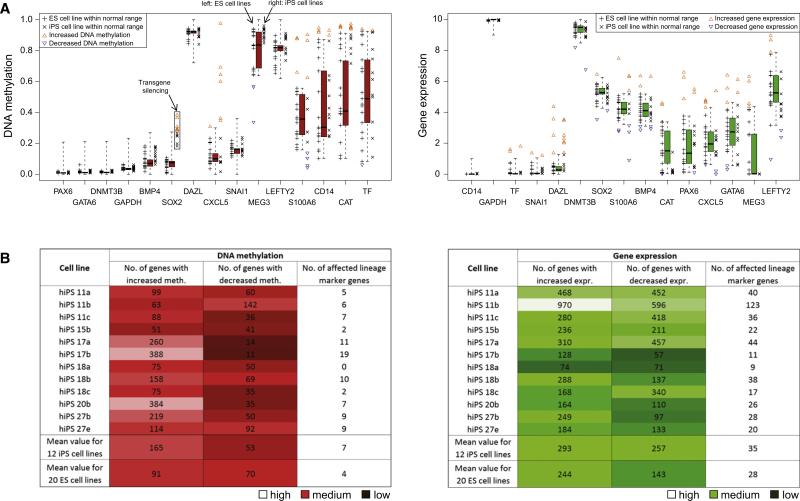
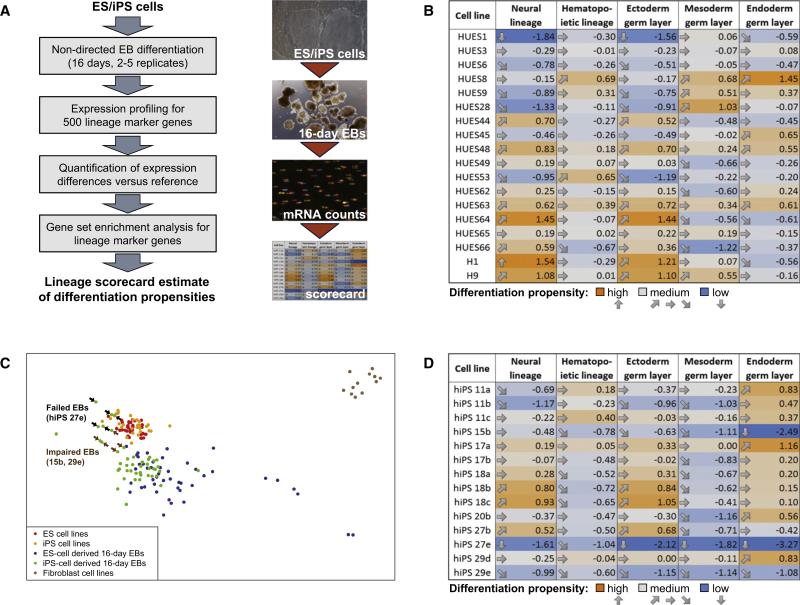
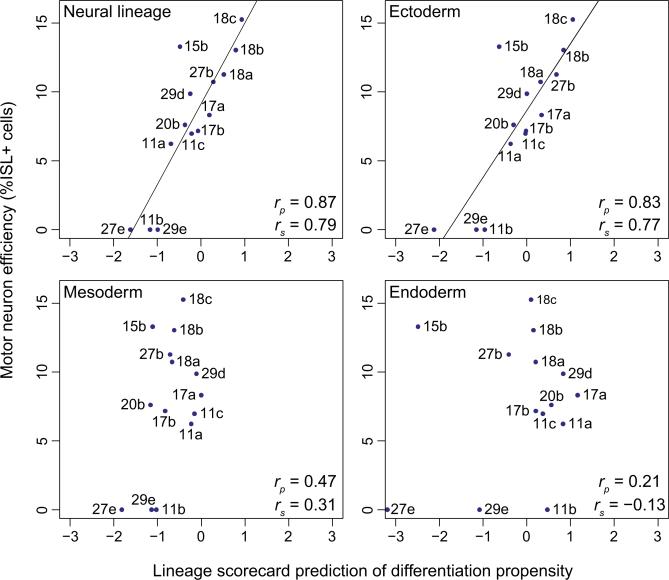
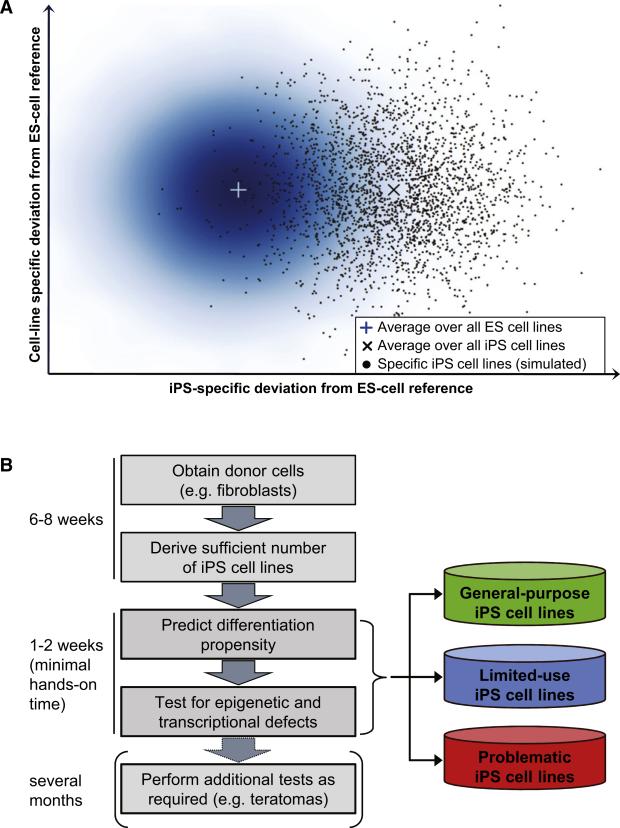
The developmental potential of human pluripotent stem cells suggests that they can produce disease-relevant cell types for biomedical research. However, substantial variation has been reported among pluripotent cell lines, which could affect their utility and clinical safety. Such cell-line-specific differences must be better understood before one can confidently use embryonic stem (ES) or induced pluripotent stem (iPS) cells in translational research. Toward this goal we have established genome-wide reference maps of DNA methylation and gene expression for 20 previously derived human ES lines and 12 human iPS cell lines, and we have measured the in vitro differentiation propensity of these cell lines. This resource enabled us to assess the epigenetic and transcriptional similarity of ES and iPS cells and to predict the differentiation efficiency of individual cell lines. The combination of assays yields a scorecard for quick and comprehensive characterization of pluripotent cell lines.


Figures

Figure 1
Figure 1. DNA Methylation and Gene Expression Profiles Quantify Variation among Human ES Cell Lines
(A) Joint hierarchical clustering of DNA methylation and gene expression in 20 human ES cell lines (“HUESx,” “Hx”) and 6 primary fibroblast cell lines (“hFibx”). Light colors indicate high levels of DNA methylation (red) or gene expression (green), and dark colors indicate low levels. Joint DNA methylation and gene expression data are available from Table S2. (B) High-resolution view of DNA methylation and gene expression at four selected genes. DNA methylation patterns are shown for the promoter regions (–5kb to +1 kb) of representative Ensembl-annotated transcripts. Each box on the left represents a single CpG dinucleotide (dark red: high methylation, light red: little or no methylation). The single boxes on the right visualize the normalized expression levels of each gene (dark green: little or no expression, light green: high expression). The DNA methylation patterns are not drawn to scale. (C) Boxplots of gene-specific DNA methylation (left) and gene expression levels (right) among 20 low-passage human ES cell lines, illustrating the concept of an epigenetic/transcriptional reference corridor. Boxplot boxes correspond to center quartiles, the median is marked by a black bar, and whiskers indicate the width of the reference corridor as defined in the Extended Experimental Procedures (i.e., value of the most extreme data point that is no more than 1.5 times the interquartile range from the box if the distance from the median exceeds a minimum threshold of 0.2 for DNA methylation and 1 for gene expression; otherwise these thresholds—which correspond to 20 percentage points for DNA methylation and a 2-fold change for gene expression—define the reference corridor). Data points that fall outside the whiskers are flagged as outliers and are suppressed in this figure; their position relative to the reference corridor is shown in Figure 4A.
Figure 2
Figure 2. Epigenetic and Transcriptional Variation Targets Specific Genes and Influences Cellular Differentiation
(A) Distribution of cell-line-specific variation in terms of DNA methylation and gene expression. The histogram shows the number of genes (y axis) that fall into each interval when calculating the mean absolute deviation of individual ES cell lines relative to the reference of all other ES cell lines (x axis). The position of selected genes within each histogram is highlighted on top. Note that the DNA methylation histogram (left) is extremely skewed; for better representation the x axis has been compressed 5-fold for the right half of the diagram, which gives rise to an artificial peak in the center of the histogram. The gene expression histogram (right) is characterized by a strong peak at zero, due to a large number of genes with zero expression and zero variation in all ES cell lines. Variation data for all genes are available from Table S3. (B) Chromosomal distribution of the 1000 most variable genes in terms of DNA methylation (top left) and gene expression (bottom left). For comparison, the diagram also shows the chromosomal distribution of all genes with sufficient DNA methylation (top right) or gene expression data (bottom right). (C) Comparison of the 1000 most variable genes in terms of DNA methylation (left) and gene expression (right). To prevent bias due to the chromosomal differences of male versus female cell lines, all X-linked and Y-linked genes were excluded. Significance of overlap was confirmed by Fisher's exact test. (D) Functional and structural characteristics of the 1000 most variable genes in terms of DNA methylation (left) and gene expression (right). Functional annotation clustering was performed with the DAVID software (Huang et al., 2007), and the promoter characteristics were analyzed by the EpiGRAPH web service (Bock et al., 2009). This panel provides a summary of the results; the full results tables are available online http://scorecard.computational-epigenetics.org/. (E) Epigenetic and transcriptional differences between two ES cell lines (HUES6 and HUES8) subjected to a defined hematopoietic differentiation protocol. DNA methylation levels were measured by clonal bisulfite sequencing at day 0 and day 18 of the differentiation protocol. White beads correspond to unmethylated CpGs, and black beads correspond to methylated CpGs. Rows correspond to individual clones, and columns correspond to specific CpGs in the promoter region of CD14. Similarly, gene expression of CD14 and two additional macrophage marker genes (CD33 and CD64) was measured by qPCR in two independent experiments (shown are three technical replicates) at day 0 and day 18 of the differentiation protocol. Error bars indicate ± one standard deviation. (F) Cell-line-specific DNA methylation and gene expression levels at four genes with a known role in hematopoiesis (TFCP2, LY6H) and neural processes (COMT, CAT). Each data point denotes the combined DNA methylation (x axis) and gene expression (y axis) levels of an ES cell lines (“ES”) or the corresponding 16 day embryoid body (“EB”).
Figure 3
Figure 3. Cell-Line-Specific Deviation from the Reference Is Slightly Higher in iPS than in ES Cell Lines
(A) Joint hierarchical clustering of 12 iPS cell lines (“hiPSx”), 20 ES cell lines (“HUESx,” “Hx”), and 6 primary fibroblast cell lines (“hFibx”). An extended version that includes heatmaps is available from Figure S2A. The numbers of the iPS cell lines connect them to the fibroblasts from which they were derived (e.g., hFib 18 was used to generate hiPS 18a, 18b, and 18c). (B) Boxplots of the cell-line-specific deviation from the ES cell reference, averaged over all genes and scaled such that the mean deviation of the 20 ES cell lines is equal to 100%. (C) Scatterplots comparing the gene-specific deviation of 20 ES cell lines (x axis) with the gene-specific deviation of 12 iPS cell lines (y axis), in both cases measured relative to the ES cell reference and averaged over all ES or iPS cell lines, respectively. To prevent comparing cell lines to themselves, each ES cell line was temporarily removed from the ES cell reference when it was compared to the reference. Selected genes are highlighted in orange, rp refers to Pearson's correlation coefficient, and the inset Venn diagrams visualize the overlap between the 2000 most deviating genes in ES versus iPS cell lines. The reprogramming factors OCT4, SOX2, and KLF4 were excluded from the DNA methylation analysis because transgene silencing gives rise to spurious hypermethylation among the iPS cell lines (Figure 4A and Figure S2C). (D) Performance table summarizing the predictive power of three previously published iPS cell signatures and three newly derived classifiers for distinguishing between ES and iPS cell lines. For comparison, the table also lists the performance of three newly derived classifiers for distinguishing between ES cell lines and fibroblasts (positive controls) and the performance of three trivial classifiers (negative controls). Shown are the prediction accuracy, sensitivity, and specificity for identifying iPS cell lines (true positives, TP) among ES cell lines (true negatives, TN), while minimizing the number of cell lines that are incorrectly predicted as iPS cell lines (false positives, FP) or incorrectly predicted as ES cell lines (false negatives, FN). To increase the robustness of the results, all values were averaged over 100 randomized repetitions of the cross-validation. Minor numerical inconsistencies in the table are due to rounding all values to whole numbers.
Figure 4
Figure 4. Comparison with the Reference Corridor Identifies Cell-Line-Specific Outlier Genes
(A) Distribution of gene-specific DNA methylation (left) and gene expression levels (right) among 20 ES cell lines and 12 iPS cell lines, plotted against the ES cell reference corridor (cf. Figure 1C). ES or iPS cell lines that fall outside of the corridor are highlighted by colored triangles. (B) Deviation scorecard summarizing the cell-line-specific number of outliers relative to the ES cell reference, in terms of DNA methylation (left) and gene expression (right). As an additional indication of a cell line's quality, the scorecard lists the number of affected lineage marker genes. The table also shows the mean number of deviating genes in the 20 low-passage ES cell lines (bottom row), providing an indication of what numbers are within a range that is also observed among low-passage ES cell lines. A more comprehensive version of this scorecard is available from Table S5.
Figure 5
Figure 5. A Quantitative Differentiation Assay Measures Cell-Line-Specific Differentiation Propensities
(A) Outline of the lineage scorecard assay for quantifying cell-line-specific differentiation propensities using a combination of nondirected EB differentiation, highly quantitative expression profiling, and bioinformatic analysis of lineage marker gene enrichment. (B) Lineage scorecard summarizing cell-line-specific differentiation propensities of a set of low-passage human ES cell lines. The numbers indicate relative enrichment (positive values) or depletion (negative values) of lineage marker expression in the EBs derived from each cell line. An ES cell line will exhibit a differentiation propensity of zero if it differentiates just like the average of all other ES cell lines that were used to calibrate the assay. Values should be interpreted relative to each other, with higher numbers indicating higher differentiation propensities and lower values indicating lower differentiation propensities, while the absolute values have no measurement unit and no direct biological interpretation. Gene lists, expression values, and gene-specific enrichment values are available from Table S6. (C) Multidimensional scaling map of the transcriptional similarity between ES and iPS cell lines, ES-derived and iPS-derived EBs, and primary fibroblast cell lines. Each point corresponds to a single biological replicate. Cell lines that were impaired or unable to form normal EBs are highlighted by arrows. (D) Lineage scorecard summarizing cell-line-specific differentiation propensities of a set of human iPS cell lines. The scorecard was derived in the same way as Figure 5B, and all values were normalized relative to the ES cell reference. The scores were calculated across all biological replicates that were available for each cell line. Further details on single biological replicates and the reproducibility of the lineage scorecard are available from Table S6G.
Figure 6
Figure 6. The Lineage Scorecard Predicts Cell-Line-Specific Differences in the Efficiency of Motor Neuron Differentiation
Correlation between the lineage scorecard estimates for the neural lineage and three germ layers versus the cell-line-specific efficiency of directed differentiation into motor neurons (rp, Pearson's correlation coefficient; rs, Spearman's correlation coefficient). Motor neuron efficiencies were measured by the percentage of ISL1-positive cells at the end point of a 32 day neural differentiation protocol. Further details including biological replicates and standard errors are available from Table S7.
Figure 7
Figure 7. The Scorecard Enables Quick and Comprehensive Characterization of Human Pluripotent Cell Lines
(A) Schematic illustration of the similarity between ES and iPS cell lines in the epigenetic and transcriptional space. The density plot on the left depicts the variation observed among human ES cells. The two crosses indicate the (hypothetical) average of all ES and iPS cell lines, which this study approximated by profiling 20 human ES cell lines and 12 human iPS cell lines. The scatterplot on the right simulates the distribution of a large number of human iPS cell lines, taking into account their moderately increased variation (Figure 3B) as well as the observation that a minority of iPS cell lines were indistinguishable from ES cell lines (Figure 3D). Gaussians were used to simulate the ES cell and iPS cell distribution in silico. (B) Outline of a workflow for high-throughput characterization of human pluripotent cell lines. Cell line characterization is performed in an iterative fashion, starting with the quantitative differentiation assay and performing additional characterizations only on those cell lines that the lineage scorecard identifies as useful for the application of interest.

Comment in

References

    1. Adewumi O, Aflatoonian B, Ahrlund-Richter L, Amit M, Andrews PW, Beighton G, Bello PA, Benvenisty N, Berry LS, Bevan S, et al. Characterization of human embryonic stem cell lines by the International Stem Cell Initiative. Nat. Biotechnol. 2007;25:803–816. - PubMed
    1. Allison DB, Cui X, Page GP, Sabripour M. Microarray data analysis: from disarray to consolidation and consensus. Nat. Rev. Genet. 2006;7:55–65. - PubMed
    1. Bock C, Walter J, Paulsen M, Lengauer T. Inter-individual variation of DNA methylation and its implications for large-scale epigenome mapping. Nucleic Acids Res. 2008;36:e55. - PMC - PubMed
    1. Bock C, Halachev K, Büch J, Lengauer T. EpiGRAPH: User-friendly software for statistical analysis and prediction of (epi-) genomic data. Genome Biol. 2009;10:R14. - PMC - PubMed
    1. Bock C, Tomazou EM, Brinkman AB, Muller F, Simmer F, Gu H, Jager N, Gnirke A, Stunnenberg HG, Meissner A. Quantitative comparison of genome-wide DNA methylation mapping technologies. Nat. Biotechnol. 2010;28:1106–1114. - PMC - PubMed

Publication types

MeSH terms