Comparative Study
. 2011 Apr 15;252(2):150-8.
doi: 10.1016/j.taap.2011.01.020. Epub 2011 Feb 4.

Regulation of Bach2 by the aryl hydrocarbon receptor as a mechanism for suppression of B-cell differentiation by 2,3,7,8-tetrachlorodibenzo-p-dioxin

Affiliations
Comparative Study

Regulation of Bach2 by the aryl hydrocarbon receptor as a mechanism for suppression of B-cell differentiation by 2,3,7,8-tetrachlorodibenzo-p-dioxin

K Nadira De Abrew et al. Toxicol Appl Pharmacol. .

Abstract

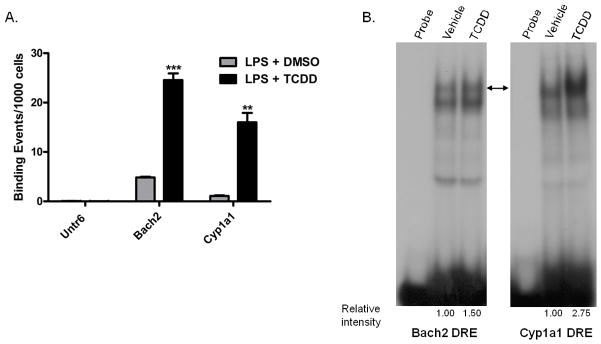
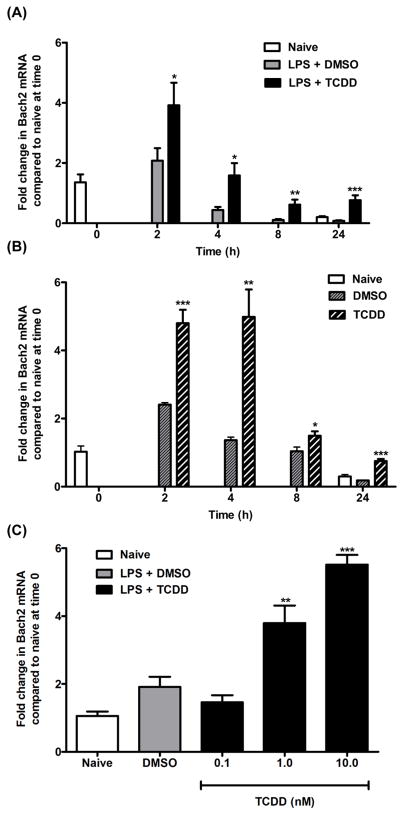
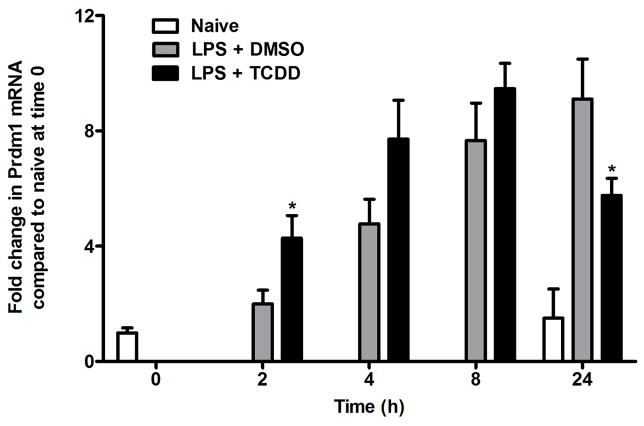
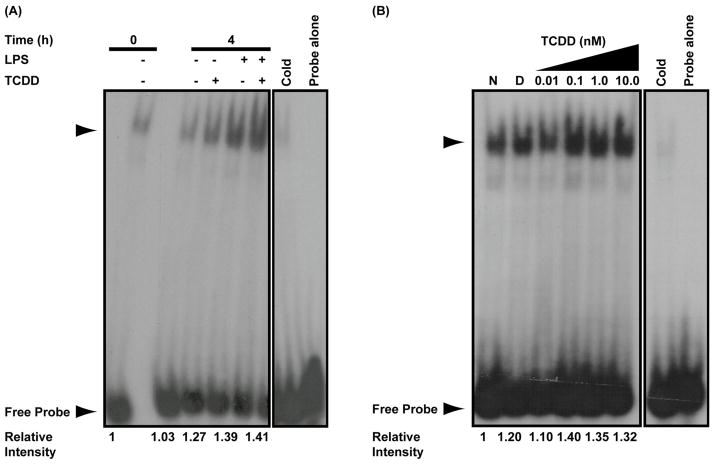
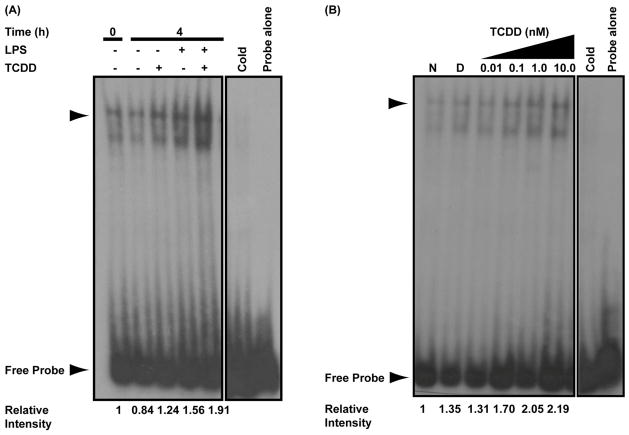
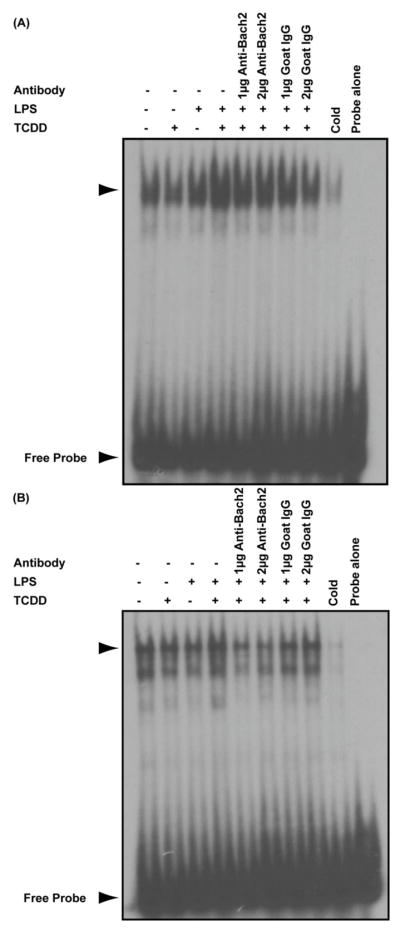
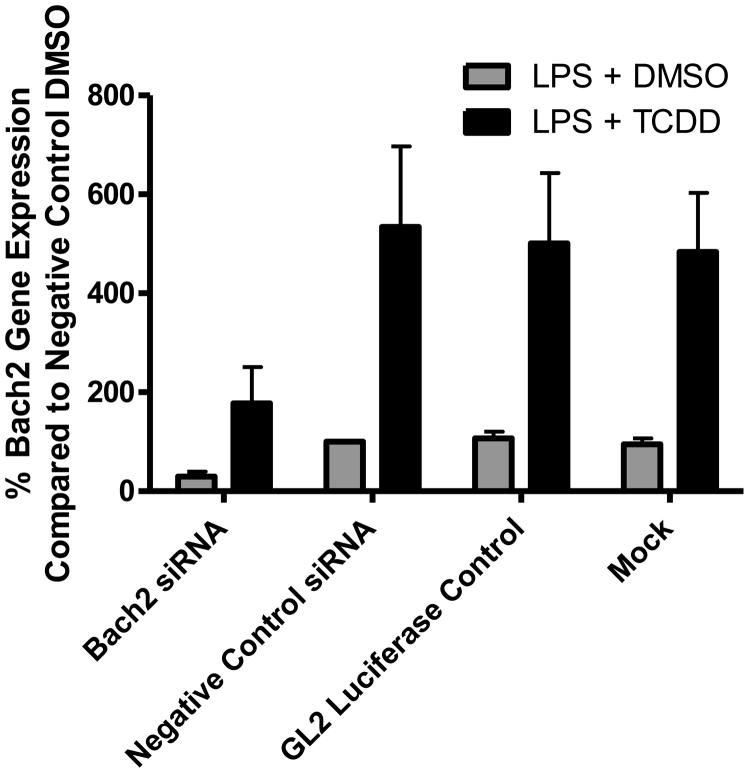
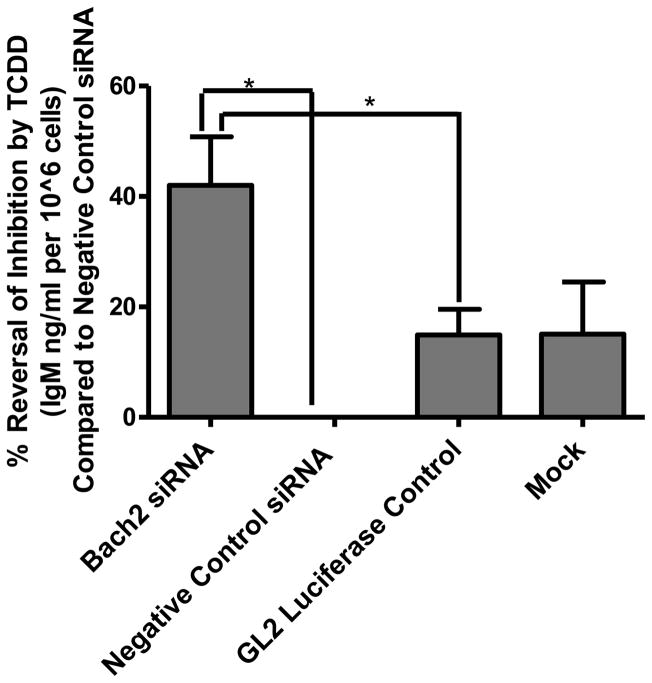
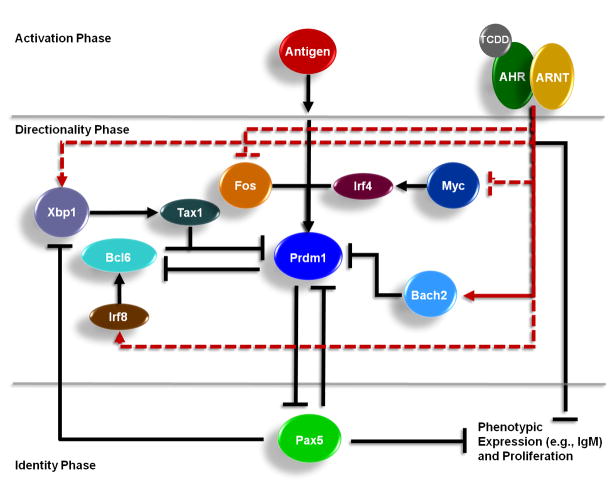
Exposure to the aryl hydrocarbon receptor (AHR) agonist, 2,3,7,8-tetrachlorodibenzo-p-dioxin (TCDD) alters B-cell differentiation and suppresses antibody production. Previous genomic studies in mouse B cells identified Bach2 as a direct target of the AHR. Bach2 is known to repress expression of Prdm1, a key transcription factor involved in B-cell differentiation, by binding to Maf elements (MAREs) in the regulatory regions of the gene. Chromatin immunoprecipitation followed by quantitative PCR in TCDD-treated lipopolysaccharide (LPS)-activated B cells showed increased binding of the AHR within the first intron in the Bach2 gene. The binding was further confirmed by electrophoretic mobility shift assay (EMSA). TCDD also induced expression of Bach2 in activated as well as resting B cells from 2 to 24h post-treatment in a time- and concentration-dependent manner. Expression of Prdm1 was decreased by TCDD at 24h and was consistent with repression by Bach2. Increased DNA binding activity to the intron 5 MARE with increasing TCDD concentrations was observed by EMSA. Supershifts identified the presence of Bach2 in the DNA binding complex associated with the intron 5 MARE of Prdm1. Functional validation of the role of Bach2 in the suppression of B-cell differentiation by TCDD was performed using RNA interference (RNAi). Knockdown of Bach2 showed approximately 40% reversal in the TCDD-induced suppression of IgM secretion when compared to controls. The results suggest that the transcriptional regulation of Bach2 by the AHR is one of the mechanisms involved in the suppression of B-cell differentiation by TCDD.


Conflict of interest statement

CONFLICT OF INTEREST STATEMENT

Russell S. Thomas acknowledges that he has received grant funding from The Dow Chemical Company for work in a different area.

Figures

Figure 1
Figure 1
Confirmation of AHR binding in the Bach2 target region. (A) Chromatin immunoprecipitation and quantitative PCR (ChIP-qPCR). B cells were activated with 10 μg/ml LPS and treated with 10 nM TCDD or 0.01% DMSO. After treatment for 1 h, cells were fixed and analyzed for AHR binding. The data are presented as binding events per 1000 cells and represent mean ± S.E. of triplicate measurements with each replicate performed on cells cultured and fixed on separate days. An untranscribed region (Untr6) was included as a negative control and the AHR binding region of Cyp1a1 was included as a positive control. **, p < 0.01; ***, p < 0.001. (B) Electrophoretic mobility shift assays were performed on nuclear extracts from naïve CH12.LX cells treated with 10 nM TCDD or 0.02% DMSO as vehicle for 1 h. The DRE3 region from the Cyp1a1 promoter was used as a control. Binding reactions were performed with 32P- labeled Bach2 and DRE3 probes. The arrow-head indicates the TCDD-inducible DNA binding activity. The results are representative of two independent experiments.
Figure 2
Figure 2
Time course and concentration-response changes in Bach2 mRNA levels following TCDD-treatment. (A) B cells were activated with 10 μg/ml LPS and treated with 10 nM TCDD or 0.02% DMSO and analyzed for Bach2 mRNA using qRT-PCR at the indicated times. Naïve cells were not activated with LPS nor treated with TCDD or DMSO and were analyzed at 0 and 24 h. (B) Resting B cells were treated with 10 nM TCDD or 0.02% DMSO and analyzed for Bach2 mRNA using qRT-PCR at the indicated times. Naive cells were not treated with TCDD or DMSO and were analyzed at 0 and 24 h. The data in these graphs (A and B) represent mean ± S.E. of quadruplicate measurements at each time point of three experimental replicates. (C) B cells were activated with LPS (10 μg/ml) and treated with 0.1, 1.0, 10 nM TCDD or 0.02% DMSO. Bach2 mRNA was analyzed at 2 h using qRT-PCR. The data in all graphs represent mean ± S.E. of quadruplicate measurements at each treatment group of two experimental replicates. Comparisons were made between the TCDD-treated group and DMSO-treated group at each time point (A, B) or between each TCDD-treated group and the DMSO group (C). *, p < 0.05; **, p < 0.01; ***, p < 0.0001.
Figure 3
Figure 3
Time course changes in Prdm1 expression levels in LPS-activated B cells. B cells were activated with LPS (10 μg/ml) and treated with TCDD (10 nM) or DMSO (0.02%). Prdm1 mRNA was analyzed by qRT-PCR at the indicated time. The data represent mean ± S.E. of quadruplicate measurements at each time-point of three experimental repliates. Comparisons were made between the LPS + TCDD-treated group and LPS + DMSO-treated group at each time point. *, p < 0.05.
Figure 4
Figure 4
TCDD-inducible and concentration-dependent DNA binding at Prdm1 promoter MARE. (A) Electrophoretic mobility shift assay performed on naive and LPS-activated (10 μg/ml) B cells treated with TCDD (10 nM) or DMSO (0.02%) for 0 or 4 h. The 0 h indicates background binding in untreated B cells. (B) Electrophoretic mobility shift assay performed on LPS-activated (10 μg/ml) B cells treated with the indicated concentrations of TCDD or 0.02% DMSO for 4 h. In both assays, binding reactions were set up with 32P-labeled promoter MARE probe as described in experimental methods. The arrow head indicates the TCDD-inducible DNA-protein complex. Results are representative of three separate experiments.
Figure 5
Figure 5
TCDD-inducible and concentration-dependent DNA binding at Prdm1 intron 5 MARE. (A) Electrophoretic mobility shift assay performed on naive and LPS-activated (10 μg/ml) B cells treated with TCDD (10 nM) or DMSO (0.02%) for 0 or 4 h. The 0 h indicates background binding in untreated B cells. (B) Electrophoretic mobility shift assay performed on LPS-activated (10 μg/ml) B cells treated with the indicated concentrations of TCDD or 0.02% DMSO for 4 h. In both assays, binding reactions were set up with 32P-labeled intron 5 MARE probe as described in experimental methods. The arrow head indicates the TCDD-inducible DNA-protein complex. Results are representative of three separate experiments.
Figure 6
Figure 6
Supershift analysis of TCDD-inducible binding activity of Bach2 at Prdm1 promoter and intron 5 MARE. Electrophoretic mobility shift assays were performed on resting and LPS-activated (10 μg/ml) B cells treated for 4 h with TCDD (10 nM) or vehicle (0.02% DMSO). Binding reactions were set up with (A) 32P-labeled promoter MARE probe and (B) 32P-labeled intron 5 MARE probe. In both assays, anti-Bach2 antibody at 1 μg and 2 μg (lanes 5 and 6, respectively) and isotype control goat IgG at 1 μg and 2 μg (lanes 7 and 8, respectively) were used. The arrow head indicates the TCDD-inducible DNA-protein complex. Results are representative of two separate experiments.
Figure 7
Figure 7
Knockdown of Bach2 mRNA in B cells using siRNA. B-cells were electroporated with an siRNA duplex targeting Bach2 (Bach2 siRNA), negative control siRNA duplexes (negative control siRNA and GL2 luciferase control), or mock electroporated (no siRNA duplexes). Following a 2 h recovery, cells were activated with LPS (10 μg/ml) and treated with either TCDD (10 nM) or DMSO (0.02%) for 48 h. Bach2 mRNA was measured using qRT-PCR. The data are presented as a percentage of the negative control siRNA duplex treated with LPS + DMSO. The bars are mean ± S.E. of triplicate experimental replicates.
Figure 8
Figure 8
Functional validation of the role of Bach2 in the TCDD-dependent suppression of IgM secretion. B-cells were electroporated with a siRNA duplex targeting Bach2 (Bach2 siRNA), negative control siRNA duplexes (negative control siRNA and GL2 luciferase control), or mock electroporated (no siRNA duplexes). Following a 2 h recovery, cells were activated with LPS (10 μg/ml) and treated with either TCDD (10 nM) or DMSO (0.02%) for 48 h. IgM concentrations in the culture media were measured using ELISA. The data are presented as the % reversal of IgM suppression by TCDD compared to negative control siRNA. The bars are mean ± S.E. of quadruplicate experimental replicates. *, p < 0.05.
Figure 9
Figure 9
Conceptual model depicting the mechanism of TCDD-mediated suppression of B-cell differentiation into plasma cells. The proposed model depicts the role of the AHR acting at multiple nodes in the signaling network regulating B cell differentiation. At the core of the signaling network are three key transcription factors involved in B-cell differentiation (Prdm1, Bcl6, and Pax5) that exist in negative regulatory feedback loops. Lines ending in arrows represent positive regulatory interactions and lines ending in a “T” represent negative regulatory interactions. The black lines represent signaling links previously established in the literature and the red lines represent signaling interactions identified in a previous integrated genomic analysis (De Abrew et al., 2010). The dashed red lines represent putative interactions that have not been functionally validated. The solid red line represents the functionally validated interaction in this study.

Similar articles

Cited by

References

    1. Andrews NC, Faller DV. A rapid micropreparation technique for extraction of DNA-binding proteins from limiting numbers of mammalian cells. Nucleic Acids Res. 1991;19:2499. - PMC - PubMed
    1. Bishop GA, Haughton G. Induced differentiation of a transformed clone of Ly-1+ B cells by clonal T cells and antigen. Proc Natl Acad Sci U S A. 1986;83:7410–7414. - PMC - PubMed
    1. Calame K. Activation-dependent induction of Blimp-1. Curr Opin Immunol. 2008;20:259–264. - PubMed
    1. Chen Y, Blackwell TW, Chen J, Gao J, Lee AW, States DJ. Integration of genome and chromatin structure with gene expression profiles to predict c-MYC recognition site binding and function. PLoS Comput Biol. 2007;3:e63. - PMC - PubMed
    1. Chung JB, Silverman M, Monroe JG. Transitional B cells: step by step towards immune competence. Trends Immunol. 2003;24:343–349. - PubMed

Publication types

MeSH terms

Substances