. 2011 May;174(2):360-73.
doi: 10.1016/j.jsb.2011.01.015. Epub 2011 Feb 4.

Modeling protein structure at near atomic resolutions with Gorgon

Affiliations

Modeling protein structure at near atomic resolutions with Gorgon

Matthew L Baker et al. J Struct Biol. 2011 May.

Abstract

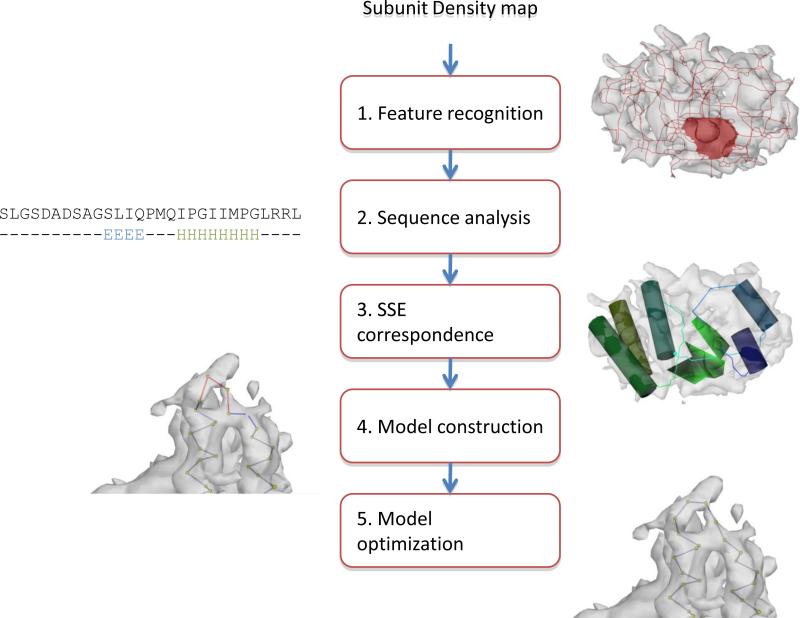
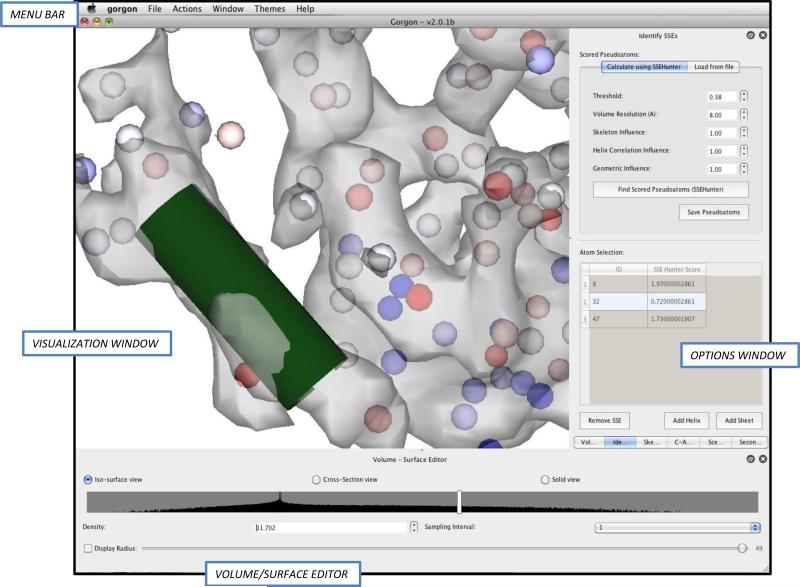
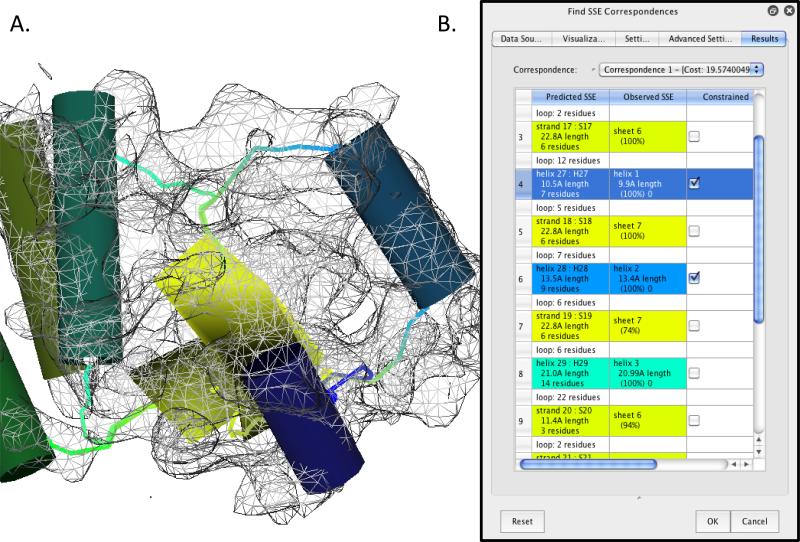
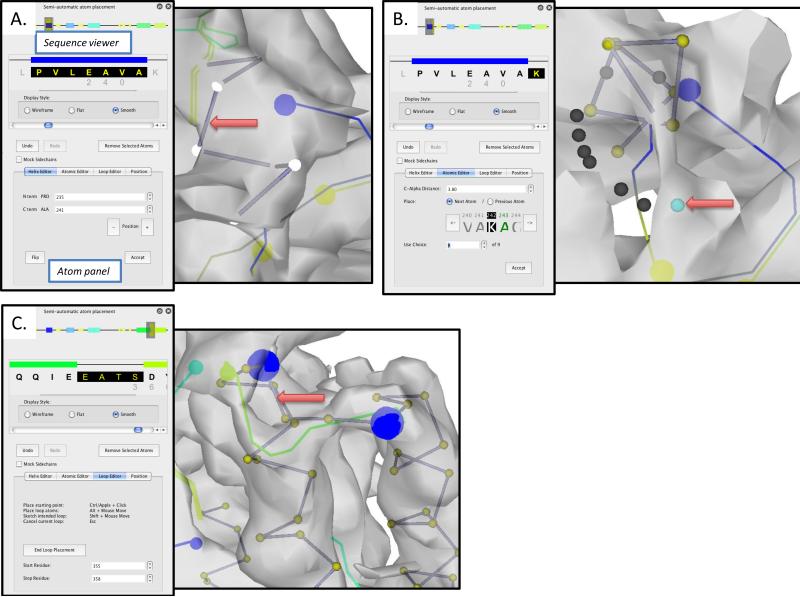
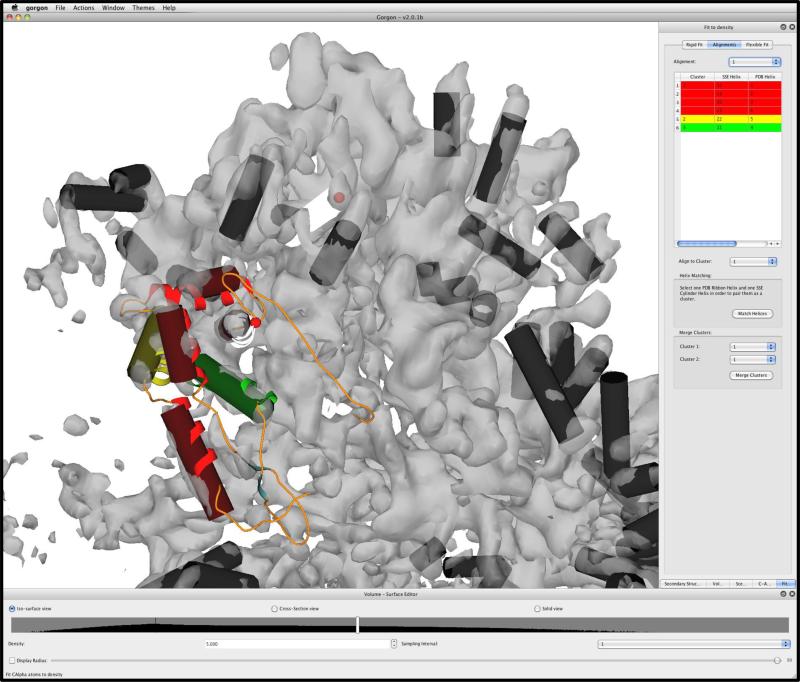
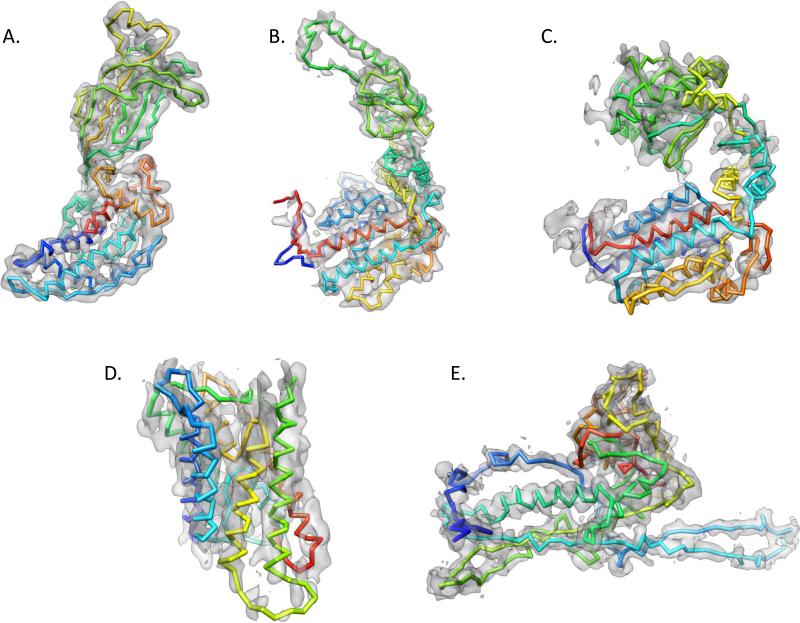
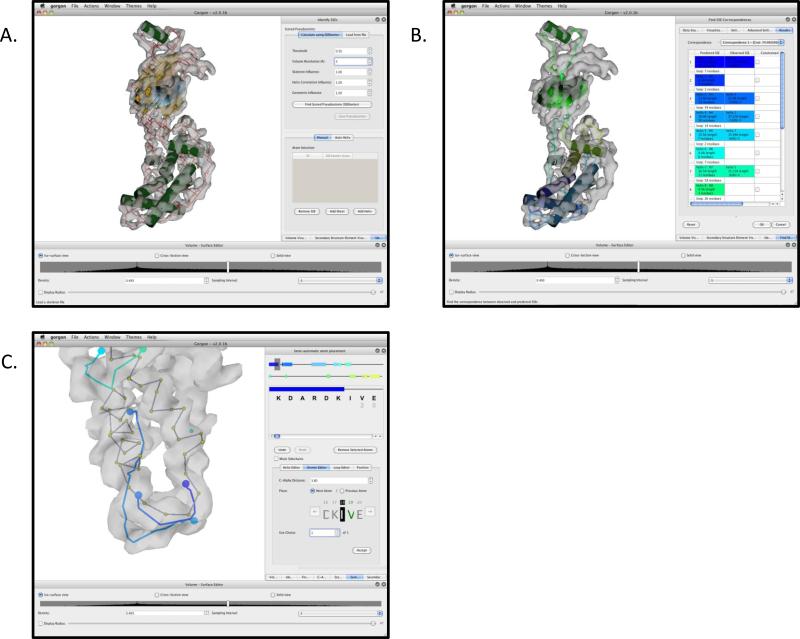
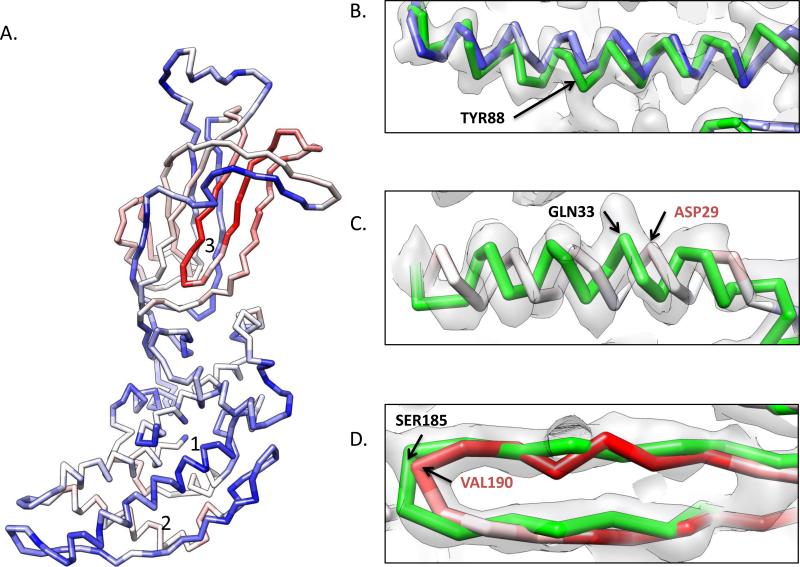
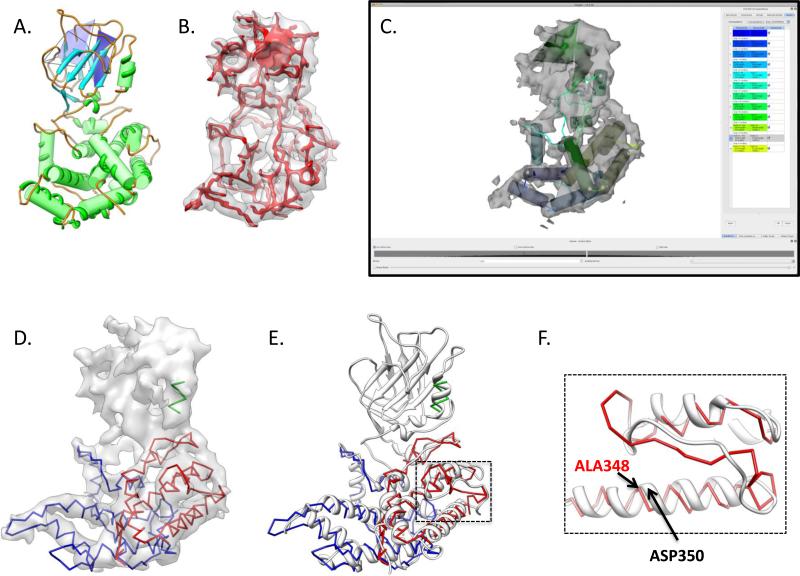
Electron cryo-microscopy (cryo-EM) has played an increasingly important role in elucidating the structure and function of macromolecular assemblies in near native solution conditions. Typically, however, only non-atomic resolution reconstructions have been obtained for these large complexes, necessitating computational tools for integrating and extracting structural details. With recent advances in cryo-EM, maps at near-atomic resolutions have been achieved for several macromolecular assemblies from which models have been manually constructed. In this work, we describe a new interactive modeling toolkit called Gorgon targeted at intermediate to near-atomic resolution density maps (10-3.5 Å), particularly from cryo-EM. Gorgon's de novo modeling procedure couples sequence-based secondary structure prediction with feature detection and geometric modeling techniques to generate initial protein backbone models. Beyond model building, Gorgon is an extensible interactive visualization platform with a variety of computational tools for annotating a wide variety of 3D volumes. Examples from cryo-EM maps of Rotavirus and Rice Dwarf Virus are used to demonstrate its applicability to modeling protein structure.


Figures

Figure 1
Figure 1
Modeling pathway. An overall outline of the de novo modeling pathway as implemented in Gorgon is shown. Images of the data at each are shown.
Figure 2
Figure 2
Building SSEs with Gorgon. The basic Gorgon interface is divided into four key sections: the menu bar at top, the visualization window in the middle, the volume/surface editor at the bottom and the option panel on the right. The SSEHunter result (red and blue pseudoatoms) for the apical domain from the 4.2Å resolution cryo-EM structure of GroEL in Gorgon is shown. A single helix has been annotated (green).
Figure 3
Figure 3
Correspondence search with Gorgon. A sequence-to-structure correspondence search for the apical domain of GroEL is shown. Helices in the visualization window (A), shown as cylinders, are colored coded to the corresponding sequence element in the “Find SSE correspondence” tool in the option panel (B). Sheets are shown as yellow planes. Connectivity between the secondary structure elements are represented in the visualization window by curve segments using color gradients based on the two connecting SSEs.
Figure 4
Figure 4
Atom placement with Gorgon. The “Semi-Automatic atom placement” tool is divided into two panes: a sequence viewer, which displays both global and local sequence views and the atom panel, which contains four separate tools for placing and adjusting atom positions in the density map. In (A), the Helix Editor is being used to assign the highlighted sequence in the sequence viewer to the selected VRML helix in the visualization window. In (B), the “Atomic Editor” is being used to walk along the density skeleton of the GroEL apical domain density map. The currently selected residue is highlighted in the sequence viewer; the atom to be placed is shown in green in the “Atomic editor”. In the visualization window, the currently selected residue is highlighted; potential positions for the next residue are shown as a dark grey or cyan sphere. In (C), the “Loop Editor” is being used to sketch a path through the density map and connect two adjoining helices. The start/stop end points of the loop are shown as large blue spheres.
Figure 5
Figure 5
Model fitting with Gorgon. 65 helices were identified in the 30S subunit structure of the T. thermophilus 70S ribosome (6.4Å resolution) using SSEHunter in Gorgon. Chain C of the 30S crystal structure (PDB ID: 3FIC) was fit to the density map based on the positions of the helices. The clique matching method for this fitting routine identified three groups of matching helices, annotated in red, yellow and green in the upper right hand corner and in the main viewer window.
Figure 6
Figure 6
Modeling with Gorgon. A gallery of models constructed with Gorgon is shown. The models include (A) Rotavirus VP6 at 3.8 Å resolution (EMDB ID: 1461), (B) Mm-cpn at 4.3 Å resolution (EMDB ID: 5137), (C) GroEL at 4.2 Å resolution (EMDB ID: 5001), Aquaporin at 3.8 Å resolution (PDB ID: 1FQY) and (E) bacteriophage ε15 gp7 at 4.5 Å resolution (EMDB ID: 5003). The backbone traces are shown superimposed on the corresponding density colored from N- (blue) to C- (red) terminus.
Figure 7
Figure 7
Modeling Rotavirus VP6 with Gorgon. (A) The result of Gorgon's “Identify SSE” tools on the 3.8Å map of Rotavirus VP6 is shown. SSEs are shown as green cylinders (helices) and cyan planes (sheets). The density skeleton, colored in red (for curves) and yellow (for surfaces), is shown in the density and connects the visible SSEs. (B) The result of a helix-only SSE correspondence is shown. In the right panel, the sequence-to-structure assignment can be seen. Helices and sheets in this panel are colored correspondingly in the main Gorgon viewer. (C) Model construction is shown using the “Semi-Automatic atom placement” tool. In this example, the first two helices and their connecting loop have been built using the Helix and Atom Editor functions, respectively.
Figure 8
Figure 8
Errors in modeling VP6. The final VP6 model is shown in (A). Positions with a low-RMSD when compared to the crystal structure are shown in blue, while high RMSD regions are shown in red. Three regions are labeled and shown in zoomed in views in (B), (C) and (D) along with the X-ray structure (green model), the sequence (top line), secondary structure from the crystal structure (second line), JPRED secondary structure prediction (third line) and the final model's secondary structure. In (B), helix 1 fits well to the density and agrees well with the X-ray structure. In (C), an error in the starting residues of the sequence prediction of helix 2 resulted in a sequence shift during modeling. While the helix fits the density well, the model is off by approximately one turn, illustrated by GLN33 of the X-ray structure and ASP29 of the model occupying the same position in the density map. In (D), long loops between anchor points resulted in modeling errors in the large β-sheet region, labeled as region “3” in (A). This region is shifted by ~5 amino acids, resulting in the highest RMS deviations in the model.
Figure 9
Figure 9
Modeling Rice Dwarf Virus P8 at ~7Å resolution. A model for Rice Dwarf Virus VP6 was constructed using the de novo modeling tools in Gorgon despite its low resolution. In (A), Gorgon's secondary structure detection routines were able to identify all twelve helices and both large β-sheets. However, the density skeleton (in red in B), contained a large number of breaks and branch points, particularly in the upper domain. Gorgon's SSE correspondence routine was able to correctly identify a correspondence that matched all twelve helices with those identified by secondary structure prediction. A final model for the N- (blue) and C- (red) terminal portions of the lower domain of P8 was constructed (D). A single helix in the upper domain (green) was also modeled but not connected to the two termini. The model for the lower domain agreed well with the X-ray structure of P8 (grey ribbon, PDB ID: 1UF2) (E). In examining the model, many of the loops connecting helices varied somewhat from the X-ray structure (F). Additionally, the inability to align the helices to the density resulted in modeling errors, shown by ALA348 (model) and ASP350 (X-ray structure) in (F).

References

    1. Abeysinghe S, Baker ML, Chiu W, Ju T. Semi-isometric registration of line features for flexible fitting of protein structures. Computer Graphics Forum (Proceedings of Pacific Graphics 2010) 2010. - PMC - PubMed
    1. Abeysinghe S, Ju T, Baker ML, Chiu W. Shape modeling and matching in identifying 3D protein structures. COMPUT AIDED DESIGN. 2008a;40:708–720.
    1. Abeysinghe SS, Baker ML, Chiu W, Ju T. Segmentation-free skeletonization of grayscale volumes for shape understanding. IEEE International Conference on Shape Modeling and Applications. 2008b:63–71.
    1. Abeysinghe SS, Ju T. Interactive skeletonization of intensity volumes. The Visual Compter. 2009;25:627–635.
    1. Baker ML, Baker MR, Hryc CF, Dimaio F. Analyses of subnanometer resolution cryo-EM density maps. Methods Enzymol. 2010;483:1–29. - PMC - PubMed

Publication types

LinkOut - more resources